Automated Synthesis Of Mobile Game
Environments And Rulesets Using A Hybridized
Interactive Evolutionary Programming Approach
Jia Hui Ong, Jason TeoSchool of Engineering and Information Technology , Universiti Malaysia Sabah, Kota Kinabalu, Malaysia; School of Engineering and Information Technology , Universiti Malaysia Sabah, Kota Kinabalu, Malaysia Email: [email protected]; [email protected]
ABSTRACT: By hybridizing Evolutionary Programming (EP) with Interactive Evolutionary Algorithm (IEA), game rules and its playing environment will be automatically generated for an arcade-type game that can be played on the Android mobile platform. In this study, mutation rates of 0.7 and 0.9 are used to generate both the game rules and the game environment for the mobile game. Players are used as the evaluator instead of the conventional mathe-matical fitness functions and hence the motivation for using high mutation rate is that they are able to generate higherlevels of diversity during the opti-mization runs. This interactive mode of game-playing cum evaluation will enable the creation of games that can fit the user’s preferences as well as styles of game-playing. Experiments show a very positive result where very good evaluation scores were obtained from the users. This shows that with a high mutation rate, the hybridized EP with IEA approach can generate rules and environments that are well-accepted and liked by human players.
Keywords : Evolutionary Programming; Interactive Evolutionary Algorithm; Games Rules; Aracade Game; Hybridized Evolutionary Algorithm with Interac-tive Evolutionary Algorithm; Mobile Game
1
I
NTRODUCTIONTHE advancement of mobile technology has allowed more work to be done on mobile platforms and more people now prefer to get their tasks done on mobile platforms as it allows mobility for the users to perform various activities such as reading a docu-ment, editing a docudocu-ment, emailing, video conferencing and many more. This has propelled the sales of smartphones around the world, where more than 225 millionsmartphones were sold worldwide in the second quarter of 2013, about a 46.5% increase from the second quarter of 2012 [1].There are an estimated 4.55 billion people worldwide that are using smart-phones in 2014 [2]. While smartphone technology enables work to be done on the go, many users also use their devices for en-tertainment purposes. In a survey done by Google Inc., there are about 88% will use their devices for entertainment purpose and of these, 63% will use their device to play games. In this study, a hybrid Evolutionary Algorithm (EA) has been proposed to automatedthe synthesis of both game environments and game rules for mobile game development. Conventionally, EA-shavebeen used as optimization techniques as inspiredby na-ture. It has four different classes, which are Genetic Algorithms (GA), Evolutionary Programming (EP), Evolution Strategies (ES), and Genetic programming (GP) [5]. EAsrevolvethe use of a genetic operators within an iterated,population-based search systemEach class typically use different approaches for solving the problems at hand. Interactive Evolution Algorithm (IEA) is a branch from EA which uses human users to evaluate the quality of the individual solutions [11] as opposed to the conventional EAs where the quality of the solutions are calculated based on formulas. Music [8], games [9], graphical arts [10], are among problem domains that have used IEAs. A game has been created on the Android platform that will serve as the test bed to to run the automated generation of the game environment and game rulesets. The motivation for focusing on the higher range of mutation rates is due to the IEA constraints where human fatigue often plays a critical part in affecting the quality of the evaluations. Hence to speed up the evolutionary process, the need to use higher mutation rates that will create a far more diverse search set is crucial in order to obtain good results in a
short period. The organization of this paper is as follows. Sec-tion II draws out the methods that we have used in this study, a more in-depth explanation of the game mechanism and how EP and IEA are implemented into the game. Section III describes the experimental setup that we have used and the results and discussion will be given in Section IV. We will conclude our study and discuss some future work recommendations in the last section.
2
M
ETHODProcedural content generation (PCG) is a method that has been used to automatically generate game contents. Contents that are involved here does not count the creation of artificial intelligence for non-player character (NPC) [3] but it is more on the terrain, stories, maps, and others elements that made up the game. Studies have been done using PCG on generating platform levels [7] and even some used it to generate maps in a large scales game like Real-time strategy (RTS) game gen [5]. Togelius and Schmidhuber [6] had conducted a study that involved generating a game rules instead of the environments. This has given us the idea to create a game that contains no rules and hence letting the PCG to work on the rules genera-tions.
2.1 Game Design
This game is created to be able to run on Android OS 2.2, the screen size of the game is set to fit in a HVGA mobile display with a dimension of 430 x 320 pixels. The game is built upon a few components such as elements, walls, collision, and scor-ing. Below are the details of elements and walls as follow.
Elements
o Red elements
o Blue elements
o Green elements
o Cyan elements
o Yellow elements
Walls
o 20 x 320 pixels upper and lower border
o 430 x 10 pixels left and right border
o 30 x 30 pixels of square walls
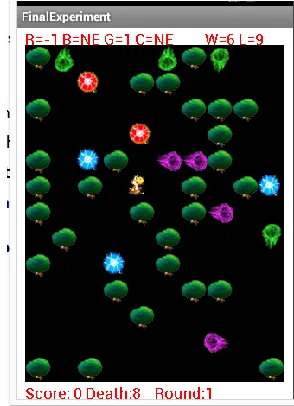
Each element is in a animated image with their respective col-ors, and the size of the image is 30 x 30 pixels. The yellow element a dino is used by the users to navigate in the game environment. As for the position of each element is place ran-domly at the beginning of the game except for yellow ele-ment’s position is fixed in the center of the environment. Walls served as a restriction for all the elements, upper, lower, left, and right border walls will restrict elements and player from moving out from the game environment. The 30 white square walls will be place according to the position generated by the EP. Fig. 1 shows how these elements and walls placement looks like when they are place together into a mobile environ-ment.
Fig. 1. Example of the elements place in the actual game envi-ronment
TABLE1
ELEMENTS MOVEMENT
Elements Movement
Yellow Vertical and Horizontal
Red Static
Blue Static
Green Vertical Cyan Horizontal
Each element’s movement has been set accordingly where red and blue will be static while green element can only move in vertical directions and cyan elements can only move in ver-tical directions. Table 1 shows the overall movement for the elements in the game. Moving to the collision component, there are three events that might occur after each elements collide with each other.
None (no effect) – 0
Death (elements is deleted from the environment) – 1
Teleports ( elements get teleport back to a locations) – 2
Notice that the number at the end of 0, 1, and 2 it represents the effect in our chromosome. In order for these collisions to take effect, we have structured a collision effect table that will enable a lookup for each collision that happens and hence giving the proper effects that associate with it. Table 2 shows the collision structure that we have created
TABLE2
COLLISION EFFECT
Elements Yellow Red Blue Green Cyan
Yellow - C1 C2 C3 C4
Red C1 - - C5 C6
Blue C2 - - C7 C8
Green C3 C5 C7 - C9
Cyan C4 C6 C8 C9 -
C1: Yellow and Red element collision C2: Yellow and Blue element collision C3: Yellow and Green element collision C4: Yellow and Cyan element collision C5: Green and Red element collision C6: Cyan and Red element collision C7: Green and Blue element collision C8: Cyan and Blue element collision C9: Green and Cyan element collision
The “-“ in the table represent collision effect that has been tak-en out, the reason that we took it out is due to the movemtak-ent of the elements for example, is not possible for red and blue to collide with each other since they are in a static position. Another important component for the game is the scoring sys-tems. Each collision will have a score linked to it as shown in Table 3. The score are 0, 1, or -1.
TABLE 3
ELEMENTS MOVEMENT LINK TO SCORE
Elements Score
C1 S1
C2 S2
C3 S3
C4 S5
C5 S5
C6 S6
C7 S7
C8 S8
C9 S9
2.2 Evolutionary Algorithm
well as the losing point. The number of elements of each type is range from 1 to 5 meaning that each color elements will have none to a maximum of 5 that can be present in the game. Population size is set to three as we do not want to in-crease the fatigue of the human tester as the larger the popu-lation size increase, more evaluation has to be done by a tes-ter in order to complete a full run. The same goes to the num-ber of generations as we want to keep the time durations low-er, hence the number of generations is set to be 20. Below is the flow of the overall EP
1.0 Start
2.0 Random initialization for parent chromosome. The value of the each phenotype is illustrate below
2.1 Phenotype value for position from 0 to 8 – range from 0 to 2
C1 C2 C3 C4 C5 C6 C7 C8 C9
2.2 Phenotype value for position from 9 to 17 – range from 0 to 2
S1 S2 S3 S4 S5 S6 S7 S8 S9
2.3 Phenotype value for position from 18 to 21 – range from 0 to 5
R B G C
2.4 Phenotype value for position from 22 to 23 – range from 0 to max number of total elements
W L
3.0 Parent is loaded into the game environment and eva-luated
3.1 Repeat step 1.0 to 3.0 until the number of individ-ual parent reach 3
4.0 Select the best individual parent to seed for next genera-tions offspring
5.0 Generate offspring from parent
6.0 Offspring is loaded into the game environment and eva-luated
6.1 Step 5.0 to 6.0 is repeated until the number of offspring reaches 3
7.0 Select the best offspring from the populations pool to be parent for next generations
8.0 Step 5.0 to 7.0 is repeated until the number of generations reached 20
2.3 Interactive Evolution Algorithm
IEA has two different evaluation methods which is reactive and proactive feedbacks. In reactive feedbacks algorithms, it re-quires human evaluator to give their feedbacks after the game or it can also allow the human evaluator to intervene the auto-nomously running algorithm [4]. Proactive feedbacks algorithm allows human evaluator to pause the algorithm at stagnation stage and alters the parameters in the algorithm before allow-ing it to continue with its process [4]. Reactive feedback has been chosen to be the IEA feedback method in this paper. Human evaluator has been given a score range of 0 to 7 where 0 represent the lowest score value and 7 represent the highest score value for the particular individual. For papers
accepted for publication, it is essential that the electronic ver-sion of the manuscript and artwork match the hardcopy exact-ly! The quality and accuracy of the content of the electronic material submitted is crucial since the content is not recreated, but rather converted into the final published version.
3
E
XPERIMENTS
ETUPThe experiment has been conducted with the help from a group human tester from a faculty. The tester has been brief with the information of how to play the game and how to as-sign a score for each game generated. Below is the procedure that they need to go through to complete a full run of the game
1.0 Start
2.0 A game rules is loaded into the game environment
3.0 Tester played with the game rules and assign score at the end of the game.
4.0 Step 1.0 to 3.0 will be repeated 60 times since each gen-eration has 3 individuals and the number of gengen-erations has been set to be at 20.
Ten users will play with each mutation rate of 0.7 and 0.9 re-spectively.
TABLE4
ELEMENTS MOVEMENT LINK TO SCORE
Users Highest Score
Total Score
Average score
Standard deviation
1 7 218 3.63 1.44
2 7 213 3.55 1.58
3 7 222 3.70 1.37
4 7 209 3.48 1.42
5 7 214 3.57 1.52
6 7 210 3.50 1.51
7 6 156 2.60 1.58
8 7 208 3.47 1.47
9 7 240 4.00 1.62
10 7 188 3.13 1.96
TABLE5
HIGH SCORE OF EACH GENERATION FOR USER NO.9
Generations Highest Score
1 4
2 4
3 5
4 5
5 4
6 4
7 4
8 4
9 6
10 6
11 6
12 6
13 6
14 5
15 4
16 5
18 7
19 7
20 5
Shown in Table 4 are the results obtained from mutation rate 0.7. The highest average score among the ten users is 4.00 with a total score of 240 and the lowest average score is 2.60 with a total score of 156. 6 out of 10 users’ average scores passed the 3.50 mark which is considered as the midpoint of the score value of 7. From Table 4, all the users’ highest score given is 7, suggesting that users were highly satisfied and very much liked the particular rule set evolved. Table 5 shows the score of the highest individuals of each generation for user no.9. From Table 5, it can be seen that each generation’s highest score were never less than 4. The score given reflects the quality of the rule set generated in each generation were in the satisfactory region. In 8 out of 20 generations, the highest individuals scored more than 5. Highly desirable rule sets first appear in the 10th generation and this can be considered as fast generation of good rules set that fulfil the user’s prefer-ences. Referring back to Table 4, user no.7 yields the lowest score among all other users. In Table 6 shows the details of the highest score given in each generation for user no.7. From Table 6, in the 6th generation the highest score obtained was 6 and this should be a good indication that the following genera-tions will yield good results as good individuals appeared at an early stage of the evolution. But instead of showing positive results, the later generations showed a significant drop in rule set quality as seen from Table 6 where the highest score de-creased after the 6th generation before going back up again in the 16th generations but yet again it drops down at the 19th generations. It can be assumed that the individuals have ex-perienced undesirable mutations of the rule set and could di-versity into more favourable regions of the search space. Nonetheless, fairly desirable rule sets did appear during the IEA process albeit relatively infrequently as compared to other users’ IEA runs.
TABLE6
HIGH SCORE OF EACH GENERATION FOR USER NO.7
Table 7 shows the generations where the first highest score were given by the users. Users No.1, No.3 and No.8 gives the highest score at the last generation, therefore it can be ob-served that the rule sets generated moved towards the users preferences after significant rounds of IEA generations. Table 8 shows the results obtained from experiment with mutation rate 0.9. The highest average score for mutation rate 0.9 was 3.67 with a total score of 220while the lowest average score was 2.93 with a total score of 176. There is only one user’s average score that is below 3.00 while 6 out of 10 user’s aver-age ratings are above 3.50. The highest score given by all the ten users were 7 which can be concluded that the rule set generated were all highly playable and desirable within the users’ preferences and liking. So to solidify the findings, further investigations on the results obtained are done by analyzing the highest and lowest average scores obtained.
TABLE7
FIRST APPERANCE OF HIGH SCORE FOR EACH USER
User Generations Highest Score
1 20th 7
2 15th 7
3 20th 7
4 18th 7
5 15th 7
6 18th 7
7 6th 6
8 20th 7
9 16th 7
10 11th 7
TABLE8
RESULTS FOR MUTATION RATE 0.9
Users Highest Score
Total Score
Average Score
Standard Deviation
1 7 216 3.60 2.00
2 7 220 3.67 1.81
3 7 217 3.62 1.46
4 7 203 3.38 1.62
5 7 209 3.48 1.57
6 7 196 3.27 1.62
7 7 218 3.63 1.60
8 7 176 2.93 1.31
9 7 216 3.60 1.42
10 7 214 3.57 1.53
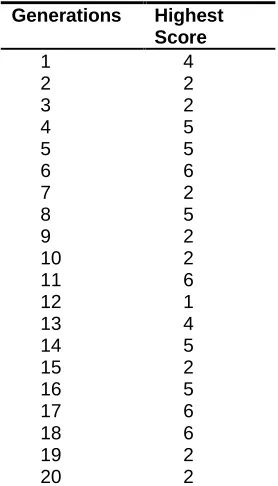
The highest score of each generation in user no.2 is shown in Table 9. From the table, the highest score given for each gen-eration were never less than 4 and 9 gengen-erations obtained the score from 6 to 7, which represents about 45% of the rules set generated reached the user’s liking and preferences. Out of those 9 generations, 5 managed to get the maximum highest score of 7. The first appearance of the high score of 7 is in the 10th generation which is considered quite a fast search for a good rule set by the EP Table 10 shows the highest score of each generation for user no.8. The lowest score in the table is 3 and is still in an acceptable range of score. Although user no.8has the lowest average scores among all users, it still has six generations that have a score of more than 5. Among the six high score generations, four of them did actually attain the maximum score of 7. In this case for user no.8, again the likely
Generations Highest Score
1 4
2 2
3 2
4 5
5 5
6 6
7 2
8 5
9 2
10 2
11 6
12 1
13 4
14 5
15 2
16 5
17 6
18 6
19 2
reason is that the large majority of the mutations resulted in undesirable results for this. Looking at the Table 4 and Table 8, it can be observed that mutation rate 0.7 yields a slightly better result as compared to mutation rate 0.9. The highest average in mutation 0.7 is 4.00 while mutation rate 0.9 yields the high-est average rate of 3.67. The experiment using mutation rate of 0.7 likely maintained more of the parent’s traits in the solu-tion sets as compared to those in mutasolu-tion rate of 0.9 due to the 20% higher mutation chances compared to mutation rate of 0.7.
TABLE9
HIGHEST SCORE GIVEN IN EACH GENERATION FOR USER NO.2
Generations Highest Score
1 5
2 4
3 5
4 6
5 6
6 5
7 4
8 4
9 6
10 7
11 7
12 4
13 4
14 4
15 6
16 5
17 7
18 7
19 5
20 7
TABLE10
HIGHEST SCORE GIVEN IN EACH GENERATION FOR USER NO.8
As demonstrated in this document, the numbering for sections upper case Arabic numerals, then upper case Arabic numer-als, separated by periods. Initial paragraphs after the section title are not indented. Only the initial, introductory paragraph has a drop cap.
4
C
ONCLUSIONA
NDF
UTUREW
ORKIn this paper, a game has been created to become a fully auto-generated and evolvable game by the EP through the IEA process. By making the environment evolvable by the EP, the game becomes more interesting to users. Two different muta-tion rates identified from the previous chapter were tested in this investigation, which isthe0.7 and 0.9 mutation rates. The results obtained show that mutation rate of 0.7 performed slightly better than 0.9. As such, the game has been success-fully changed to completely adapt to the users preferences for both the rule set as well as game environment.
A
CKNOWLEDGEMENTThis research is funded by the FRGS Research project FRGS0213-TK-2010 granted by the Ministry of Science, Technology and Innovation, Malaysia.
R
EFERENCES[1] Gartner Gartner. 2013. Gartner Says Smartphone Sales Grew 46.5 Percent in Second Quarter of 2013 and Exceeded Feature Phone Sales for First Time. August 14 2013 http://www.gartner.com/newsroom/id/2573415
[2] J. Koetsier. 2013. 800 million Android smartphones, 300 million iPhones in active use by December 2013, study says. Venture Beat News. 6 February http://venturebeat.com/2013/02/06/800-million-android- smartphones-300-million-iphones-in-active-use-by-december-2013-study-says/
[3] J.Togelius, G.N.Yannakakis, K.O.Stanley, C.Browne (2010). “Search-based Procedural Content Generation.” In EvoStar Conference.
[4] R.Breukelaar, M.Emmerich, T.Bӓck (2006). “On Interactive Evolution Strategies.” In EvoWorkshops, 530-541.
[5] J.Togelius, M. Preuss, G.N.Yannakakis (2010).“Towards Multiobjective Procedural Map Generation.”In Workshop on Procedural Content Generation in Games.
[6] J. Togelius, J. Schmidhuber (2008). “An experiment in automatic game design.”In IEEE Symposium on Computa-tional Intelligence and Games.
[7] K.Compton, M.Mateas (2006).“Level Design for platform Games.”In Second Artificial Intelligence and Interactive Digital Entertainment International Conference (AIIDE) Marina del Rey.
[8] Horowitz (1994). “Generating rhythms with genetic algo-rithms.”In International Computer Music Conference, 142-143.
[9] E.J.Hastings, K.G.Ratan, K. O. Stanley (2009).“Evolving Content in the Galactic Arms Race Video Game.”InIEEE
Generations Highest Score
1 4
2 5
3 4
4 4
5 5
6 5
7 6
8 4
9 7
10 3
11 3
12 6
13 3
14 5
15 7
16 7
17 7
18 4
19 3
Symposium on Computational Intelligence and Games (CIG09). Piscataway, NJ:IEEE.
[10]P.J. Angeline (1996). “Evolving Fractal Movies.”In: 1stAnnual Conference on Generic Programming Stand-ford, Ca, USA, 503-511.
[11]H.Takagi (2001). “Interactive Evolutionary Computa-tion:Fusion of the Capabilities of EC Optimization and Human Evaluation.” . In IEEE 2001,vol.89, 1275-1296.
[12]A.E.Eiben, J.E.Smith.“Introduction to Evolutionary Compu-ting.”2003.
[13]ThinkMobile and Google (2011). “The Mobile Movement.” http://www.gstatic.com/ads/research/en/2011_TheMobileM ovement.pdf