ISSN (e): 2250-3021, ISSN (p): 2278-8719
Vol. 09, Issue 6 (June. 2019), ||S (II) || PP 43-47
Development of Financial Prediction System Using Natural Lang
Processing
Gayatri B. Patil
1, Prof. Dr. Nitin N. Patil
2.
PG Student, Department of Computer Engineering, R. C. Patel Institute of Technology Shirpur, India. Head & Associate Professor, Department of Computer Engineering R. C. Patel Institute of Technology Shirpur,
India.
Corresponding Author:Gayatri B. Patil
Abstract:
In financial stock market, final prices modify day-to-day at the end of each meeting. These modifications occur because of many issues that disturb the prices of the stocks. In our implementation, we used K-means algorithm to accurately calculate final prices by applying a data mining methodology. We examine and identify the most influential factors of Dubai Financial Stock Market prices. The main aim of this process is to help depositors to plan their future stock chances precisely. Two algorithms are used in this method i.e. supervised and unsupervised algorithms.It provides an efficient mechanism for the highly available CPU intensive process of big data analysis with help of cloud computing framework for analyzing and predicting the market closing values on the basis on external factors.Keywords: Financial Market, Natural Language Processing, Data Mining, Cloud Computing.
--- --- Date of Submission: 02-06-2019 Date of acceptance: 17-06-2019 --- ---
I.
INTRODUCTION
A stock market or share market is the collection of consumers and retailers (also called shares)which represent ownership claims on businesses. These may include securities listed on a public as well as those only traded privately. Financial and stock markets are the driving-force for economic growth and stability as they significantly contribute to the flow of resources which leads to productive investment opportunities. Stock and securities prices frequently change in stock markets [1].
During particular times of the year, it is quite common to notice that stock prices are frequently appreciated every morning and this may take place several times during a given day for some stocks [2]. This indicates that stock prices are affected by many factors. However, the factors behind increases or decreases in the demand and supply of a particular stock could be due to company’s fundamentals, internal or external factors and other market behaviors. But to pinpoint to a specific factor due to the different conditions and scenarios that surround each stock market environment is a tough task. Different economy or market has its own policy, procedures, rules and regulations, country location, type of the stockholders and other unique factors [3]. The main issues those comprise data quality are accuracy, fullness, steadiness, timeliness and interpretability. Inaccurate and incomplete data are common-place properties of financial data. There is a general agreement that the basic external factors include government policy, instructions and guidelines, economy stability, inflation and other economic conditions, such as Gross Domestic Product, Money Supply, oil or gas or gold prices or environmental circumstances which could have direct links with the production of the company [5].
II.
LITERATURE SURVEY
D. Kumar and S. Murugan have introduced a new method by combining time-series data with Artificial Neural Network (ANN). This prediction model is based on a feed-forward ANN with back propagation. The performance of the prediction model is analyzed using some factors. The key factor includes Mean Absolute Error (MAE), Mean Absolute Percentage Error (MAPE), Percentage Mean Absolute Deviation (PMAD) and Mean Squared Error (MSE). This performance is calculated by BSE100 and NIFTY MIDCAP50[1].
K. Abhishek, A. Khairwa, T. Pratap and S. Prakash have developed a forecasting model for the Microsoft Corporation. This forecasting model includes a two-step procedure. In first-step, ANN go through training with the genetic algorithm. This algorithm teaches the prediction model to identify the new trends. In a second step the results are obtained by analyzing the trained prediction model to the dataset[2].
algorithm is used to predict the stock price. The classification accuracy is boosted by feedback basedfeature selection[3].
Arti Buche and Dr. M. B. Chandak discuss the text opining mining in stock market reviews of Economic Times. This method deals with the polarity of the text in two processes, namely POS tagger and SentiWordNet. This method is implemented by Natural processing language and statistical parameter. This paper has surveyed on different methods to highlight the factors that have an impact on market price[4].
Z. Khan, T. Alin and Md. A. Hussain highlighted the consequences in prediction of stock value. The system is incorporated by backward propagation with artificial neural network. The general index (GI), net asset value (NAV), earnings per share (EPS) and volume of the market may affect the market movement. The system with this algorithm is experimented in BSE stock market[5].
III.
METHODOLOGY
Various techniques have been used for predicting stock prices, ranging from traditional models to recent data mining and artificial neural network techniques. Most of the past literature related to predicting stock prices is centered on traditional models, such as time series and linear programming. Mostly time series is used for the prediction of stock prices. Previous study has concluded that the time series of closing prices have pattern and could not be random. The approach must provide historical, current and predictive views of business operations.
The aim is to allow for the easy interpretation of big data. Identifying new opportunities and implementing an effective strategy based on insights can provide businesses with a competitive market advantage and long-term stability. The issues of data quality in predicting stock prices have an important role in improving the accuracy of the predicted class. The main factors that comprise data quality are accuracy, completeness, consistency, timeliness, believability and interpretability. Inaccurate, incomplete and inconsistent data are common-place properties of financial data.
The figure 1 describes an efficient mechanism for the highly available CPU intensive process of big data analysis with help of cloud computing framework for analyzing and predicting the market closing values on the basis on external factors. InProcessing after flow to processing to maintain required data, restricted in cloud. In Aggregation and compilation data should be use through aggregation and compilation while using algorithm. In analysis and decision:-The data analysis and making decision what type data we will manage and after extracting feature then using machine learning performance predict value.Load Balancing is used of the high speed for acquired through website to manage and save to club when they internally load balancing [6, 7].
Some other internal factors also include, earning per share, dividend per share, book values. However, the most important internal factors remain to be the earning per share (EPS), dividend yield (DY), and dividend per share (DPS). DY is a financial ratio that shows how much a company pays out in dividends (per year) relative to its share price. DY is calculated using the cash dividend divided by outstanding shares by closing price. The classing value detection system architecture in that we will be perform some following stages [6, 7].
1. Pre-processing: The data pre-processing step typically includes data cleaning, normalization or transformation and feature selection to prepare the data for examination. In that stage we will be perform the incoming raw data i.e. new we provide structure format and we will be used required data and another data are discarded as shown in Figure. 1.
2. Data Checking: Reliability checking accuracy and find prediction and repeated data are detected and wrong data deleted.
3. Data Storage Decision: we will be used Naive based algorithm[8, 9]. 4. Offline data storage: In that database are stored for the used future purposed.
In Proposed system, we are taking input in two formats –
The K-means algorithm is one of the simplest clustering techniques and it is commonly used in medical imaging, biometrics, and any fields. The main advantages of k-means clustering is that it tell about your data rather than you having to instruct the algorithm about the data at the start [10].
Algorithm I: Data Acquisition and Filtration Algorithm
Input: Live Data Feed process data set
Output: filtered data in key value pair and send this to processing Mechanism Steps:
1. Filter related data i.e. processed data. All other unnecessary data will be discarded. 2. Divide the Data into Appropriate Key Value Pair.
3. Transmit Unprocessed data directly to aggregation step without processing.
4. Assign and transmit each distinct data block of processed data to various processing steps in Data Processing Unit.
This algorithm takes live RSS Feed Data and then filters and divides them into segments and performs approximation algorithm. In step 1, related details filtered out. And in step 2, filtered data are the association of different key value pairs and each pair is different numbers of sample, which results in forming a data block. In Next steps, these blocks are forwardedto process by Data Processing Unitas shown in Figure 1 [10, 11].
Algorithm II: Processing and Calculation Algorithm
Input: Filtered Data
Output: Normalized News data into Numerical comparable form Along with Historical Values. Steps:
1. For each event data, relevant Historical Data is extracted. 2. Normalize this for all the live feed.
3. Persist the data into data store and forward it [12, 13].
IV.
EXPERIMENTAL RESULTS
Figure 2: Experimental Graph.
Model accuracy might also be enhanced by using more classifiers in the classification algorithm. Our proposed modified system gives best result than existing system as shown in above Figure 2.
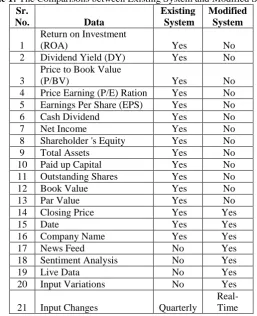
The following Table 1, summarizes the comparative results with the existing system.
Table 1: The Comparisons between Existing System and Modified System Sr.
No. Data
Existing System
Modified System
1
Return on Investment
(ROA) Yes No
2 Dividend Yield (DY) Yes No
3
Price to Book Value
(P/BV) Yes No
4 Price Earning (P/E) Ration Yes No
5 Earnings Per Share (EPS) Yes No
6 Cash Dividend Yes No
7 Net Income Yes No
8 Shareholder 's Equity Yes No
9 Total Assets Yes No
10 Paid up Capital Yes No
11 Outstanding Shares Yes No
12 Book Value Yes No
13 Par Value Yes No
14 Closing Price Yes Yes
15 Date Yes Yes
16 Company Name Yes Yes
17 News Feed No Yes
18 Sentiment Analysis No Yes
19 Live Data No Yes
20 Input Variations No Yes
21 Input Changes Quarterly
Real-Time
V.
CONCLUSIONS AND FUTURE WORK
In this paper, we have proposed modified market closing process using K-Means algorithm. This study builds a model for predicting the closing market value for the nifty 50 based on the sentiment analysis to deliver an efficient instrument for the highly available CPU intensive procedure of big data analysis with help of cloud computing framework for analysis with help of aloud computing framework for analyzing & predicating the market closing values on the basin external factors. The program will beready for use by potential investors, but the authorsshares not invested in the Stock Exchange and do nottake responsibility for profits and losses of potentialusers.
REFERENCES
[1]. N. Molodovsky, “A theory of price-earnings ratios,” Financial Analysts Journal, pp. 29-43, 1995. [2]. J. B. Williams, “The theory of investment value Cambridge,” MA: Harvard University Press., vol. 36,
1938.
[3]. Noura Aldarmaki, Elfadil A. Mohamed, Noura AlMansouri and Ibrahim Elsiddig Ahmed “Prediction of
the Closing Price in the Dubai Financial Market: A Data Mining Approach,” in MEC International Conference on Big Data and Smart City, 2016.
[4]. R. E. Howitt, “Positive mathematical programming,” American journal of agricultural economics, pp. 329-342, 1995. A
[5]. J. Jarrett and E. Kyper, “Evidence on the seasonality of stock market prices of firms traded on organized markets,” Applied Economics Letters, pp. 537-543, 2005.
[6]. W. Zhang, Q. Cao and M. J. Schniederjans, “Neural network earnings per share forecasting models: a comparative analysis of alternative methods,” Decision Sciences, pp. 205-237, 2004.
[7]. K. J. Kim and I. Han, “Genetic algorithms approach to feature discretization in artificial neural networks for the prediction of a stock price index,” Expert systems with Applications, pp. 125-132, 2000.
[8]. Y. F. Wang, “Predicting stock price using fuzzy grey prediction system,” Expert Systems with Applications, pp. 33-38, 2002.
[9]. E. David and T. Suraphan, “The use of data mining and neural Networks for forecasting stock market returns,” Expert Systems with Applications, 2005.
[10]. Baohua Wang, Hejiao Huang and Xiaolong Wang, “A novel text mining approach to financial time series
forecasting,” Neuro-computing, pp. 136-145, 2012.
[11]. L. A. Shalabi, Z. Shaaban and B. Kasasbeh, “Data Mining: A Preprocessing Engine,” J. Comput. Sci., pp.
735-739, 2006.
[12]. Jebaseeli, A. Nisha and E. Kirubakaran. “Preprocessing Technique for Classification of M-Learning Reviews using Soft Computing Approach,” Artificial Intelligent Systems and Machine Learning 5.5, pp. 199-203, 2013.
[13]. Chien-Ho Wu; Jung-Bin Li; Tsair-Yuan Chang, “SLinRA2S: A Simple Linear Regression Analysis
Assisting System,”e-Business Engineering (ICEBE), IEEE 10th International Conference, pp. 219-223, Sept. 2013.