The Study On The Effect And Determinants
Of Small - And Medium-Sized Entities
Conducting Tax Avoidance
Jeong Ho Kim, Silla University, South Korea
Chae Chang Im, Hankuk University of Foreign Studies, South Korea
ABSTRACT
SME often lack the capacity to keep transparency in management due to a small number of information users. Thus, the adoption of K-IFRS can be burdensome to numerous SME, which led to the enactment of Accounting Standards for Small- and Medium-sized Entities (AS-SME). AS-SME allows the accountants to easily implement accounting rules when writing financial statements and the users to comprehend useful information.
SME hold less tax burden since they receive a tax deduction and exemption from the Tax Act. Thus, we conjecture that the financial determinants of tax avoidance between SME and non-SME will differ. We divide the total sample according to the corporate tax avoidance and empirically examine whether the difference actually exists.
Our sample consists 18,954 audited firms including those external audited from 2011 to 2013. This study implements BTD, the difference between accounting profit and taxable income and estimated corporate tax avoidance (TS), which is the part that cannot be explained by total accruals in BTD to proxy for tax avoidance. (Desai and Dharmapala 2006).
We summarize our findings as below: there is a significant distinction between SME and non-SME regarding the related financial determinants. The result shows that firm size (SIZE), profitability (ROA), leverage (LEV), operating cash flow(CFO), capital intensity (PPE), R&D intensity (RNDS), and growth rate (GS) all influence the corporate tax avoidance of SME. Our result also suggests that there is variation in the determinants among the SME with high corporate tax avoidance.
The attempt to investigate the financial determinants of the tax avoidance in SME can be a barometer of the effectiveness of AS-SME, which is enacted to lessen the tax burden of the SME. We intend to provide policy implication regarding SME subsidy by examining the motive for corporate tax avoidance in SME.
Keywords: SME; Tax Avoidance; Financial Determinants; BTD; TS
1. INTRODUCTION
such different accounting standards1 following business surroundings can influence financial determinants and corporate tax avoidance among SME.
Effective tax rates (ETR) is generally adopted to proxy for corporate tax avoidance. It provides information about the tax burden of a firm and influence of tax on business. We use both book-tax gap (BTD) which is the difference between accounting profit and taxable income and TS, the estimated corporate tax avoidance proposed in Desai and Dharmapala (2006) to proxy for tax avoidance. Then we investigate numerous determinants that affect decision-making process relevant to finance, investment and operation activities.
Plethora of studies on tax avoidance focused on listed firms; however little attention was given to SME. Along with the K-IFRS adoption, the enactment of AS-SME has changed the accounting environment for SME. Following enactment of AS-SME, the significance of studies that underscore subsidizing SME increased. We conjecture SME have fewer motives for tax avoidance than non-SME for they are beneficiaries of the tax cut provisions and tax subsidy from SME aid policy. Moreover, unlike general listed firms, SME contain distinctive financial structure. Thus, we investigate financial determinants that influence SME’s corporate tax avoidance.
Tax avoidance is defined as an ambiguous firm conduct that can either implicitly or explicitly diminish the tax burden of the firm. If the taxing authority determines the tax avoidance of the firm as tax evasion rather than tax saving, the firm is charged with direct tax including the originally imposed tax and the additional tax amount. Yet aside from direct tax expense, the firm confronts indirect tax burden which encompasses social condemnation and following stock price crash as well as sales decrease (Anderson & Frankle, 1980; Richardson & Welker, 2001; Dhaliwal, Li, Tsang & Yang, 2010; Andrews et al., 2019). As contradictory stances exist, the present study intends to find financial determinants of tax avoidance in SME and empirically explain the underlying motive of tax avoidance in SME. In the additional analysis, we find financial determinants that affect the involvement degree in tax avoidance among the SME.
The remainder of this article is structured as follows. In Section Ⅱ, we describe the previous literature and the enactment of AS-SME. In Section Ⅲ we present the hypotheses and research model, and in Section Ⅳ we present the empirical results of financial factors that explain corporate tax avoidance of SME. Concluding remarks encompassing summary and limitations are discussed in Section Ⅴ.
2. LITERATURE REVIEW ON AS-SME AND TAX AVOIDANCE
2.1 AS-SME (Accounting Standards for Small- and Medium-sized Entities)
2.1.1 Background of AS-SME Enactment
The firms enlisted on the Korean financial market is mandated to report the financial statement following IFRS rather than K-GAAP from 2011 in an attempt to elevate accounting transparency and to establish East Asia’s financial hub. Such radical changes in accounting environment alter the quality of accounting information and indirectly have an impact on the firm’s information users, not to mention the firm’s financing and investing activities. Since the firms are obligated to apply K-IFRS when writing their financial statement from 2011, the fiscal year also starts from 1st of January, 2011.
Due to the difficulty in adopting IFRS, there had been a continuous demand for the accounting standard for small SME, where the number of information users is relatively marginal and accounting capacity is in short. The requested standard should be easy to use for the accountant as well as provide useful information for decision making. Recent reform in enforcement decree of Commercial Act1 allowed the Minister of Law to determine additional accounting standards for financial reporting with regards to firms not subjected to external auditing. Mainly focused on the transactions that take place in SME, AS-SME was enacted. AS-SME was simpler than
1 The Commercial Act Enforcement 15 (Accounting Principle) requires the Minister of Law to discuss with Financial and Service Commission
GAAP and easier to adopt thereby reducing the adoption expense. some of AS-SME provisions differ from that of general accounting standards.
Table 1. Proportion of Firms by Size Panel A. Firm Categorization by the Commercial Act
Category Companies Stock LLC Partnership Limited Partnership Unlimited Total
Number of firms 417,876 17,554 3,750 843 440,023
Percentage (%) 95.0 4.0 0.9 0.2 100.0
Panel B. Firm Categorization by Firm Size
Category Number of Firms Percentage (%)
Firm Size General Corporation 89,134 20.3
Small and Medium Corporation 350,899 79.7
Total 440,023 100.0
Panel C. Listed and Unlisted Firm
Listed Corporation Unlisted External Auditing Corporation
Listed Corporation, Corporation Not Including Unlisted External
Auditing Corporation Total Securities KOSDAQ
759 1,013 16,826 421,425 440,023
1,772
Note: Corporation Statistical Yearbook (Fiscal Year 2010)
Table 1 demonstrates descriptive statistics regarding the number of corporations in the Korea financial market in the year 2010. Panel A displays that among corporations, stock company constitute the most, approximately 95%, limited liability corporation (LLC) accounts for 4%, and partnership for roughly 1%. Panel B categorizes total corporations into small and medium size and general corporation according to the firm asset. According to SME standard, a number of small and medium-sized firms is 350,889, which is 80% of the total corporations on December 2010. Among these SME, firms subjected to external auditing2 numbers 18,589 and stock-listed corporation, 1,772. The number of firms categorized as SME is 421,425, which is 96% of the total firms and the rest including listed firms and firms subjected to external auditing accounts for 4%. As is seen in the numbers, even though the majority of corporations are SME, the Korean market concentrated on K-IFRS centered on listed firms. SME mostly have a relatively small number of information users and conduct simple transactions. Moreover, many SME firms are inept in accounting treatment. Thus, the necessity of adopting simple and clear accounting standards for SME has been raised.
2.1.2 Comparison of the Existing Accounting Standards
Accounting standards in Korea encompassing K-IFRS, K-GAAP, and AS for SME are tabulated in Table 2. The subjects of K-IFRS are the stock-listed corporation and financial institution. Those firms among the subject of external auditing not implementing K-IFRS are required to adopt K-GAAP. Ensuing the Commercial Act reform, firms not employing public enterprise accounting principle encompassing K-IFRS and K-GAAP can implement AS for SME. We summarize the type of corporations mandated and the law on which the obligation is based with regards to each accounting standard.
Table 2. Accounting Standards Categories
Category K-IFRS K-GAAP AS-SME
Corporation under Obligation
Stock-listed corporation and financial institutions (excluding some institutions)
Corporations subjected to external auditing regulation not implementing K-IFRS
Firms adopting neither K-IFRS nor K-GAAP nor public enterprise accounting standards
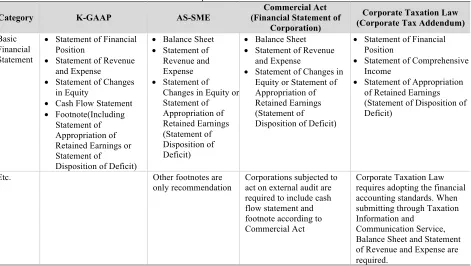
Whereas the adoption of K-IFRS or K-GAAP in the listed firms and financial institutions can be less burdening, the implementing K-IFRS or K-GAAP can be a setback for SME due to overweighing workload and additional expense. Therefore, accounting standards for SME that are easy to understand and apply and that provide useful information to information users are in great need. The crux for AS for SME is establishing accounting standards that do not conflict with other acts and that meet the demand for easy usage and understanding of the accounting treatment. As Table 3 demonstrates, AS for SME adopts Commercial Act unlike K-GAAP and requires the statement of financial position and statement of revenue and expense as the main financial statement and additional statement of equity changes or statement of retained earnings. The rest of the information are recommended to be detailed in the footnote. Although it is customary to compare previous and the corresponding fiscal year when writing the financial statement, AS for SME only allows writing for the corresponding fiscal year.
Table 3. Comparison in Financial Statement
Category K-GAAP AS-SME
Commercial Act (Financial Statement of
Corporation)
Corporate Taxation Law (Corporate Tax Addendum) Basic
Financial Statement
• Statement of Financial Position
• Statement of Revenue and Expense
• Statement of Changes in Equity
• Cash Flow Statement • Footnote(Including
Statement of Appropriation of Retained Earnings or Statement of
Disposition of Deficit)
• Balance Sheet • Statement of
Revenue and Expense • Statement of
Changes in Equity or Statement of Appropriation of Retained Earnings (Statement of Disposition of Deficit)
• Balance Sheet • Statement of Revenue
and Expense
• Statement of Changes in Equity or Statement of Appropriation of Retained Earnings (Statement of
Disposition of Deficit)
• Statement of Financial Position
• Statement of Comprehensive Income
• Statement of Appropriation of Retained Earnings (Statement of Disposition of Deficit)
Etc. Other footnotes are
only recommendation
Corporations subjected to act on external audit are required to include cash flow statement and footnote according to Commercial Act
Corporate Taxation Law requires adopting the financial accounting standards. When submitting through Taxation Information and
Communication Service, Balance Sheet and Statement of Revenue and Expense are required.
Note: Partial revision from AS for SME public draft
2.2 Literature Review
2.2.1 Definition of Tax Avoidance and Determinants
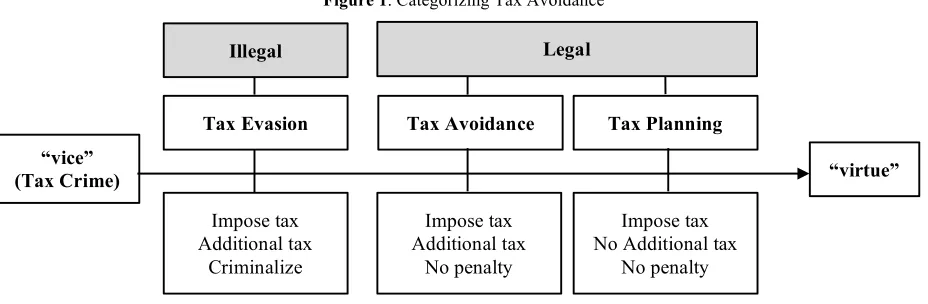
Even though it is distinctive in concept, the boundary between tax avoidance and tax evasion is inconclusive in practice. A particular act can be equivocally determined as tax avoidance or socially accepted tax reduction strategy. Defining the same act may vary with time. For example, the taxation authority can claim a certain conduct as tax avoidance; on the other hand, the judicial branch of government can determine it as a tax reduction strategy. In such case, the taxation authority will be discontented and reform the Tax Act to define similar conduct as illegal in the long term. If the judicial branch of government refers to such act as not violating any article, yet socially unacceptable tax avoidance that distorts the intention of the law, then the taxation authority can justifiably impose the tax. When the decision of the judicial branch is divulged to the public, similar conducts will be identified as tax evasion, not tax avoidance.
Figure 1. Categorizing Tax Avoidance
2.2.2 Financial Determinants of Corporate Tax Avoidance and Research on SME Tax Avoidance
The extant literature on corporate tax avoidance from the early 1990s have examined tax burden according to the individual firm, industry and characteristics using effective tax rate. It has been found that effective tax rate differs according to the leverage, export ratio, capital intensity and technology investment besides the firm size (Kim & Ahn, 1994). By contrast, corporate tax avoidance is found to be positively related to effective tax rate, profitability, capital expense burden, and corporate structure. Additionally, it has been demonstrating negative relations with the tax incentive (Koh, 2006).
Kim and Ahn (1994) examined whether there exist a difference in corporate tax from the year 1989 to 1991 by running a regression of effective tax rate on various control variables including the firm size, leverage, export ratio, capital intensity, investment in technology. Their results showed an insignificant relation between corporate tax burden and firm size and significantly negative relation between the rest of the variables and corporate tax burden.
Numerous studies have been conducted using the estimates from Desai and Dharmapala (2006) from the year 2000. Koh (2006) suggested the corporate tax avoidance tends to display positive relation with tax burden (marginal tax rate), profitability, capital expense burden as well as ownership structure. At the same time displayed negative relation with tax incentives (TSE). The results suggest excessive tax burden can naturally entail motive for corporate tax avoidance.
Kim and Jung (2006) examined the influence financial factors have on corporate tax avoidance using the sample of enlisted firms with nonnegative estimated taxable income from the year 2000 to 2005. They implemented the measure from Desai and Dharmapala (2006) to proxy for corporate tax avoidance. They found corporate tax avoidance increased along with the total asset size and earnings before tax and decreased as liabilities increased. Their study held a limitation of estimating taxable income based on the tax paid.
Illegal Legal
Tax Evasion Tax Avoidance Tax Planning “vice”
(Tax Crime) “virtue”
Impose tax Additional tax
Criminalize
Impose tax No Additional tax
No penalty Impose tax
Kim and Kim (2013) estimated corporate tax avoidance in long-term with an assumption that the impact of tax planning lasts in long-term. They used long-term corporate tax avoidance estimate from Hanlon and Heitzman (2010) including GAAP ETR, CASH ETR, CURRENT ETR, TAX ETR, and ETR Differential. They concluded that most firms not only avoid tax in short-term but also in long-term. Additionally, they also found that there are representative financial determinants that affect tax avoidance. Such determinants are firm size (SIZE), leverage (LEV), capital intensity (CAPIN), inventory rate (INVIN), R&D intensity (RNDIN), return on asset (ROA), export rate (FRGN), auditor size (BIG4), and auditing compensation (LNFEE).
Previous research on SME tax avoidance are as follows. Yoon and Bae (2001) conducted survey to the main accountants in SME to examine the factors that influence the corporate tax avoidance. Their results showed that tax burden and factors related to taxation administration both contain positive relation with tax avoidance. On the contrary, tax ethics and the factors that hinder corporate tax avoidance all demonstrated negative relation with tax avoidance. Thus, it is intuitive as the researchers have conjectured in the first place; the accountants tend to conduct less corporate tax avoidance when considering the sanctions yet they become more active when the tax burden is high. Whereas Yoon and Bae (2001) conducted an empirical research with a dataset from one country, Lee and Yoon (2011) engaged in cross-sectional research. They contrasted the difference in factors that influence corporate tax avoidance in both Korea and Indonesia. They found high tax rate entailed tax avoidance and complexity of the tax act and stronger sanctions on tax avoidance all reduced corporate tax avoidance. Furthermore, their study confirmed the pervasiveness of corporate tax avoidance in the market as well as unfairness in tax all entailed high corporate tax avoidance. They also enumerated the financial factors that have an impact on corporate tax avoidance including firm size, capital intensity, with a positive influence and profitability and the existence of tax investigation experience, with negative influence.
Cho, Park, and Lee (2011) also conducted the financial traits that prompt corporate tax avoidance from the year 2005 to 2009 with a sample of firms listed on KOSDAQ. They presented the positive relation between tax avoidance and tax burden besides firm size. On the other hand, tax incentive and capital intensity all held negative relation with tax avoidance. Thus, firms with either larger tax burden or large size are likely to conduct tax avoidance whereas the firms receiving benefits from tax incentives are less likely to conduct tax avoidance.
3. RESEARCH DESIGN
3.1 Hypotheses
3.1.1 Tax Avoidance and Financial Traits
This literature intends to find financial determinants that influence tax avoidance. We set our first hypothesis (H-1) about the relation between tax avoidance financial determinants including firm size (SIZE), leverage (LEV), profitability (ROA), operating cash flow (CFO), capital intensity (PPE), R&D intensity (RNDS), sales growth (GS), export rate (ES)
Firstly, firm size (SIZE) can possibly influence tax avoidance in two contradictory ways. According to political cost theory, larger and successful firms are likely to be the scapegoat being imposed more restraints and required wealth transfer due to higher visibility. (Zimmerman, 1983) Thus, we conjecture that larger firm size will entail higher tax avoidance tendency. On the other hand, according to political power theory where large firms can pressure the political process in their favor through taxation strategies thus attain more resource to organize the firm’s operation for optimal tax savings, firm size is hypothesized to negatively affect tax avoidance tendency. Therefore, we establish a hypothesis (H 1-1) to confirm the relations between firm size and tax avoidance.
Thirdly, it is plausible that since Tax Act endows tax incentives to stimulate firm investment, firm asset composition influence tax avoidance. (Stickney & McGee, 1982; Gupta & Newberry, 1997). Firms with depreciable assets have increased depreciation expense and can implement non-liability tax reduction effect through depreciation expense and tax exemption from an investment. Thus, higher capital intensity (PPE) may lead to lower tax avoidance tendency due to depreciation expense and tax exemption. Yet high capital intensity can increase depreciation expense and the firm can make attempts to manipulate by decreasing the useful life of the asset, choosing the depreciation method, categorizing the expenditure. This leads to a high possibility of committing tax avoidance. To capture such possibility, we come up with a hypothesis (H1-3).
Fourthly, profitability (ROA) through the firm’s operation can influence tax avoidance. Since the tax is determined by the profit earned, the manager can commit tax avoidance when the firm’s profit increases. Hypothesis (H1-4) is established to test this.
Both firm’s operating cash flow and sales growth can affect tax avoidance tendency. The increase in the former can induce more tax burden to the firm thereby can positively influence tax avoidance tendency. Also, the sales growth which is calculated by subtracting current year sales from that of the previous year and dividing the previous year sales can influence tax avoidance. Hypotheses H1-5 and H1-6 capture the influence of operating cash flow and sales growth on tax avoidance, respectively.
Additionally, R&D intensity (RNDS) provides tax reduction related to investment in that it can instantaneously exempt expense whereas its benefit is typically realized over a long term. An additional amount in R&D also entails tax exemption from an investment. Thus, we conjecture firms with high R&D intensity are less likely to conduct tax avoidance if there are tax incentives related to R&D intensity. We include a hypothesis (H1-7) to investigate the possible negative relation between R&D intensity and tax avoidance.
Moreover, the government, in an attempt to promote exporting industry supports zero percent taxation when the transaction is considered to be export according to Value-Added Tax Act. So when tax incentive related to export exists, firms with high export rate have less incentive to conduct tax avoidance, indicating a negative relation between tax avoidance and export rate. This relation will be examined through hypothesis H1-8.
H1: Tax avoidance in SME is related to the firm’s financial characteristics
H1-1: Tax avoidance in SME is related to the firm size (SIZE) H1-2: Tax avoidance in SME is related to the firm leverage (LEV) H1-3: Tax avoidance in SME is related to the firm capital intensity (PPE) H1-4: Tax avoidance in SME is related to the firm total asset profitability (ROA) H1-5: Tax avoidance in SME is related to the firm operating cash flow (CFO) H1-6: Tax avoidance in SME is related to the firm sales growth (GS)
H1-7: Tax avoidance in SME is related to the firm R&D intensity (RNDS) H1-8: Tax avoidance in SME is related to the firm export rate (ES)
3.1.2 Relation Between Tax Avoidance and Auditor Characteristics
H2: Tax avoidance in SME is related to auditor characteristics
H2-1: Tax avoidance in SME is related to auditor size (BIG4) H2-2: Tax avoidance in SME is related to auditor findings (AD)
3.2 Variables Measurement and Modeling
3.2.1 Measuring Tax Avoidance
The present study estimates corporate tax avoidance using book-tax difference (henceforth BTD). BTD is incurred either through increasing earnings on the financial report (earnings manipulation) or through decreasing taxable income (tax avoidance). In some cases, firms use both means to maximize the firm value. Based on such reasons, we can implement BTD to proxy for corporate tax avoidance. Extant studies on tax avoidance using BTD also proved that the difference in BTD was related to the firms that committed tax avoidance.
Desai and Dharmapala (2006) introduced a new measurement to proxy for tax avoidance with an assumption that the difference between accounting profit and taxable income is attributable to earnings manipulation and tax avoidance. They calculated abnormal BTD (discretionary part) by regressing BTD on total accruals thereby ruling out normal BTD (non-discretionary part). This calculation controlled for the earnings manipulation part from total accruals. The recent research has adopted the estimation from Desai and Dharmapala (2006). Following the convention, the present study adopts the methodology in Desai and Dharmapala (2006) to estimate the corporate tax avoidance. Despite the difference in between the tax structure in the US and Korea, we adopt the measure from Desai & Dharmapala (2006) to accurately capture tax avoidance by eliminating the effect of earnings manipulation.
BTD is calculated by subtracting taxable income from accounting profit and dividing the result by total asset as shown in (Eq. 1). We present the measure proposed in Desai and Dharmapala (2006) as (Eq. 2). The residual variable of (Eq. 2) is the corporate tax avoidance (TS)
𝐵𝑇𝐷$,& = (())*+,&$,- /,)*0123454671 /,)*01)3*&47 (991& (Eq. 1)
𝐵𝑇𝐷$,& = 𝛽;𝑇𝐴$,& + 𝜀$,&
𝑇𝑆$,& = 𝜀$,& (Eq. 2)
BTDi,t = (earnings before tax-taxable income)/total asset of firm i in term t TAi,t = (net income-operating cash flow)/total asset of firm i in term t TSi,t = estimated corporate tax avoidance of firm i in term t
The dependent variable of (Eq. 2) is BTD and the independent variable is total accruals which is the difference between accounting profit and operating cash flow. The measure by Desai and Dharmapala (2006) has an advantage in that it can decrease measurement error by separating the earnings manipulation from BTD. In this vein, we regard total accruals as earnings manipulation proxy as it was identified in Desai and Dharmapala (2006).
3.2.2 Model
This literature investigates financial determinants that are associated with tax avoidance in SME. We use BTD and TS to proxy for tax avoidance and conduct a regression analysis as in (Eq. 3).
𝑇𝑆$,&(𝐵𝑇𝐷$,&)=𝛼@+𝛼;𝑆𝐼𝑍𝐸$&+𝛼D𝑅𝑂𝐴$&+𝛼G𝐿𝐸𝑉$&+𝛼J𝐶𝐹𝑂$&+𝛼M𝑃𝑃𝐸$&+𝛼O𝑅𝑁𝐷𝑆$&+𝛼Q𝐺𝑆$&+𝛼S𝐸𝑆$&
BTDi,t = (accounting profit-taxable income)/total asset
TSit = estimated corporate tax avoidance proposed in Desai and Dharmapala (2006) SIZEi,t = logarithm of total asset
ROAi,t = net income/total asset LEVi,t = total liabilities/total asset CFOi,t = operating cash flow/total asset
PPEi,t = (tangible asset-land-asset under construction)/total asset, RNDSi,t = R&D/total sales
GSi,t = (sales during current term-sales during previous term)/sales during previous term) ESi,t = sales from export/total sales
ADi,t = 1 if the auditor's report is unqualified, otherwise 0 BIG4i,t = 1 if the auditor firm is BIG4, otherwise 0
YD = year dummy variable IND = industry dummy variable
ε = Residual
The definitions of BTD and TS are introduced in the previous section. Here we enumerate the financial determinants that, we speculate to be, are related to BTD or TS. Firms with high profitability (ROA) are anticipated to be more active in tax avoidance. Firms with high leverage (LEV) might be relatively passive due to tax shield through interest expense. Firm size (SIZE) has an ambiguous effect on tax avoidance for it is plausible that the large firms are likely to plan competitive tax strategy, yet according to political cost theory, are likely to be less involved in tax avoidance. Since firms with high capital intensity (PPE) have various means to reduce tax, they are less likely to conduct tax avoidance.
Firms with greater operating cash flow may be more involved in tax avoidance (Koh, Kim & Choi, 2007; Koh & Park, 2011). R&D intensity, due to tax reduction and exemption clauses is conjecture to be negatively related to tax avoidance. If the firm has positive sales growth (SG) then it will be more active in tax avoidance to minimize cash outflow from the increased sales. Firms substantially relying on export (with high export rate (ES)) tend to hold less motive in tax avoidance. Firms with proper audit findings (AD) or those audited by the large auditors (BIG4) also have less motive for tax avoidance. We control for the annual and industrial difference through dummy variables.
3.3 Sample
The present study uses the sample data from 2011 to 2013 extracted from the firms listed on the Korea Stock Exchange including the firms subjected to external audit2. We exclude those firms that meet the following criteria and finalize 18,754 firms as total sample data:
- in the financial industry or of which accounts close in other months than December - with impaired capital or into administration
- where the data cannot be found
We illustrate the sample selection process. Firstly, we extract from Kis-value from 2011 to 2013 the listed firms and the subjects of external audit. Then we omit the firms in the financial industry from the sample since the financial statements of financial institutions are different from that of the manufacturing firms in the format and explanation. The majority of the listed firms close accounts during December. To keep the consistency in measurement and for the sake of convenience in interpreting the result, we remove the firms in the financial industry and firms with accounts closing period other than December, respectively. Thirdly, we intend to exclude the abnormal firms since their financial information can be considerably dissimilar to that of a normal firm. Lastly, we extract the financial data from Kis-value and remove some unavailable data. We identify the observations that exceed 1% distribution as the outlier, therefore, conduct 98% winsorization. Our final total sample comprises 18,754 firms.
4. EMPIRICAL RESULT
4.1 Descriptive Statistics and Correlation Analysis
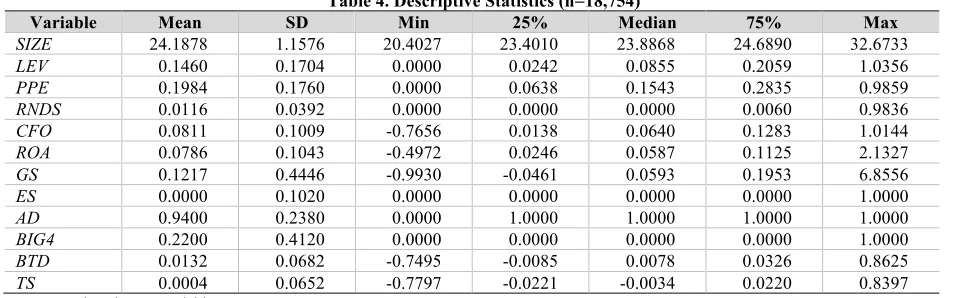
Table 4 summarizes the descriptive statistics of the total sample. In the total sample, the mean and median of BTD are 0.0132 and 0.0079, respectively and those of TS are 0.0004 and –0.0034. As seen in the statistics over SME, the distribution of TS is again skewed to the right. The standard deviation of BTD and TS are 0.0677 and 0.0647 among SME and 0.0682 and 0.0652 for the total sample. There is only a marginal difference in tax avoidance among firms.
Table 4. Descriptive Statistics (n=18,754)
Variable Mean SD Min 25% Median 75% Max
SIZE 24.1878 1.1576 20.4027 23.4010 23.8868 24.6890 32.6733
LEV 0.1460 0.1704 0.0000 0.0242 0.0855 0.2059 1.0356
PPE 0.1984 0.1760 0.0000 0.0638 0.1543 0.2835 0.9859
RNDS 0.0116 0.0392 0.0000 0.0000 0.0000 0.0060 0.9836
CFO 0.0811 0.1009 -0.7656 0.0138 0.0640 0.1283 1.0144
ROA 0.0786 0.1043 -0.4972 0.0246 0.0587 0.1125 2.1327
GS 0.1217 0.4446 -0.9930 -0.0461 0.0593 0.1953 6.8556
ES 0.0000 0.1020 0.0000 0.0000 0.0000 0.0000 1.0000
AD 0.9400 0.2380 0.0000 1.0000 1.0000 1.0000 1.0000
BIG4 0.2200 0.4120 0.0000 0.0000 0.0000 0.0000 1.0000
BTD 0.0132 0.0682 -0.7495 -0.0085 0.0078 0.0326 0.8625
TS 0.0004 0.0652 -0.7797 -0.0221 -0.0034 0.0220 0.8397
Note: Explanation on Variables
BTD = (accounting profit-taxable income)/total asset, TS = estimated corporate tax avoidance proposed in Desai and Dharmapala (2006), SIZE
= logarithm of total asset, ROA = net income/total asset, LEV = total liabilities/total asset, CFO = operating cash flow/total asset, PPE =
(tangible asset-land-asset under construction)/total asset, RNDS = R&D/total sales, GS = (sales during current term-sales during previous term)/sales during previous term, ES = sales from export/total sales, AD = 1 if the auditor's report is unqualified, otherwise 0, BIG4 = 1 if the auditor firm is BIG4, otherwise 0.
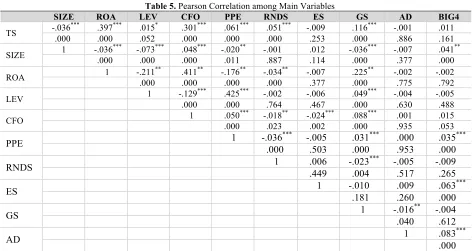
Table 5. Pearson Correlation among Main Variables
SIZE ROA LEV CFO PPE RNDS ES GS AD BIG4
TS -.036
*** .397*** .015* .301*** .061*** .051*** -.009 .116*** -.001 .011
.000 .000 .052 .000 .000 .000 .253 .000 .886 .161
SIZE 1 -.036
*** -.073*** .048*** -.020** -.001 .012 -.036*** -.007 .041**
.000 .000 .000 .011 .887 .114 .000 .377 .000
ROA 1 -.211.000 ** .000 .411** -.176.000 ** -.034.000 ** -.007 .377 .000 .225** -.002 .775 -.002 .792
LEV 1 -.129
*** .425*** -.002 -.006 .049*** -.004 -.005
.000 .000 .764 .467 .000 .630 .488
CFO 1 .050.000 *** -.018.023 ** -.024.002 *** .088.000 *** .935 .001 .015 .053
PPE 1 -.036*** -.005 .031*** .000 .035***
.000 .503 .000 .953 .000
RNDS 1 .006 -.023*** -.005 -.009
.449 .004 .517 .265
ES 1 -.010 .009 .063***
.181 .260 .000
GS 1 -.016** -.004
.040 .612
AD 1 .083***
.000
4.2 Regression Analysis
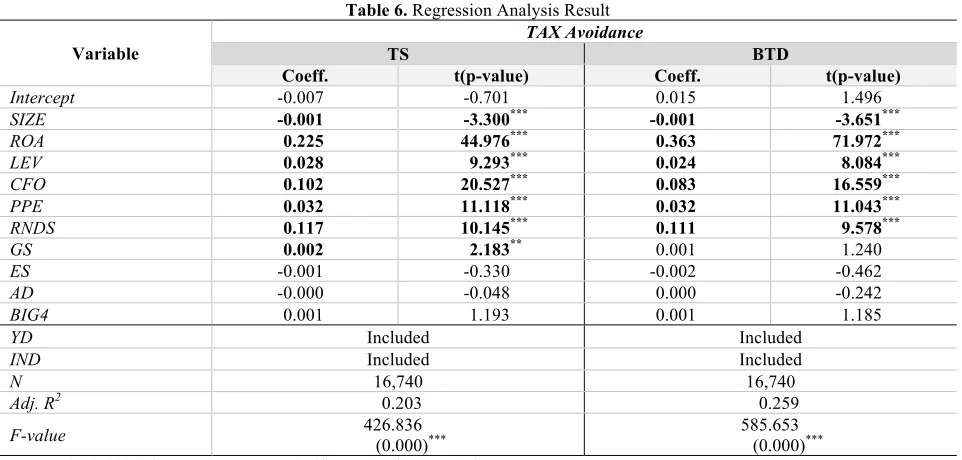
We run our main regression model to find the significant financial traits and tabulate the results in Table 6. The results related to TS, one of the proxies for corporate tax avoidance, are as follows. Firm size (SIZE) holds significant and negative effect on corporate tax avoidance with a coefficient value of –3.300. This implies that SME with smaller size is more likely to conduct corporate tax avoidance and also substantiates political power theory. As mentioned in the sections before, political power theory contends that large firms can establish favorable tax planning and contain more resource to structure firm activity for optimal tax reduction. Thus, it underpins that large firms hold less motive for corporate tax avoidance.
We also find that profitability (ROA), leverage (LEV), operating cash flow (CFO), capital intensity (PPE), R&D intensity (RNDS), and sales growth (GS) all have a positive impact on corporate tax avoidance, corroborating the previous studies. Higher profitability (ROA) naturally increases the management’s attempt to avoid tax by earnings smoothing. Operating cash flow (CFO) induces tax burden thus also holds positive relation with corporate tax avoidance. Firms with high leverage (LEV) are the beneficiary of interest tax shield thereby have less motive to avoid tax. However, ironically, firms subsidized with the tax deduction or exemption are more likely to avoid tax as they cannot reduce the tax from tax shield.
Table 6. Regression Analysis Result
Variable
TAX Avoidance
TS BTD
Coeff. t(p-value) Coeff. t(p-value)
Intercept -0.007 -0.701 0.015 1.496
SIZE -0.001 -3.300*** -0.001 -3.651***
ROA 0.225 44.976*** 0.363 71.972***
LEV 0.028 9.293*** 0.024 8.084***
CFO 0.102 20.527*** 0.083 16.559***
PPE 0.032 11.118*** 0.032 11.043***
RNDS 0.117 10.145*** 0.111 9.578***
GS 0.002 2.183** 0.001 1.240
ES -0.001 -0.330 -0.002 -0.462
AD -0.000 -0.048 0.000 -0.242
BIG4 0.001 1.193 0.001 1.185
YD Included Included
IND Included Included
N 16,740 16,740
Adj. R2 0.203 0.259
F-value 426.836 (0.000)*** 585.653 (0.000)***
Note: 1. *, **, *** indicates 1%, 5%, 10% significance level, respectively. 2. Explanation on Variables
BTD = (accounting profit-taxable income)/total asset, TS = estimated corporate tax avoidance proposed in Desai and Dharmapala (2006), SIZE
= logarithm of total asset, ROA = net income/total asset, LEV = total liabilities/total asset, CFO = operating cash flow/total asset, PPE =
(tangible asset-land-asset under construction)/total asset, RNDS = R&D/total sales, GS = (sales during current term-sales during previous term)/sales during previous term, ES = sales from export/total sales, AD = 1 if the auditor's report is unqualified, otherwise 0, BIG4 = 1 if the auditor firm is BIG4, otherwise 0., YD = year dummy variable, IND = industry dummy variable.
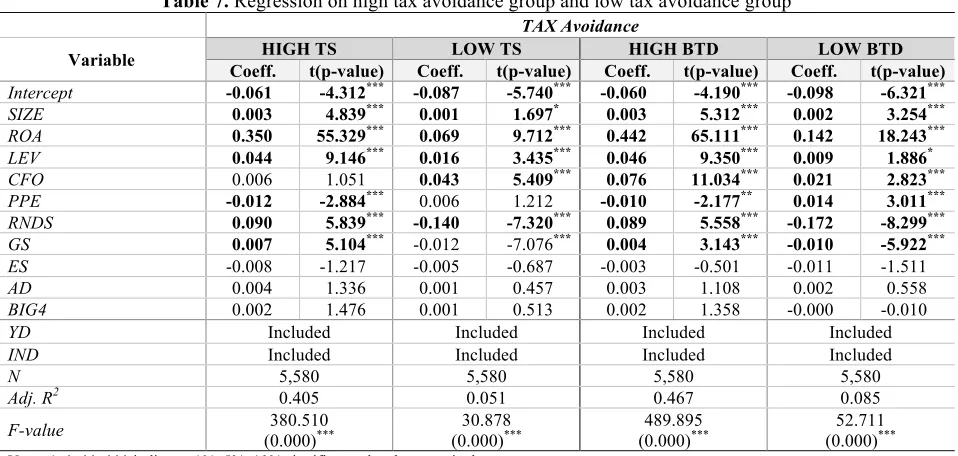
We run an additional regression to examine the difference in financial attributes between high corporate tax avoidance group and low corporate tax avoidance group and tabulate the results in Table 7. There is a discrepancy between two groups in terms of financial characteristics. In the high corporate tax avoidance group, firms size (SIZE) has significant and positive effect on tax avoidance. This result is contradictory to what we observe in Table 6 and supports political cost theory. The theory claims that large and successful firms receive more attention thereby become a scapegoat of regulations and imposed more tax (Zimmerman, 1983). Based on such stance, large firms commit more tax avoidance. As Table 6 delineates, higher profitability (ROA) and R&D intensity induce the corporate tax avoidance. Both leverage (LEV) and sales growth (GS) lead to tax avoidance. As mentioned in the previous part, SME that receive tax reduction or exemption can benefit less from tax shield from interest thereby tend to avoid tax. On the other hand, firms with high capital intensity (PPE) show less tax avoidance.
Table 7. Regression on high tax avoidance group and low tax avoidance group TAX Avoidance
Variable Coeff.HIGH TS t(p-value) Coeff.LOW TS t(p-value) Coeff.HIGH BTD t(p-value) Coeff.LOW BTD t(p-value)
Intercept -0.061 -4.312*** -0.087 -5.740*** -0.060 -4.190*** -0.098 -6.321***
SIZE 0.003 4.839*** 0.001 1.697* 0.003 5.312*** 0.002 3.254*** ROA 0.350 55.329*** 0.069 9.712*** 0.442 65.111*** 0.142 18.243*** LEV 0.044 9.146*** 0.016 3.435*** 0.046 9.350*** 0.009 1.886*
CFO 0.006 1.051 0.043 5.409*** 0.076 11.034*** 0.021 2.823***
PPE -0.012 -2.884*** 0.006 1.212 -0.010 -2.177** 0.014 3.011*** RNDS 0.090 5.839*** -0.140 -7.320*** 0.089 5.558*** -0.172 -8.299*** GS 0.007 5.104*** -0.012 -7.076*** 0.004 3.143*** -0.010 -5.922***
ES -0.008 -1.217 -0.005 -0.687 -0.003 -0.501 -0.011 -1.511
AD 0.004 1.336 0.001 0.457 0.003 1.108 0.002 0.558
BIG4 0.002 1.476 0.001 0.513 0.002 1.358 -0.000 -0.010
YD Included Included Included Included
IND Included Included Included Included
N 5,580 5,580 5,580 5,580
Adj. R2 0.405 0.051 0.467 0.085
F-value (0.000)380.510 *** (0.000)30.878 *** (0.000)489.895 *** (0.000)52.711 ***
Note: 1. *, **, *** indicates 1%, 5%, 10% significance level, respectively. 2. Explanation on Variables
HIGH / LOW (BTD) = (accounting profit-taxable income)/high or low total asset, HIGH / LOW (TS) = estimated corporate tax avoidance proposed in Desai and Dharmapala (2006), SIZE = logarithm of total asset, ROA = net income/total asset, LEV = total liabilities/total asset, CFO = operating cash flow/total asset, PPE = (tangible asset-land-asset under construction)/total asset, RNDS = R&D/total sales, GS = (sales during current term-sales during previous term)/sales during previous term, ES = sales from export/total sales, AD = 1 if the auditor's report is unqualified, otherwise 0, BIG4 = 1 if the auditor firm is BIG4, otherwise 0., YD = year dummy variable, IND = industry dummy variable.
5. CONCLUSION
Accounting Standards for Small- and Medium-sized Entities (AS-SME) is enacted to meet the needs of the SME that often lack the accounting capacity. AS-SME provides easiness in writing the financial statement along with convenience for information users. Aside from such legislation, the government authority has provided numerous tax incentives including tax reduction and exemption to SME. Our initial guess is that SME are less likely to avoid tax as they are the beneficiary of the Tax Act.
Still, following the extant studies, there exists the possibility that SME conduct tax avoidance to maximize the firm value. Thus, we intend to examine the financial traits of SME that leads them to corporate tax avoidance, which can be lethal if discovered by the taxation authority. In addition, we empirically investigate the different factors that influence tax avoidance by dividing the total sample into two groups: low tax avoidance group and high tax avoidance group.
This study, following the convention of corporate tax avoidance literature, adopts the measures developed by Desai and Dharmapala (2006), precisely the book-tax difference (BTD) and estimated tax avoidance (TS). We find that profitability (ROA), leverage (LEV), operating cash flow (CFO), capital intensity (PPE), R&D intensity (RNDS), and sales growth (GS) all have a positive impact on corporate tax avoidance, confirming the previous studies. The main difference between the high and low tax avoidance groups lies in R&D intensity and sales growth.
AUTHOR BIOGRAPHIES
Jeongho Kim (1st Author) is a Assistant Professor of Department of Taxation And Accounting, Silla University, Busan, Korea. Research interests include International Financial Reporting Standard, tax accounting, CSR accounting, and other financial & managerial accounting issues. E-mail: [email protected]
Chaechang Im (Corresponding Author) is a Research Assistant of Institute of Global Business Research of Hankuk University of Foreign Studies in Korea. Research interests include International Financial Reporting Standard, fair value accounting, derivatives accounting, and other financial & managerial accounting issues. E-mail: [email protected]
REFERENCES
Anderson, J.C. & Frankle, A. W. (1980). Voluntary social reporting: An iso-beta portfolio aznalysis. The Accounting Review,55, 467-480.
Andrews, A., Linn, S. & Yi, H. (2009). Corporate governance and executive perquisites: Evidence from the new SEC disclosure rules. AAA 2009 Financial Accounting and Reporting Section (FARS) Paper.
Cho, M., Park, S. & Lee, H. (2011). A Study on the Effect of Financial Characteristics on Tax Avoidance in KOSDAQ Firms. Korea Journal of Business Administration, 24(4).
Desai, M. & Dharmapala, D. (2006). Corporate tax avoidance and high-powered incentives. Journal of Financial Economics, 79(1), 145-179.
Dhaliwal, D.S., Li, Z., Tsang, A. & Yang, G.Y. (2010). Voluntary non-financial disclosure and the cost of equity capital: The initiation of corporate social responsibility reporting. The Accounting Review86(1), 59-100.
Francis, J. (1984). The Effect of Audit Size on Audit Prices. Journal of Accounting and Economics,6, 133-151.
Gupta, S. & K. Newberry. (1997). Determinants of the variability in corporate effective tax rates: Evidence from longitudinal data. Journal of Accounting and Public Policy, 16, 1-34.
Hwang, I., Choi. C.J., & Kim. S. (2009). Establishment of Accounting Standards for Unlisted Companies in IFRS. Korean Accounting Journal, 18(1), 1-34.
Han, J. & Lee, J. (2004). A Survey and Proposal for Accounting Procedures of Small and Medium-sized Companies -Regarding Applied Status of Special Provisions for Small and Medium-sized Companies. Korean Accounting Journal, 13(2), 259-288.
Hanlon, M. & Heitzman, S. (2010). A Review of Tax Research. Journal of Accounting and Economics, 50, 127-178. Incorporation Statistics. (2011). Chronological List of National Tax Statistics.
Kim, J. & Jung, J. (2006). The Impact of the Corporate Financial Characteristics on Tax Avoidance. Korean Journal of Taxation Research, 23(4).
Kim, J. & Kim, J. (2013). The study on evaluation and determinant factor of effective tax rates as an expectation factor for long-run corporate tax avoidance. Korea Accounting Journal, 22(1), 1-40.
Kim, S. & An, S. (1994). The Study on Determinants of Effective Corporate Rate. Korean Journal of Management,8(4), 100-118.
Koh, Y. (2006). A Study on the Tax Avoidance, Corporate Value and Corporate Values. Yonsei University, Doctoral paper. Koh, Y., Kim J. & Choi. W. (2007). A Study on Corporate Tax Avoidance. Koran Journal of Taxation Research, 24(4), 9-40. Koh, Y. & Park S. (2011). A Study on the Difference of Tax Avoidance Before and After Tax Investigation. Koran Journal of
Taxation Research, 28(2), 41-65.
Lee, D. & Yoon, T. (2011). A Comparative Study on the Factors and Tendency of Tax Avoidance of the Small and Medium Size Firms in Korea and Indonesia. International Journal of Accounting, 40.
Palmrose, Z. (1989). The Relation of Audit Contract Tape to Audit Fees and Hour. The Accounting Review, 64(3), 488-499. Richardson, A. J. & Welker, M. (2010). Social disclosure, financial disclosure and the cost of equity capital. Accounting,
Organizations & Society,26, 597-616.
Stickney, C.P. & McGee, V. E. (1982). Effective corporate tax rates: The Effect of Size. Capital Intensity. Leverage and Other Factors. Journal of Accounting and Public Policy, 1, 125-152.
The First Draft of Accounting Standard for Small Medium Entity. (2012). Korea Accounting Institute, 1-25.
Whang, I., Choi. J., & Kang. S. (2009). Establishment of Accounting Standards for Unlisted Companies in IFRS. Korean Accounting Journal, 18 (1), 1-34.
Yoon, M. & Bae. I. (2001). The Empirical Study on the Estimation of Tax Avoidance in Small and Medium sized Firms. Journal Of Taxation And Accounting, 19, 90-108.
Yoon, S., Park, J., Chung, Y. & Choi, K., (2010). Accounting Standards for the Unlisted Companies after IFRS Adoption in Korea -A Survey Study. Korea Taxation Journal, 11(2), 9-44.
ENDNOTES
1Implementation of accounting standards in the Korea Market
Classification Until 2008 2009-2010 2011-2012 2013 After 2014
Firms pre-adopting IFRS Korean International Financial Reporting Statements(K-IFRS) Listed firms
Unlisted firms
Korean Generally Accepted Accounting Principal(K-GAAP)
Firms pre-adopting SME Accounting Standards for Small- and Medium-sized Entities (AS for SME)
2 Stock companies subject to external audit (Act on external audit of stock company)
Approximate Standard
(Before end of previous accounting period) Stock-Listed
• Total Asset over 10 billion Stock-listed corporation
• Total asset over 7 billion • • Total liability over 7 billion Total employee over 300 Stock company converting to stock-listed corporation in corresponding or next accounting period.