2122
Test Item Analyzer Using Point-Biserial
Correlation And P-Values
Anamarie A. Dichoso, Rosmina Joy M. CabauatanAbstract: Student performance in most colleges and universities in the Philippines is measured in terms of major examination. A valid and reliable test item is a must to ensure that the students are given a fair assessment. Testing the validity and reliability of an examination requires a thorough process. In this paper, there are six processes involved in Item Analysis Table of Specification (TOS) Creation, Test Item Preparation using LANSchool Classroom Management Software (LCMS). Test Administration and Scores Generation, Test Item Analysis using test item analyzer (TIA) prototype, Test Item Modification, and New Examination Administration. TIA automatically generates the number of items to be included in the exam ination based on course learning objectives and total time in minutes a lesson was taught in class. Teachers prepare test items of varying difficulties that cover both lower-order thinking skills (LOTS) and higher-order thinking skills (HOTS). The simulation result shows 64 items or 32% were incorrectly answered while 136 or 68% were correctly answered. There is an anomaly on Item 7 and 8 in terms of point-biserial Correlation (Rpbi) and p-values (P) hence should be removed or revised. Those correctly answered items are moderately difficult and should be retained. TIA prototype embedded with LCMS addresses the gap in related works in terms of test construction, paperless examination, test-item analysis and test bank of valid and reliable test items. TIA could aid in the attainment of course learning objectives which could serve as an ancillary for the evaluation of both student and teacher performances.
Index Terms: classroom management software, examination validity, point-biserial correlation, p-values, table of specification, test item reliability. —————————— ——————————
1
INTRODUCTION
An examination is one of the best ways to assess the attainment of a course’ intended learning outcomes (CILO) in Higher Education Institutions (HEIs)[15]. A well-constructed test item gives a fair representation of what the students know and can do, on the other hand, teachers can be assured that they are giving an accurate judgment about the skills and knowledge acquired by each student. Aside from test construction teachers administer the examination, tabulate students’ scores and finally do test item analysis. Unfortunately, not all teachers have knowledge in test item construction, analysis and banking. However, a mismatch between teaching and examination could result in failure and difficulty in attaining desired CILO [1]. The quality of teaching in most schools reflects the value teachers put on their test items [19]. There is a need therefore for a prototype blended with LCMS that will aid teachers in test construction, automate test administration and scoring then eventually identify valid and reliable test items to be stored in the test bank for future test administration. A good test item should discriminate a high performing student from low performing students, hence teachers should prepare an examination that covers both higher and lower-order thinking skills. It is a must that teachers should acquire a basic knowledge of the revised Bloom’s Taxonomy by Anderson and Krathwohl. The six levels are remembering, understanding, applying, analyzing, evaluating and creating. It is of equal importance to identify what type of examination to construct. There are different forms of examinations such as multiple-choice, require short answers, true or false, and essay. Of all these forms, the easiest yet most
recommended by most researchers is multiple choice because it covers a wide range of higher-order thinking skills [13][14]. Apart from its significance in easily gauging scores is its reliability as it supports impartiality. The number of items in a questionnaire can likewise be a factor that might lead to undesirable outcomes like low scores of examinees. The most-oft practice is preparing test items without basing it from the total time a topic is discussed in class. The number of items is solely based on what the teacher deems important which could result in an imbalanced distribution of topics. Aligning the number of items with the time a topic is tackled in class is what this study yearns for. The best way to achieve this is to prepare a TOS. As a blueprint of an examination [4], TOS can be used to automatically generate the number of items that should be taken from each learning objective which in turn, constitute the whole examination. This is to ensure that the items included in the examination would fairly represent the learning objectives set for each topic in a course. Based on the TOS, a teacher can construct the essential number of items for an examination. Student answers are either checked manually or electronically. Results are recorded in Excel or a grade book to easily transmute percentages for calculation of student grade. Valuation of scores to classify easy, average and hard items in an examination could be used to determine the performance of students concerning their acquired skills and to gauge the attainment of learning objectives. This is done by tabulating and analyzing each item in an exam in order to assess its quality. This is employed in order to revise or discard unreliable test items. Following this process is the purpose of this study to evaluate the quality of examination in order to establish content validity and reliability. Reliability is the consistency of a given examination. [14] This is assessed by letting a student retake an exam to identify whether the same result is obtained. In order to identify the most effective way to evaluate the consistency of an item, several methods of determining reliability are utilized such as test-retest reliability, split-half reliability, Cronbach’s alpha, Richardson Formula 20 (KR-20), and the Kuder-Richardson Formula (KR-21). The test-retest reliability coefficient is obtained by administering the same test twice and correlating the scores. However, this requires a test to be repeated twice for the same group of examinees. If the time interval is short, examinees could memorize some of the
________________________________
• Anamarie Aguinaldo Dichoso is currently pursuing masters degree program in Information Technology in Technological Institute of the Philippines, 938 Aurora Boulevard, Cubao, Quezon City, Philippines and currently working as an Instructor in San Sebastian College-Recoletos, Manila, Philippines. +63932-1116517. E-mail: [email protected] • Rosmina Joy M. Cabauatan is currently working as a Professor
in Technological Institute of the Philippines, 938 Aurora
2123
questions and their answers. [16] The split-half reliability is a coefficient obtained by dividing a test into halves, correlating the scores on each half, and correcting the length. This approach requires only a single administration but it is not appropriate on tests wherein scores are influenced by the number of answered items within an allotted time. [17] Other approaches value internal consistency but focus on the degree to which individual items are correlated with each other. These include Cronbach’s alpha, Richardson Formula 20 (KR-20) and the Kuder-Richardson Formula (KR-21). These approaches outweigh the test-retest and split-half reliability as they require one test administration and do not depend on a particular split of items. However, these are most applicable when a test measures a single skill area [2]. This study employed Point-biserial Correlation (Rpbi), an approach that measures the association between continuous and binary variables. [18] For instance, in item analysis, the binary variable is the correct answer of a student in an examination which can be marked as 1 and incorrect answers as 0. The continuous variable is the summation of individual scores of students in a test item. The p-values or level of difficulty is likewise equally important to test the reliability of a test item. This is done by assessing the varying level of difficulty of test items to effectively measure the different percentages in students’ learning. P-values are the proportion of students failing to get the correct answer. [9] These two approaches when complemented by TOS, would address the gap of related works which could pave the way in the realization of a more holistic approach from test construction, administration, scoring, test item analysis and finally test item bank for valid and reliable test items. It will also realize the objectives of this study to accurately measure the degree of discrimination of test items. Results may serve as bases for teachers to delete, revise, or retain test items and for the development of a prototype that can facilitate the process of identifying varying difficulty levels of test items. This can contribute to assessing the attainment of CILO. In this paper, there are six processes involved in Item Analysis TOS Creation, Test Item Preparation using LCMS, Test Administration and Scores Generation, Test Item Analysis using test item analyzer (TIA) prototype, Test Item Modification, and New Examination Administration. The 3-tier architecture of the TIA prototype is shown in succeeding sections and finally an instance of the results and findings are discussed.
2
RELATED
WORKS
Different studies have been conducted to evaluate the effectiveness of TOS, Rpbi, and p-values in examinations. To improve the validity of the evaluation and judgments of teachers, DiDonato-Barnes and Wolming et al. [4][5] used TOS to frame the decision- making process of exam construction. The study of Alade et al. [6] also found out that TOS has a significant relevance in educational development assessment. The University of Kansas [7] and Far Eastern University, Institute of Education Philippines [8] both used TOS to improve the validity of teacher-made tests by identifying achievement domains and ensuring fair representative samples of questions to improve all levels of student abilities. Aside from TOS, creating test items with varying difficulties from LOTS to HOTS using the revised Bloom’s taxonomy by Anderson and Krathwohl contributes to the validity of examination. HOTS are reflected by the top three levels of the pyramid namely: analyzing, evaluating and creating. LOTS covers the three lower levels remembering, understanding and
applying. Apart from TOS, other studies such as [9] have utilized Rpbi and p-values in determining if a test item is likely to be valid and reliable. Rpbi as described by Brown [10], is a statistical method that is used to estimate the degree of relationship between a naturally occurring dichotomous nominal data and ratio scale. As applied by Educational Assessments Corporation (EAC) [11], students with high scores in an examination could get an average score on a question that is under review and students with low scores would most likely struggle on a question or item under review. Using Rpbi and p-values, Tucker [12] found out that very easy or very difficult test items in an examination have little discrimination and test items of moderate difficulty are more discriminating. Hence, a question or item that deviates from this assumption can be resolved by Rpbi. While previous studies have focused on test construction and on determining the validity or reliability of test items, this study has integrated the capability of Rpbi and p-values in a prototype to recommend reliable test item and ensure content validity of an examination using TOS, hence a more holistic approach for test construction. An approach that addresses the gap of related works in the creation of a well-constructed examination which is a powerful motivation for students to prepare when they perceived that their effort leads to valued learning outcomes.
3 THEORETICAL
FRAMEWORK
3.1 System Architecture
The Test Item Analyzer (TIA) prototype was designed to aid teachers in test construction and item analysis. It was developed using Java programming language with statistical analysis, Commons Math libraries, and MySQL Relational Database Management System (RDBMS) for storing data and reports. The prototype works side by side with LCMS where the examination is constructed and students test scores are extracted. Figure 1 shows the 3-tier architecture of the system. The client tier also known as representation tier is the user interface (UI) of the TIA prototype and the LCMS. The TIA displays TOS, Rpbi and P result while LCMS UI is used for test construction, test administration and test scores generation. The business logic layer handles the processes involve in creating TOS, generating number of items per LOs, managing access of students such as registration and administration of the examination
Fig. 1. System 3-tier Architecture. It shows the user interface, business layer or functional process logic, and the computer
2124
This is where students’ scores are converted into binary form by marking students answer as 1 if correct and 0 if incorrect and will be analyzed if a test item is reliable or not using Rpbi and P. This serves as a basis for retention, deletion or revision of test items. The data layer stores test-items, test scores, Rpbi and P result, valid and reliable test items.
3.2 Methods
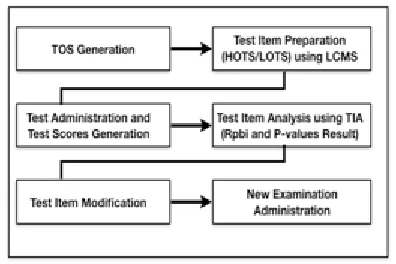
In this paper there are six processes involved in item analysis as shown in Fig. 2. Teachers are expected to have the basic skills in test construction using the revised Blooms Taxonomy by Anderson and Krathwohl for this will have an impact in the validity of the examination.
Fig. 2. Processes of TIA. It shows the steps used from planning test coverage using TOS, test construction, test administration, scores generation, test item analysis, test
item modification, test item banking and new test administration
3.2.1 TOS Generation
TOS, sometimes called a test blueprint, is a table that helps teachers align objectives, instructions, and examinations. A modified TOS was created to provide the teacher with an overview of the scope of an examination based on course learning objectives, units, lessons, and intended learning outcomes. The steps are as follows:
Let
lo - learning objectives
wlo – the weight of class time per Lo mlo - minutes of class time per Lo tso - total number spent in all objectives nlo- number of items per Lo
pti - percent of test item tni - total number of items mcq- multiple-choice questions
Step 1. Compute the relative weight of class time per lo. wlo = mlo / tso
Step 2. Compute for the number of item/s per lo, to be distributed to hot or lot.
nlo = pti * tni
Step 3. Distribute items among levels of objectives based on HOTS or LOTS. This is an independent variable and it will depend on the discretion of the teacher.
3.2.2 Test Item Preparation (HOTS/LOTS) using LCMS
Teachers are encouraged to create test items that will cover both HOTS and LOTS using the revised Blooms Taxonomy as their guide. The type of the test that will be used is only MCQs for ease of scoring and its reliability.
3.2.3 Test Administration and Test Score Generation
Students are required to register before taking an examination. To ensure the credibility of the examination student needs to take the exam on-site in one classroom. In the examination, numbers are randomized and with a time limit to discourage cheating. Upon submission, exam results are displayed for viewing then the TIA prototype will import from LCMS the result of the exam in comma value separated file format for test item analysis.
3.2.4 Test Item Analysis using TIA (Rpbi and P Result)
TABLE1
BASES FOR RPBI INTERPRETATION(EBEL (1986)&HETZEL (1997))
Table1 shows the bases for item analysis using Rpbi. The Rpbi values determine how test items are discriminated in order to identify test items that are subject to deletion, revision, or retention. A higher value of Rpbi indicates a more discriminating item. A highly discriminating item means that the students who have high test scores got the correct item while a low discriminating item means that students who have low scores were not able to get the correct answer. Test items with marginal values of Rpbi are subject to improvement while test items with poor and low values are subject to rejection, revision, or retention. The recommended Rpbi of test item to be reliable is above 29%.
TABLE2
BASES FOR P-VALUE INTERPRETATION (HOTIU (2006))
2125
are items that should not be reused for subsequent tests. If most students got an item correctly, then an item does not worth testing. Items with P-values that are equal or below 0.20 could be marked for review or reteach. If most students do not get the correct answer to an item, the item either needs revision or is marked for deletion.
3.2.5 Test Item Modification
The discriminated test items are generated based on the result of item analysis. These are extracted from the system in the form of an Excel file in order to easily distinguish the discrimination of test items. These may serve as bases for a teacher to decide whether test items are to be modified, retained, or removed from the examination.
3.2.6 New Examination Administration
The modified test item is then stored in a test bank for future use. The test bank will serve as a repository of valid and reliable test items. The teacher can also get some items to be included in the next student’s examination. Both teachers and students are assured that the test items in the test bank cover the knowledge and skills that need to be tested.
4 RESULTS
AND
DISCUSSION
4.1 Table of Specification
Table 3 presents an instance of a TOS of a weekly lesson. The LOs were formulated to include both LOTs and HOTs. The number of minutes a certain objective was discussed in class was recorded. This served as input for the system to compute the number of items per learning objective based on the minutes it was discussed in class. TIA generates the approximate number of items, while the teacher will distribute the number depending on the skills of the student that will be tested. It is very important that test items should be constructed and not just being lifted from the book or taken from the internet. It might be time-consuming for the teacher at first but in the long run, both teachers and students will benefit from it. It is also essential to develop test items that develop critical thinking skills of the students. This process was done to ensure examination content validity.
TABLE3 TABLE OF SPECIFICATION
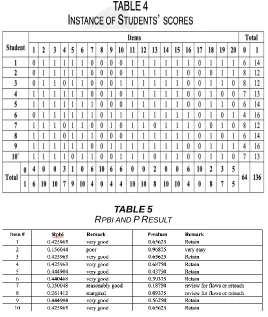
4.2 Result of Examination
TABLE5 RPBI AND PRESULT
Table 4 shows the instance of students’ scores who took the exam with test items that were modified using the TOS and the prototype calculations. The test items were coded 1 for correct answers and 0 for incorrect answers. The result shows that 64 items or 32% were incorrectly answered while 136 or 68% were correctly answered. Although most items were correctly answered, to some extent, there were still a lot of items that were also incorrectly answered. These were further analyzed based on the result of Rpbi and P-values analysis as shown in Table 5. The results show that most items such as 1, 3, 4, 5, 6, 9, and 10 must be retained as they were found to be moderately difficult. Although items 7 and 8 were found different in terms of Rpbi values, their p-values indicate that they must be reviewed for flaws or be taught again. The results substantiate that test items that were correctly answered are moderately difficult, hence must be retained while incorrectly answered items are either reasonably good or at a marginal level, henceforth be revised. This will be stored in the test bank for new test administration.
5 CONCLUSION
2126
bank are valid and reliable. The reports generated can effectively aid in the modification of test items necessary for the generation of effective measurement of the attainment of course learning objectives and evaluation of both student and teacher performances. In the new exam administration, both teacher and students are assured that what being tested is a fair representation of what they have taught and learned in the classroom.
6
FUTURE
WORKS
The TIA prototype was designed by a teacher for all teachers whose passion and competence in teaching are beyond compare. Educating the youth of the future is a gigantic task and teachers need all the help they can get in the language that students nowadays understand. Future researchers should enhance the prototype to include automatic identification of HOTS and LOTS MCQs. A pop-up tip or dialogue box on the revised Bloom’s Taxonomy that will guide teachers during test construction is encouraged. Further and deeper studies be conducted to apply other statistical or data analysis to ensure that all test items are reliable and valid. In the first place, a valid and reliable test item in the test bank is worth countless hours of research and improvement for all teachers and students around the globe.
7
ACKNOWLEDGMENT
Behind a woman’s success is her family. My partner in everything, my late husband Jose Manuel B. Dichoso, whose strong spirit never cease to rub mine. He always reminds me to never give up even when his physical body is weak because of cancer. My children, Mariah and Marcus who love me just the same even if they need to eat take-outs sometimes. To my niece Aileen who helped me in my household chores. My parents, Santos and Gloria Aguinaldo for always checking on me. To my adviser, Dr. Rosmina M. Cabauatan, whose patience and constructive criticism push me to strive harder. To the Dean of Technological Institute of the Philippines Quezon City, Dr. Ruji Medina for all his inputs. My SSC-R Dean, Dr. Lolita De Guzman, Area Chair Ms. Princess Zamora, my partners in CS/IT Area, Ms. Nora Bautista and to everyone who has helped me one way or the other to come up with this valuable study. Above all, our Almighty God for the gift of life and wisdom.
8
REFERENCES
[1]. Cohen, L, Manion, L. & Morrison, K., ―Research methods in Education‖ New York: Library of Congress Cataloguing-in-publication Data, 2011
[2]. Rudner, L. & Schafer W., ―What Teachers Need to Know About Assessment.,‖ Washington, DC: National Education Association, 2002
[3]. Saad F. Shawer, ―Standardized Assessment and Test Construction without Anguish: The Complete Step-by-step Guide to Test Design, Administration, Scoring, Analysis and Interpretation,‖ Nova Science Publisher, ISBN: 978-1-61761-991-5, 2010
[4]. Fives, H. & DiDonato-Barnes, ―Classroom Test Construction: The Power of a Table of Specifications.‖ PARE Journal Vol.18 No 3, Feb 2013
[5]. Wolming, S., & Wikstrom, C., ―The Concept of Validity in Theory and Practice,‖ Assessment in Education: Principles, Policy Practice, 17(2), 117-132, 2010
[6]. Alade, O.M & Omonuyi, I., ―Table of Specification and Its Relevance in Educational Assessment,‖ European Centre for Research and Development UK., 2014
[7]. Frey, Bruce B. Quality Test Construction. University of Kansas. Specialconnections.ku.edu
[8]. BLOG EDUCC5N-LET, ―Assessment of Learning,‖ Far Eastern University, Institute of Education, 2012
[9]. Varma, S., ―Preliminary Item Statistics Using Point-biserial Correlation and P-values,‖ Educational Data Systems, 2016
[10]. Educational Assessments Corporation (EAC, 2009-2017). [11]. James Dean Brown, ―Shiken: JALT Testing & Evaluation
Sig Newsletter,‖ Vol.5 No.3 Oct. 2001(p.13) [ISSN 1881-5537]
[12]. Tucker, S., ―Using Remark Statistics for Reliability and Item Analysis,‖ University of Maryland, 2017
[13]. Maryellen Weimer, Phd, ―Advantages of Different Types of Test Questions,‖ Higher Ed Teaching Strategies From Magna Publications September 22nd, 2015 Issue.
[14]. Drost, Ellen A., ―Validity and Reliability in Social Science Research,‖ Education Research and Perspective, Vol.38, No.1.
[15]. Myers, C.B. & Myers, S.M., ―Assessing Assessment: The Effects of Two Exam Formats on Course Achievement and Evaluation,‖ Innovative Higher Education, Vol,31, Issue 4 pp 227, 2007
[16]. Middleton, F., ―Reliability vs Validity: what’s the difference?‖ Scribbr.com, 2019
[17]. Frey, B., ―The SAGE encyclopedia of educational research, measurement, and evaluation,‖ (Vols. 1-4). Thousand Oaks,, CA: SAGE Publications, Inc. doi: 10.4135/9781506326139, 2018
[18]. Point-biserial and Biserial Correlations. NCSS.com [19]. Quaigrain, K. & Arhin, A.K., ―Using reliability and item
analysis to evaluate a teacher-developed test in educational measurement and evaluation,‖ Cogent Education, 4:1, DOI: 10.1080/2331186X.2017.1301013, 2017
[20]. Ebel, R.L. & Frisbie, DA., ―Essentials of educational measurement.‖ Englewood Cliffs, NJ: Prentice – Hall, 1986 [21]. Wasserstein, R. & Lazar, A. ―The ASA's Statement on p-Values: Context, Process, and Purpose, The American Statistician,‖ 70:2, 129-133, DOI: 10.1080/00031305.2016.1154108 , 2016