United Kingdom ISSN 2348 0386 Vol. VII, Issue 12, December 2019
Licensed under Creative Common Page 633
http://ijecm.co.uk/
THE VALUE OF CORRECT TAXES IN THE
DEVELOPMENT OF STATE BUDGET REVENUES IN
DEVELOPED AND DEVELOPING COUNTRIES
Isayev Xusan Mansurovich
Scientific Researcher of Department of Finance
Tashkent Institute of finance, Tashkent city, Republic of Uzbekistan [email protected]
Abstract
Correct Taxes have a great value for the development of revenue for a state budget in
developed and developing countries. Growth and development of any country are
dependent to a great extent on its economy. Generation of revenue can be done by correct
taxes, which is a real method for the development of revenue for the state budget in any
developed and developing countries. This article is consequently completed to empirically
analyze the value of correct taxes on the financial improvement and development of state
budget revenues.
Keywords: Taxes, taxation state budget, revenues, developed countries, developing countries
INTRODUCTION
Licensed under Creative Common Page 634 Value of correct taxes and its development designs for state budget revenue uncover enormous contrasts for cross-countries, particularly among developed and developing countries. Specifically, developed countries today gather bigger national yield in assessments than do Developed countries, and they will, in general, depend more on salary tax collection to do as such. Developing countries, interestingly, depend more intensely on exchange charges, just as consumption taxes. Moreover, the information demonstrates that developed countries, in reality, gather a lot higher assessment taxes than developing countries in spite of tantamount statutory tax assessment rates, even subsequent to controlling for basic contrasts in financial action. This proposes cross-country heterogeneity in the financial limit to a great extent controlled by contrasts inconsistence and productivity of tax collecting components. Both of these elements appear to be influenced by the quality of political foundations (Bird, and Zolt, 2003).
I will provide a review of experimental proof in regards to the correct value and productivity ramifications of taxes in the development of state budget revenues. Specifically, I have clarified that the correct value of tax has an incredible re-distributive impact, yet it is critical to think about how the taxes additionally influences the conduct of people, by changing monetary motivators. For instance, ongoing examinations have discovered that taxes may prompt state budget revenue losses by instigating relocation of 'geniuses'. These potential state budget revenues lose feature the correct value of taxes and planning tax assessment frameworks that accomplish re-distributive targets at the littlest conceivable expense.
HISTORICAL PERSPECTIVE
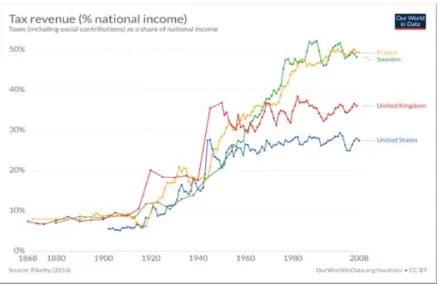
Licensed under Creative Common Page 635 Figure 1. Tax revenue (% national income)
Licensed under Creative Common Page 636 The correct value of taxes can be developed for state budget revenues with this structure:
Figure 2. The correct value of taxes
Licensed under Creative Common Page 637 Figure 3. Average annual GDP per capita growth by region
According to the United Nations, World Economic Statics 2018, the acceleration of development speed generally originates from moving business venture elements and, to a lesser degree, net exchange. Arrangement changes presented in the Tax Cuts and Jobs Act, marked into law in December 2017, are relied upon to contribute generally 0.1 rate focuses to GDP development in 2018, however, will expand the extent of the deficiency and dimension of government obligation over the medium term. Key strategy changes presented in the new state budget incorporate personal tax breaks from rich families, a noteworthy decrease in the rate of organization assessment, and changes to the motivators for people to acquire medical coverage inclusion, which may have repercussions for the worldwide objective of achieving general revenues inclusion. Annual tax breaks in 2018 will bolster the development of genuine individual extra cash, which found the middle value of simply 1% in 2016–2017. This will help support consistent
spending and goad a recuperation in the reserve funds rate, which has dropped to one of the most minimal dimensions over the past decades.
THE BIG PICTURE
Licensed under Creative Common Page 638 Figure 4. Total government revenue
Licensed under Creative Common Page 639 just to the last bit of pay earned by the rich. What's more, by suggestion, lower minimal rates do not infer the lower monetary correct value of tax for the rich (Keen, 2012).
Figure 5. The top peripheral tax value in France, Germany, US, and the UK
The diagram shows the top peripheral tax value in France, Germany, US, and the UK. As it tends to be seen, at the turn of the twentieth century, the top workers in these countries confronted just about zero tax assessment on their earnings; however this changed radically around 1910-1930, when high top minor tax rates were presented. Curiously, nonetheless, this kept going just until around 1980, then again all countries considerably decreased rates. Today the dimensions are among half and 33% of what they used to be at the most elevated point. In the UK, in 1978 the last pound of earned salary at the most astounding section was basically totally saddled (98%). Today the comparing figure is not exactly half (45%).
Licensed under Creative Common Page 640 had moderately stable dimensions of tax incomes in the most recent decade; while patterns and examples are less clear over the creating scene. By and large, particularly among upper-center salary nations, charge incomes have been going up reliably (Wallis, 2000).
For example, “the instance of Turkey emerges: in 1980 it gathered about 13.5% of GDP
in taxes (about the portion of the United States), yet by 2018 it had about multiplied taxes for state budget revenues practically making up for lost time with the United States. Regardless, in spite of explicit cases, for example, Turkey, contrasts today stay enormous and there is no unmistakable proof of worldwide combination. In many developing countries levels are low and patterns have not been relentlessly going up by a critical edge” (Roberto, 2019).
COMPARISON OF DEVELOPING AND DEVELOPED COUNTRIES IN TERMS OF TAX
REVENUE
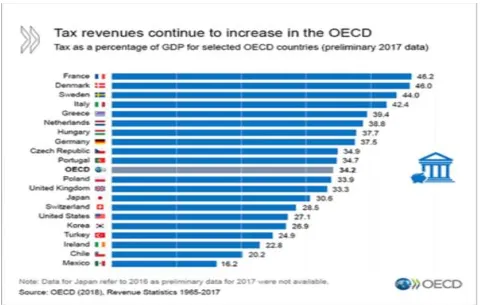
The diagram indicates contrasts in tax incomes as an offer of GDP for different developed and developing countries. The groupings with different color show the different countries, with two timeframes: 1990-1995 and 1996-2018. For each time-frame, the countries are positioned by core value of taxes as the offer of national pay and reports the dimension for the country in the state budget revenues. This gives the perspectives for that country.
Licensed under Creative Common Page 641 Developed countries gather twice as much as developing countries in tax income. Also, developing countries, thusly, gather practically half as much as change economies. Additionally, we can see that developed countries had little change in correct value of taxes to-gross domestic product proportions in the second 50% of the twentieth century, where as in developing countries there is by all accounts a wide negative pattern.
Table 1. Tax Revenue as a Percentage of GDP
Developed Countries 30.3%
Developing Counties 69%
FORMS OF TAXATION DOMINATE REVENUES IN STATE BUDGET DEVELOPMENT
I have already discussed the fact that the value of taxes differ greatly across world regions – vary extraordinarily crosswise over world districts – both in levels and patterns. Presently I am
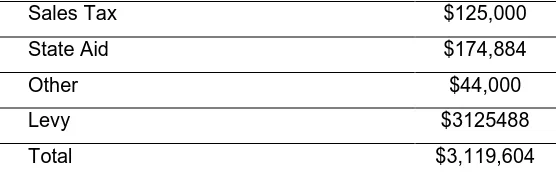
focusing on contrasts in the development of expense incomes for the state spending plan. The accompanying table exhibits a breakdown of expense income hotspots for a state spending plan of created regions. The evaluated incomes have accommodated a determination of developed countries on panels, and are communicated as an offer of GDP. The information originates from State budget plan forecasting specialist organizations, and incorporates deals tax(Direct and indirect), state help, as different duties, demand.
Table 2. Estimated Revenue summary for state Budget of developed countries 2019-2020
Sales Tax $125,000
State Aid $174,884
Other $44,000
Levy $3125488
Total $3,119,604
In spite of the fact that these assessments are to some degree dated, they do give an unpleasant thought of tax collection designs by developed and developing countries. As it can be seen, developing countries depend fundamentally on aberrant taxes, especially taxes on exchange and utilization.
Licensed under Creative Common Page 642 at 10% of GDP in 1996, government disability incomes are just about multiple times bigger than in developing countries. Later information proposes that correct tax values for state budget revenues, and explicitly salary tax assessment, stays more significant in developed countries than in developing countries. The accompanying outline shows complete income from assessments on pay and benefits (flat hub) against income from charges on merchandise and ventures (vertical pivot).
Figure 7. Tax revenues continue to increase in the OECD
Licensed under Creative Common Page 643 RECENT TRENDS FOR VALUE OF TAXES
The diagram gives an outline of revenues from pay tax assessment (explicitly imposes on livelihoods, benefits, and capital increases) amid the period 1980-2019. The information indicates huge and relentless cross-country heterogeneity, even inside moderately comparable countries, for example, those in the OECD. “In developing countries, the information
demonstrates that the correct tax value of companies and people represents a big revenue generation. This has been reliably the situation from the past few decades. A significant revenue of state budget in developed countries originates from direct types of tax collection, so it is not astounding that the development of salary tax assessment tracks intently the steady advancement of expense for state spending incomes. The correct value of taxes for particular countries are special for the development of state budget revenue. For instance, In China, the value of tax with GDP that is gathered by people and organizations nearly multiplied in the period 2000-2019 One significant component of tax assessment frameworks is the statutory rate of tax collection that applies to the most elevated section of earnings. This measure, typically known as the 'top negligible correct value of the tax, relates to the state budget revenue that applies to the 'only remaining dollar' of pay earned by the rich” (OECD-DAC, 2019).
Figure 8. Budget revenues and expenditures
Licensed under Creative Common Page 644 tax reductions as a level of after-charge pay. A recuperation in outer interest and desires for stable residential interest development will keep on supporting a moderate get in venture into 2018. The decrease in the organization tax rate from a limit of 35 percent to a level rate of 20 percent (25 percent for individual administrations partnerships) may empower capital spending. In any case, waiting vulnerabilities in regards to future exchange connections and the withdrawal of money related upgrade may keep down an increasingly strong bounce back in venture action. Low assessment incomes and to a great extent unbending open consumption have added to tireless basic financial shortfalls over the area. Improving tax incomes is a basic angle in structure monetary cushions and fortifying the ability to execute counter cyclical approaches
Comparison of marginal rates of taxes with average rates of taxes
The correct value of the tax is characterized as the rate of taxes that is connected to the 'dollar' added to the assessable pay. This implies minimal rates to the bit of assessable pay that surpasses the lower pay edge for that peripheral rate. Interestingly, the normal, or compelling rate of tax assessment is characterized as the proportion of absolute expenses paid by all-out salary earned – that is, the offer of payment that is made good on in pay government expenses.
The refinement between these two ideas is significant on the grounds that for some individuals, a segment of their salary is exhausted at one rate, and the rest stands at another rate. In the US, for instance, if a wedded couple earns $50,000 every year, they make good on administrative pay government expenses at a rate of 10% on the first $19000 or something like that, and at a rate of 15% on the rest. Thus, while the negligible rate connected to the only remaining dollar earned is 15%, the viable annual assessment rate is lower. This examination demonstrates that normal and negligible annual assessment rates are unmistakably unique. In particular, while both normal and negligible rates are expanding, normal rates are smoother and by and large lower (Prichard, Cobham, Goodall, 2014).
CONCLUSION
In this article, I have endeavored to discuss a general perspective of the correct value of taxes in the development of the state budget for both developed and developing countries. I have collected the information delivered by the IMF, United Nations, World Bank, and OECD. I have frequently covered the trends in various counties and I have discovered that for these countries where assessments cover, there are noteworthy inconsistencies. The irregularities between sources are regularly because of contrasts in methodological decisions –, for instance, contrasts
Licensed under Creative Common Page 645 gathered by nearby governments. Furthermore, notwithstanding methodological contrasts, sources additionally appear to vary in other considerable non-orderly ways. The administration of developed and developing nations are making gigantic strides to improve the state budget revenues with correct taxes, and social welfare venture that is reflected in the state budget. To accomplish the correct value of taxes for the development of the state budget, these tax traditions changes can be sufficient.
ACKNOWLEDGMENT
While writing this article, I got inspired by a few people and sources. Firstly, I would like to thank my supervisor, who
was in constant support until the day I completed my research work. Secondly, I would also wish to thank my
department, that helped me with enough resources and content about the value of taxes and developed and
developing countries state budget trends during my study. And lastly, I acknowledge my colleagues who played a role
in the discussions and research in the libraries to make this article happen.
REFERENCES
Bird, R.M. and E.M. Zolt (2003). ‘Introduction to Tax Policy Design and Development’. Paper for Course on Practical Issues of Tax Policy in Developing Countries. Washington, DC: World Bank.
Keen, M. (2012). ‘Taxation and Development - Again’. IMF Working Paper WP/12/220. Washington, DC: International Monetary Fund.
OECD (2016) Consumption Tax Trends 2016, OECD Publishing, Paris.
OECD-DAC (2019). ‘Tax and Development: Aid Modalities for Strengthening Tax Systems’. Organization for Economic Co-Operation and Development.
Piketty, T. (2014). Capital in the 21st Century. Cambridge: Harvard University Press
Prichard, W., Cobham, A., & Goodall, A. (2014). ICTD Government Revenue Dataset ICTD working paper 19. Institute of Development Studies, Brighton.
Przemyslaw Kowalski (2010). Impact of changes of tariffs pn developing countries Government Revenue. University of Michigan Press.
Roberto Ricciuti, (2019), Low tax collection in developing economies has a more devastating impact than we thought. University of Verona.
Total Taxes On Goods And Services (% OF GDP) (ICTD (2018)). OECD Revenue Statistics; OECD Latin American Tax Statistics; IMF Government Finance Statistics (GFS); IMF Article IV Staff Reports; CEPALSTAT Revenue Statistics in Latin America. International Centre for Tax and Development / UNU-WIDE.