REVIEW ON IMAGE FUSION
TECHNIQUES AND PERFORMANCE
EVALUATION PARAMETERS
DR. H.B. KEKRE
Sr Prof, Department of Computer Science, NMIMS UNIVERSITY Mumbai, Maharashtra 400056, India
DR. DHIRENDRA MISHRA
Associate Prof, Department of Computer Science, NMIMS UNIVERSITY Mumbai, Maharashtra 400056, India
RAKHEE SABOO
Student, Department of Computer Science, NMIMS UNIVERSITY Mumbai, Maharashtra 400056, India
Abstract:
With the advent and proliferation of image processing, image fusion has been an important research topic in many related areas such as computer vision, automatic object detection, remote sensing, robotics, medical imaging, image classification, military and law enforcement, etc. The aim of image fusion is to integrate corresponding information from different sources into one new image. The idea is to lessen uncertainty and minimize redundancy in the output while maximizing relevant information particular to an application or task. This paper discusses the basics of image fusion, various pixel level algorithms for image fusion and methods for evaluating and assessing the performance of these fusion algorithms.
Keywords: Image Fusion, Fusion Methods, Principal Component Analysis, Pyramid Methods, Discrete Transform Methods, Image Quality Metrics.
1. Introduction
The term fusion means, in general, a way to extract information acquired in several domains. Data fusion is the process of combining the information from same or different sources at the same time or separate times to generate an interpretation of the data not obtainable from a single source. Image fusion is a component of data fusion when data type is strict to image format. [3]
Image Fusion is a process of integrating the relevant information from a set of images, into a single image, wherein the resultant fused image will be more informative and suitable for visual perception or processing than any of the input images considered separately.
The need for image fusion in image processing domain is on the rise primarily due to the increase in the image acquisition techniques. With the availability of sensor, resolution, temporal and multi-view image data the fusion of digital image data has become a valuable tool. [3]
Current technology in imaging sensors presents a wide variety of different information that can be extracted from an observed scene. This information is collectively combined to provide an enhanced representation of the scene. Most of the available equipment is not capable of providing such information convincingly. The image fusion methods allow the integration of different information sources thus making the fused image more informative.
Any fusion algorithm must satisfy two main requirements. Firstly, they must identify the most significant features in the input images and transfer them without loss of detail into the fused image. Secondly, the fusion method should not bring in any inconsistencies or artifacts which would distract the human observer or following processing stages.
2. Categorization of Image Fusion Techniques [1, 3, 6]
Image fusion techniques can be roughly classified into 2 groups: based on how the input images were acquired and based on the levels of processing.
2.1. Based on how the images were acquired
Depending upon the purpose of fusion and the methods by which the input images were acquired, the fusion techniques can be classified into four types:
1) Multi-sensor image fusion integrates the images taken by different sensors.
2) Multi-temporal image fusion combines the images taken at different times in order to detect changes between them or to synthesize realistic images of objects which were not photographed in a desired time.
3) Multi-focus image fusion of images deals with 3D scene taken repeatedly with various focal lengths.
4) Multi-view image fusion integrates the images from the same modality and taken at the same time but from different viewpoints.[2]
2.2. Based on the Level of Processing [3]
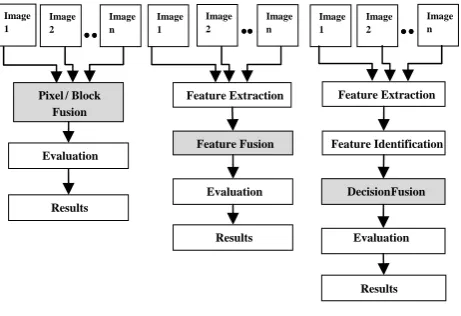
Image fusion can be performed roughly at three different stages: pixel level, feature level, and decision level.
1) Pixel level fusion is carried out on a pixel-by-pixel basis. It generates a fused image wherein the information related with each pixel is determined from a set of pixels in source images to improve the performance.
2) Block level fusion depends on the neighborhood pixels of the respective one.
3) Feature level fusion requires an extraction of objects recognized in the various data sources. It operates on the salient features of the image such as size, shape, edge, pixel intensities or textures. These similar features from input images are fused.
4) Decision-level fusion consists of integrating information at a higher level of abstraction, combines the results from multiple algorithms to yield a final fused decision. To extract information, input images are processed. The obtained information is then combined applying decision rules to reinforce common interpretation. Decision level fusion which deals with symbolic representation of images.
Fig. 1. Processing Levels of Image Fusion
3. Pixel and Block Level Image Fusion Techniques
In recent years, several image fusion techniques have been proposed. The evolution of the research work in the field of image fusion can be broadly put into the following three stages:
1. Simple Image Fusion
2. Pyramid Decomposition Based Fusion 3. Discrete Transform Based Fusion
3.1. Simple Image Fusion Techniques
3.1.1.Averaging Technique [4,5]
This is the simplest method. In this technique, the resultant fused image is obtained by simple averaging corresponding pixels in each input images. Let there be ‘n’ input images. The fused image is obtained as F(x, y) = (f1(x, y) + f2(x, y) + …+ fn(x, y)) / n ; where f1…fn are the input images and F(x, y) is the corresponding fused pixel value. The main disadvantage of this method is that it does not give guarantee to have a clear objects from the set of images.
Image
1
Image 2
Image n
Image 1
Image 2
Image n
Image 1
Image 2
Image n
Pixel / Block Fusion
Feature Extraction
Feature Identification Feature Extraction
Feature Fusion Evaluation
Evaluation
DecisionFusion
Evaluation
Results
Results
Results
3.1.2.Greatest Pixel Value/Maximum Pixel Value Technique[4, 5]
The Greatest Pixel Value algorithm chooses the greatest value from corresponding pixels and assigns it to the corresponding pixel of the resultant image. This is repeated for all pixel values. Let there be ‘n’ input images. The fused image is obtained as F(x, y) = max(f1(x, y) , f2(x, y) , … ,fn(x, y)) ; where f1…fn are the input images and F(x, y) is the corresponding pixel value. This result in highly focused image output obtained from the input image. Pixel level methods are affected by blurring effect which directly affect on the contrast of the image.
3.1.3.Minimum Pixel Value Technique
A selection process is performed here wherein, for every corresponding pixel in the input images, the pixel with minimum intensity is selected, respectively, and is put in as the resultant pixel of the fused image. Let there be ‘n’ input images. The fused image is obtained as F(x, y) = min(f1(x, y) , f2(x, y) , … ,fn(x, y)) ; where f1…fn are the input images and F(x, y) is the corresponding pixel value. [6]
3.1.4.Max- Min Technique
In this technique, for every corresponding pixel in the input images, the pixel with minimum intensity and maximum are selected, respectively, and their average is taken. The resultant value is put in as the corresponding pixel of the fused image.
3.1.5.Simple Block Replace Algorithm
Simple Block Replace algorithm takes into account the neighboring pixels. For each pixel F (x, y) of each image its neighboring pixels are added and a block average is calculated. After comparison, the pixel from the input image with the maximum block average is put in as the resultant pixel to the output fused image. This is repeated for all pixel values. [4]
3.1.6.Principal Component Analysis Algorithm [4, 5]
Principal Component Analysis (PCA) is a general statistical technique that transforms multivariate data with correlated variables into one with uncorrelated variables. It is often used to reduce multidimensional data sets to lower dimensions for analysis. It reveals the internal structure of data in an unbiased way. [4] But this fusion method may produce spectral degradation. The fused image is given by If(x, y) =P1I1(x, y) +P2I2(x, y) where P1and P2 are the normalized components and its equal to P1=V(1) / ΣV and P2=V(2) / ΣV where V is Eigen vector and P1+ P2=1.[5]
3.2. Pyramid Decomposition Based Fusion [6]
A pyramid decomposition fusion consists of a number of images at different scales which together represent the original image. In general, every pyramid transform consists of three major phases:
i. Decomposition
Decomposition is the process where a pyramid is generated in succession at each level of the fusion. The depth of fusion or number of levels of fusion is predefined. Decomposition phase basically consists of the following steps. These steps are performed ‘p’ number of times, ‘p’ being the number of levels to which the fusion will be performed.
The input images are first passed through a low pass filter with which these images are convolved/ filtered. After that the pyramid is generated from the convolved/filtered images. The input images are then decimated to half their size, which would act as the input image matrices for the next level of decomposition.
ii. Formation of the initial image for re-composition
The input images are merged after the decomposition process. This resultant image would be used as the initial input to the re-composition process. The finally decimated input images are worked upon either by averaging the decimated input images, selecting the minimum decimated input image or selecting the maximum decimated input image.
iii. Re-composition
In the recomposition process, the resultant image is finally created from the pyramids formed at each level of decomposition. These steps are performed ‘p’ number of times as in the decomposition process.
Steps:
The input image is undecimated to the level of recomposition
The transpose of the filter vector used in the decomposition stage is applied to convolve/filter the un-decimated matrix.
The filtered matrix is then combined, by the process of pixel intensity value addition, with the pyramid formed at the respective level of decomposition.
The combined image at the final level of recomposition will be the resultant fused image. The different pyramid based fusion methods are discussed below:
3.2.1.Fusion using Laplacian Pyramid[7]
Each level of the Laplacian Pyramid is constructed from its lower level by blurring, down-sampling, interpolating and differencing.[4] The Laplacian pyramid fusion consists of an iterative process of forming Gaussian or Laplacian pyramid at each source image, then fusing the input images at each pyramid level by selecting the pixel with any of the simple pixel techniques, combining the fused pyramid with the combined pyramid expanded from the lower level, and then expanding the combined pyramids to the upper level.
3.2.2. Fusion using Gradient Pyramid[6,7]
A gradient pyramid of an image is obtained by applying gradient operators to the Gaussian pyramid at each level. The gradient operators are used in the horizontal, vertical, and 2 diagonal directions. At each level, these 4 directional gradient pyramids are combined together to obtain a combined gradient pyramid that is similar to a Laplacian pyramid.
3.2.3.Fusion using Ratio of Low Pass Pyramid[7]
Ratio of Low Pass Pyramid is another pyramid in which at every level the image is the ratio of two successive levels of the Gaussian pyramid.
3.2.4.Fusion using Filter Subtract Decimate(FSD) Pyramid[7]
The FSD pyramid fusion method is conceptually the same as the Laplacian pyramid fusion method. The sole difference is in the stage of obtaining the difference images during the creation of the pyramid. In FSD pyramid, the difference image is obtained directly from the Gaussian image Gk at level k by subtracting it with the low-pass filtered image of Gk.
3.2.5. Fusion using Morphological Pyramid[6,7]
A morphological pyramid is generated by applying morphological filters to the Gaussian pyramid at each level and taking the difference between 2 neighboring levels. A morphological filer is generally used for noise removal and image smoothing. The decomposition phase consists of two levels of filtering are performed on the input image matrices – image opening and image closing. In the recomposition phase, instead of applying a low pass filter, image dilation is performed over the image.
3.3. Discrete Transform Based Fusion [5]
Generalized Algorithm for Transform Based Fusion Techniques:
i. Take input images of same size and of same scene or object taken from different sensors like visible and infra red images or images having different focus.
ii. If the input images are colored, separate their RGB planes to perform 2D transforms.
iii. Apply transforms like Discrete Cosine Transform, Kekre’s Wavelet transform,Discrete Wavelet Transform Technique with Haar or other transforms to perform decomposition of images
iv. Fuse the input image components by taking their average
The schematic diagram for Transform based pixel level image fusion scheme is shown in Fig.2.
Fig. 2. Schematic diagram for Transform based pixel level image fusion scheme[5]
3.3.1.Discrete Cosine Transform (DCT) Method[7]
In this technique, DCT is applied on each of the input image. The average for corresponding pixels is taken. Lastly, the resultant fused image is reconstructed by applying inverse discrete cosine transform.
3.3.2. Discrete Wavelet Transform with Haar Method[10]
The algorithm first decomposes the input images to get an approximate image and a detail image. The DWT of an image x is calculated by passing it through a series of filters. First it is passed through a low pass filter impulse response g and is also decomposed simultaneously using a high-pass filter h. The outputs give the detail coefficients (from the high-pass filter) and approximation coefficients (from the low-pass). This decomposition is repeated to further increase the frequency resolution and the approximation coefficients decomposed with high and low pass filters and then down sampled. [5] The Haar wavelet is the first known wavelet. The 2×2 Haar matrix that is associated with the Haar wavelet is
1
1
1
1
2
1
2
H
(1)The schematic diagram for wavelet transform based image fusion is shown in Fig.3.
Fig. 3. Schematic diagram for Wavelet Transform based image fusion [5]
Apply Transform
Take Average
Apply Inverse Transform
Image 2 Image n Image 1
Fused Image Apply Transform
Apply Transform If colored
images, separate their RGB components
If colored images, separate their RGB components
3.3.3.Kekre’s Wavelet Transform Based Fusion Technique[5]
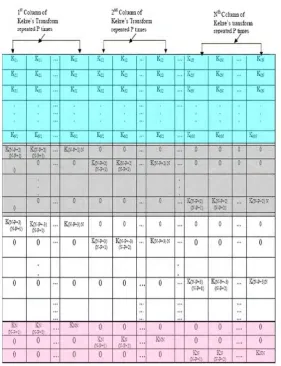
Kekre’s Wavelet Transform is derived from Kekre’s Transform. It can be of any size NxN, which need not to be an integer power of 2. The upper diagonal and diagonal elements of Kekre’s transform matrix are 1, while the lower diagonal part except the elements just below diagonal is zero. Generalized NxN Kekre’s transform matrix can be given as shown in Fig.4.
The formula for generating the element Kxy of Kekre’s transform matrix is,
Fig. 4. Kekre’s Transform (KT) matrix of size NxN [5,14]
1
0
1
1
1
y
x
y
x
x
N
y
x
Kxy
;
;
)
(
;
(2)
Kekre’s Wavelet transform uses Kekre’s transform. From NxN Kekre’s transform matrix, Kekre’s Wavelet transform matrices of size (2N) x(2N), (3N)x(3N),..., (N2)x(N2) can be generated. For example, from 4x4 Kekre’s transform matrix, we can generate Kekre’s Wavelet transform matrices of size 8x8, 12x12, 16x16 and 20x20. In general, from NxN Kekre’s transform matrix, MxM Kekre’s Wavelet transform matrix can be generated, such that M = N * P where P is any integer between 2 and N that is, 2 ≤ P ≤ N. The Kekre’s transform matrix of size NxN is shown in Fig. 5.
The first row of T is used to generate (N+1) to 2N rows of Kekre’s Wavelet transform matrix while the second row of T is used to generate (2N+1) to 3N rows of Kekre’s Wavelet transform matrix. Likewise last row
of T is used to generate ((P-1)N + 1) to PN rows.[8]
Fig. 6 shows extracted elements of Kekre’s transform matrix stored in T.
Values of matrix T can be computed as, T(x,y) = K( N-P+(x+1), N-P+ y) ; 1≤ x≤ (P-1) , 1≤ y≤ P
Fig. 7 shows MxM Kekre’s Wavelet transform matrix generated from NxN Kekre’s transform matrix. First N numbers of rows of Kekre’s Wavelet transform matrix are generated by repeating every column of Kekre’s transform matrix P times. To generate remaining (M-N) rows, extract last (P-1) rows and last P columns from Kekre’s transform matrix and store extracted elements in to temporary matrix say T of size (P-1) x P.
4. Image Quality Metrics
Image Quality is a characteristic of an image that measures the perceived image degradation (in general, compared to an ideal or perfect image). Imaging systems like the fusion algorithm may bring in some amounts of distortion or artifacts in the image; hence the quality assessment is an essential problem. Image Quality assessment methods can be broadly classified into two categories: Full Reference Methods (FR) and No Reference Methods (NR). In FR, the image quality is measured in comparison with a reference image which is assumed to be perfect in quality. NR methods do not employ a reference image. [6]
Furthermore, image fusion assessment can be categorized into either qualitative or quantitative in nature. In practical applications, however, neither qualitative nor quantitative assessment single-handedly will satisfy the needs perfectly.
4.1. Full Reference Methods [9]
Let A be the perfect image, B be the fused image to be assessed. Let i be the pixel row index & j be the pixel column index. Let the size of the image be M x N.
When the reference image is available, the performance of image fusion algorithms can be evaluated using the following metrics
4.1.1.Mean Squared Error (MSE)
The mean squared error is given by:
2 M 1 i N 1 j ij ijB
A
MN
1
=
MSE
(3)4.1.2.Peak Signal to Noise Ratio (PNSR)
The peak signal to noise ratio is given by:
MSE
Peak
log
*
10
PSNR
210 (4)
Here, at pixel level, in a 8 bit grayscale image, the maximum possible value (peak) is having every bit as 1, i.e., 11111111; which is equal to 255.
4.1.3.Root Mean Squared Error (RMSE)
A commonly used reference-based assessment metric is the root mean square error (RMSE). RMSE measures the difference between values that are fused and the actual value. It is an objective evaluation measure requiring a reference image.
It is defined as follows:
M 1 i N 1 j 2i,j))
(A(i,j)-B(
MN
1
RMSE =
(5)4.1.4.Mutual Information (MI)
The mutual information I(A,B) is used to measure the similarity of image intensity distribution between images A and B. Image histograms can be used to obtain distribution probabilities. Higher the value of I(A,B) better the similarity between A and B, and thus a better fusion algorithm.
Mutual Information is defined as
b
a, A B AB AB
(b))
(a)P
(P
b))
(a,
log(P
b)
(a,
P
=
B)
I(A,
(6)where
PAB(a,b) is the joint distribution probability,
PA(a) and PB(b) are the distribution probabilities of A and B, respectively. 4.1.5.Structural Similarity Index Metrics (SSIM)
The Structural Similarity (SSIM) index is defined as a measure to assess similarity of two images A and B. It is defined as follows:
)
C
+
)(
C
+
+
(
)
C
+
)(2
C
+
(2
=
B)
SSIM(A,
2 2 B 2 A 1 2 B 2 A 2 AB 1 B A
(7) whereμA and μB are the mean intensities of images A and B, respectively, σA and σB are standard deviations of A and B, respectively , σAB is the covariance of A and B,
C1 and C2 are small constants for A and B, respectively.
A higher value of SSIM index corresponds to greater similarity of the two images.
4.2. No Reference Methods [9, 11]
When the reference image is not available, the following metrics are used to test the performance of the fused algorithms:
4.2.1.Entropy
Entropy is an index to evaluate the information quality of an image. If the entropy value becomes higher after fusion, it is an indication that the information quality has increased and the fusion performance has improved.
G 0 i 2{p(i)}
p(i)log
-=
Entropy
(8)where G is the number of gray levels in the image’s histogram (255 for a typical 8-bit image), and p(i) is the normalized frequency of occurrence of each gray level, i.e., the histogram of the image.
To sum up the self-information of each gray level from the image, the average information content (entropy) is estimated in the units of bits per pixel. It should be noted that entropy is also sensitive to noise and other unwanted rapid fluctuations.
4.2.2.Standard Deviation (SD)
This metric is more efficient in the absence of noise. It measures the contrast in the fused image. An image with high contrast would have a high standard deviation. The standard deviation (SD), which is the square root of variance, reflects the spread in the data. Thus, an image with high contrast would have a high standard deviation, and a low contrast image would have a low standard deviation.
4.2.3.Spatial Frequency (SF)
This frequency in spatial domain indicates the overall activity level in the fused image. Spatial frequency if given by
)
CF
+
(RF
=
SF
2 2(9) where
Row frequency of the image is given as
1))
-j
I(i,
-j)
(I(i,
(1/MN
=
RF
M =1 i N 2 = j 2
(10)and column frequency of the image is given as
j))
1,
-I(i
-j)
(I(i,
(1/MN
=
CF
N 1 = j M 2 = i 2
(11)4.2.4.Fusion Mutual Information
This is very similar to mutual information. Let A and B be the source images and let F be the fused image. When no reference images are available, fusion assessment is performed as follows:
a. The MI-based measure is defined as MF(A,B)=I(F,A)+I(F,B)
b. MF (A, B) represents total amount of similarity between fused image F vs. source images A and B. Again, a higher value indicates a better fusion algorithm.
5. Conclusion
Image Fusion aims to enhance the information apparent in the images as well as to increase the reliability of the interpretation by integrating disparate and complementary images. This leads to more precise data and increased utility in application fields like medical imaging, computer vision remote sensing, etc. This paper discusses different techniques for pixel level image fusion and their performance evaluation parameters.
Depending upon the use of the given application, some users may wish a fusion outcome that would show more color details, some may desire more analysis or mapping; while some may want improved accuracy of application; and some others may wish for a visually beautiful and appealing fused color image, solely for visualization purposes. Thus, we can conclude that no fusion algorithm outperforms the others. A combination of qualitative and quantitative assessment approach may be the correct way to find out which fusion algorithm is most appropriate for an application. The need of the hour is to have distinct techniques for mapping oriented fusion, classification-oriented fusion, and visualization-oriented image.
6. References
[1] C.Pohl and J.L. van Genderen, ’Multisensor image fusion in remote sensing: Concepts, methods and applications ’, International Journal of Remote Sensing, Vol. 19, 1998, pp. 823-854
[2] C.M.Sheela Rani, P.S.V.Srinivasa Rao, V.VijayaKumar, “Improved Block based Feature level Image fusion technique using Contourlet transform with Neural network”, Signal & Image Processing : An International Journal (SIPIJ), 203-214, Vol.3, No.4, August 2012
[3] Dong Jiang, Dafang Zhuang, Yaohuan Huang and Jinying Fu (2011). Survey of Multispectral Image Fusion Techniques in Remote Sensing Applications, Image Fusion and Its Applications, InTech, DOI: 10.5772/10548.Available:
[4] Dong, J., Zhuang, D., Huang, Y., Fu, J.: Survey of Multispectral Image Fusion Techniques in Remote Sensing Applications. Image Fusion and Its Applications, Intech., 1–22 (2011)
[5] Anjali Malviya, S. G. Bhirud,’’ Image fusion of digital images’’, India, International Journal of Recent Trends in Engineering, Vol. 2, No. 3,pp.146-148, November 2009.
[6] H. B. Kekre, Tanuja Sarode, Rachana Dhannawat. "Implementation and Comparison of different Transform Techniques using Kekre's Wavelet Transform for Image Fusion." International Journal of Computer Applications, Vol. 44, No. 10, 2012, pp. 41-48.
[7] Shivsubramani Krishnamoorthy, K.P.Soman, “Implementation and Comparative Study of Image Fusion Algorithms”, International Journal of Computer Applications, Vol. 9, No.2, November 2010, pp. 25-35.
[8] J Zeng, A Sayedelahk, T Gilmore, P Frazier, M Chouika, “Review of Image Fusion Algorithms for Unconstrained Outdoor Scenes”, Proceedings of the 8th International Conference on Signal Processing, Volume 2, pages 16-20, 2006.
[9] Dr. H. B. Kekre, Archana Athawale, Dipali Sadavarti,”Algorithm to Generate Kekre’s Wavelet Transform from Kekre’s Transform”, International Journal of Engineering Science and Technology,Vol. 2(5), 2010, pp. 756-767.
[10] Naidu, V.P.S. & Raol, J.R. ,”Pixel-level image fusion using wavelets and principal component analysis a comparative analysis”, Defense Science Journal, May 2008, Vol. 58, No 3,pp. 338-52
[11] Tania Stathaki. Image Fusion: Algorithms and Applications. (1st edition)[On-line].
[12] H.B.Kekre and Dhirendra Mishra, “Sectorization of Haar and Kekre’s Wavelet for Feature Extraction of color images in Image Retrieval”, International Journal of computer science and information security (IJCSIS),USA Vol.9,No.2,Feb,2011,pp.180-188 ISSN 1947-5500.
[13] H.B.Kekre and Dhirendra Mishra, “Sectorization of Full Kekre’s Wavelet Transform for Feature extraction of Color Images”, International Journal of advanced computer science and Applications (IJACSA),USA, Vol.2,No.2, Feb 2011,pp.69-74,ISSN: 2156-5570(Online).
![Fig. 4. Kekre’s Transform (KT) matrix of size NxN [5,14]](https://thumb-us.123doks.com/thumbv2/123dok_us/9666834.1494564/6.595.161.439.152.351/fig-kekre-transform-kt-matrix-of-size-nxn.webp)