Available online on 15.11.2018 at http://jddtonline.info
Journal of Drug Delivery and Therapeutics
Open Access to Pharmaceutical and Medical Research© 2011-18, publisher and licensee JDDT, This is an Open Access article which permits unrestricted non-commercial use, provided the original work is properly cited
Open Access
Research Article
Development and optimization of orodispersible tablets using solid
dispersion of Telmisartan
Joshi Ramakant*, Akram Wasim, Garud Navneet, Dubey Ashutosh, Bhadkariya Santosh
School of Studies in Pharmaceutical Sciences, Jiwaji University, Gwalior (M.P)-474009, India
ABSTRACT
The present study aimed towards the development of active delivery system for management of hypertension. The Orodispersible tablets (ODTs) containing Telmisartan was developed in order to accomplish enhanced solubility leading to better bioavailability profile. Different ratios, of Telmisartan and PEG 6000 i.e. 1:1, 1:2, 1:3, 1:4 and 1:5 were selected for the formulation of ODT system. A batch process was adopted for the preparation of solid dispersion with each combination of drug and polymer and the finally compressed as tablets by direct compression technique. For the preformulation perspective materials were scrutinized on the basis of solubility profile, drug content, Fourier Transform Infrared (FTIR) spectroscopy andDifferential scanning calorimetry (DSC). The drug polymer ratio 1:4 was selected for further compression process. The prepared batches of ODTs were characterized for micromeritic study, thickness, hardness, weight variation, wetting time, disintegration time, drug content and in vitro drug release profile. The evaluation data for all batches was satisfactory out of them formulation TF3 containing 6% kyron T-314 showed the best results with a value of 29.3 sec and 24.1 sec for wetting and disintegration, respectively. This formulation showed superior drug release of 99.93% over a period of 30 minutes.
Keywords: Telmisartan, PEG 6000, Angioten receptor-II antagonist, Solid dispersion, Kyron T-314
Article Info:Received 03 Oct, 2018; Review Completed 06 Nov 2018; Accepted 09 Nov 2018; Available online 15 Nov 2018
Cite this article as:
Joshi R, Akram W, Garud N, Dubey A, Bhadkariya S, Development and optimization of orodispersible tablets using solid
dispersion of Telmisartan, Journal of Drug Delivery and Therapeutics. 2018; 8(6):171-178 DOI: http://dx.doi.org/10.22270/jddt.v8i6.2139
*Address for Correspondence:
Ramakant Joshi, School of Studies in Pharmaceutical Sciences, Jiwaji University, Gwalior (M.P)-474009, India
INTRODUCTION
Over the years, hypertension is a mammoth challenge for the health professionals. Telmisartan is a BCS class-IInd
drug, is very poorly soluble in water, which results in the slow dissolution and hence low bioavailability when administered orally (~41%)1-3.The absolute bioavailability
of Telmisartan is dose-dependent. The bioavailability of Telmisartan increased from 41% to 59%, when the dose was increased from 40 mg to 160 mg respectively. The solid dispersion approach can be successfully used in the improvement of solubility of poor water soluble drugs. A number of drugs have been shown to exhibit better aqueous solubility and dissolution characteristics in the form of solid dispersion4,5.
Telmisartan is used in the treatment of hypertension. The action of Telmisartan is done by binding to binding to the angiotensin II type 1 receptors, resulting in the inhibition of angiotensin II on vascular smooth muscles, so it is a angiotensin II receptor antagonist6. Problems like low
solubility and bioavailability conquered by the utilization of solubility enhancement technique i.e. solid dispersion and novel formulation approach i.e. ODTs. ODTs disintegrate or dissolve very rapidly in mouth as they come into the contact with saliva, without any need of extra water. This unique asset of ODTs combines the advantages of both liquid and conventional dosage form, for oral administration. Rapid disintegration of ODTs within the oral cavity fosters pregastric absorption through buccal mucosa, pharyngeal mucosa and oesophagus. Due to this pregastric absorption first pass metabolism is bypassed and accounts for the enhanced bioavailability of the incorporated therapeutic agent. Additionally, the problem of dysphagia especially in paediatric and geriatric individuals is triumphed over by the development of ODTs7. These exceptional possessions put the ODTs on the
The present course of study attempts to enhance the solubility of Telmisartan by solid dispersion technique with polyethylene glycol (PEG 6000) and compressed it as ODT in order to develop an effective treatment for the management of Hypertension10-12.
MATERIALS AND METHODS Materials
Telmisartan was received as a gift sample from Skymap Pharmaceuticals, Roorkee, India. Sodium starch glycolate, croscarmellose sodium was a kind gift from Maple biotech pvt. Ltd. Pune, Maharashtra and kyron T-314 was kindly donated by Corel pharma chem., Ahemdabad, Gujrat. Poly ethylene glycol (PEG 6000), Micro crystalline cellulose was purchased from SD fine chemicals; Poly vinyl pyrollidone (PVP), magnesium stearate, and talc were purchased from Himedia laboratories Ltd. All other chemicals used were of analytical grade.
Methods
Preparation and characterization of solid dispersion Solid dispersion of Telmisartan and PEG 6000 was prepared using different ratios i.e. 1:1, 1:2, 1:3, 1:4, 1:5 by conventional solvent evaporation method13. Briefly,
Telmisartan and PEG 6000 were weighed accurately in different ratios and mixed uniformly. This mixture was dissolved in ethanol with continuous stirring and subjected to solvent evaporation by heating at 40 0C. The resultant
solid dispersions were dried for 24 hr. in desiccator. Dried mass was scraped, crushed, pulverized and passed through sieve (# 60)
Solubility study
Samples (pure drug and solid dispersion) equivalent to 10 mg of Telmisartan were added to 10 ml each of distilled water and PBS (pH 6.8). These dispersions were shaken well and kept for 24 h. The solution was filtered through whatman filter paper (#41) and spectrophotometrically analysed at 296 nm using UV-Visible spectrophotometer (UV-1800, Shimadzu, Japan).
Infrared spectroscopy
IR spectroscopy of Telmisartan, PEG 6000 and their solid dispersion was performed on Fourier transform infrared
spectroscopy (FTIR 8400S, Shimadzu, Japan). Drug, carrier and solid dispersion was mixed separately with KBr (95:5) and placed in to sample holder. The scanning range and resolution was 400-4000 cm-1 and 4 cm-1, respectively.
Differential scanning calorimetry (DSC)
Differential scanning calorimetry (DSC) measurements was performed for Telmisartan, PEG 6000 and its solid dispersion using DSC instrument (JADE DSC-6, PYRIS, USA) equipped with a liquid nitrogen sub ambient accessory. The instrument operated under nitrogen purge gas at a rate of 20 ml/min. Samples (3-6 mg) were weighed in open aluminium pans and scanned at a speed of 100C/min from
30-3000C.
Drug content analysis
Accurately weighed quantity of solid dispersion (theoretically equivalent to 10 mg of Telmisartan) was dissolved in small amount of ethanol and volume was made up to 10 ml with PBS (pH 6.8). The solution was sonicated for 5 min. Solution was filtered through whatman filter paper (#41). The sample was assayed by UV-spectrophotometer (UV-1800, Shimadzu, Japan) at 296 nm. Formulation of ODTs using Solid Dispersion
Solid dispersion of Telmisartan and PEG 6000 is compressed in to Orodispersible tablets. The TSD4 formulation containing 1:4 ratio is selected on the basis of solid dispersion characterization i.e. solubility, FTIR, DSC, and drug content for tablet preparation. Direct compression technique was utilized for the compression of solid dispersion of Telmisartan and PEG 6000 for the development of ODTs. All ingredients (solid dispersion equivalent to 20 mg Telmisartan and other excipients) were mixed properly and the blends were passed through sieve (# 40). The powder blend was compressed into tablets on a single punch tablet machine using round shape flat punch having diameter of 12 mm (Rolex machineries, Mumbai, India). The tablet weight was adjusted to 200 mg (Table 1). kyron T-314, croscarmellose sodium and Sodium starch glycolate used as disintegrating agent. While microcrystalline cellulose (MCC) used as diluents and magnesium stearate was used as lubricant.
Table 1: Composition of Various Orodispersible Tablets of Telmisartan S.
No. Ingredients (mg) Formulations TF1 TF2 TF3 TF4 TF5 TF6 TF7 TF8 TF9 1. Solid dispersion( Eq. to 20 mg
Telmisartan) 100 100 100 100 100 100 100 100 100
2. Kyron T-314 8 10 12 - - - -
3. Croscarmellose sodium - - - 8 10 12 - - -
4. Sodium starch glycolate - - - 8 10 12
5. Polyvinylpyrollidone (PVP) 10 10 10 10 10 10 10 10 10
6. Microcrystalline cellulose (MCC) 73 71 69 73 71 69 73 71 69
7. Magnesium stearate 4 4 4 4 4 4 4 4 4
8. Talc 5 5 5 5 5 5 5 5 5
Total weight 200 200 200 200 200 200 200 200 200
Evaluation of ODTs Micromeritic studies
The powder mixture of formulations was characterized for their micromeritic properties, such as bulk density, tapped
Bulk density, tapped density, % compreesibility index and hausner ratio were calculated using following formulae
Bulk density = W/V0, and Tapped density = W/Vf Where, W= Weight of the powder V0 = Initial volume, Vf =
final volume
Carr’s index (%) = [(TD-BD) × 100]/TD
Angle of repose of the powder was determined by the funnel method. It reflects the flow ability of a powder. The accurately weighed powder mixture of formulations was taken in the funnel. The height of the funnel was adjusted in such a way that the tip of funnel just touched the apex of the heap of the powder mixtures of formulations. The powder mixtures of formulations were allowed to flow through the funnel freely on to the surface. The diameter of the powder cone was measured and angle of repose was calculated using the following equation given below.
Tan θ = h/r
Where, h= Height of pile and r= Radius of the pile Thickness and hardness
The tablet thickness was measured using digital Vernier caliper. Hardness was determined by Monsanto hardness tester (Jyoti Scientific Laboratories, Gwalior).
Friability and weight variation
Friability test was carried out on 10 tablets. Initial weight of the tablets was measured and subsequently placed in chamber of friabilator (Roche friabilator) at 25 rpm speed for 4 min. After that tablets were de-dusted, reweighed and % friability was calculated. From each batch twenty tablets weight were noted using electronic balance. Their average weight (WA) was calculated. Percentage weight variation
and average weights of the tablets along with standard deviation values were calculated using formulae given below.
% Weight variation= (WA-WT)/WA Wetting time
Another important parameter is wetting time. Five circular tissue papers of 10 cm diameter were placed in a Petri dish of a 10 cm diameter. 10 ml of water containing eosin, a water- soluble dye, was added to Petri dish. A tablet was carefully placed on the surface of the tissue paper. The time required for water to reach upper surface of the tablet is noted as wetting time15.
Disintegration time
Disintegration test is determined using the USP device used to test disintegration comprises six glass tubes that are 3” long, open at the top, and held against 10” screen at the bottom end of the basket rack assembly. One tablet is placed in each tube and the basket rack is positioned in beaker containing 900 ml of PBS (pH 6.8) at 37±2°C, such that the tablets remain below the surface of the liquid on their upward movement and descend not closer than 2.5cm from the bottom of the beaker. The disintegration time was recorded at the point at which tablet completely disintegrated.
Drug content
Ten tablets were weighed and powdered. An amount of the powder equivalent to 10 mg of Telmisartan was dissolved
in 100 ml of pH (6.8) phosphate buffer, filtered, diluted suitably and analyzed for drug content at 296 nm using UV Visible spectrophotometer (UV-1800, Shimadzu, Japan) 16.
In vitro drug release study and Release kinetics In vitro drug release studies of all formulations were carried out using paddle type tablet dissolution test apparatus (USP XXII type) at 50 rpm. The dissolution media, phosphate buffer pH (6.8) was maintained at 37.0±0.50C. Samples were withdrawn at different intervals,
diluted suitably and analyzed at 296 nm for cumulative drug release using UV-Visible spectrophotometer (UV-1800, Shimadzu, Japan). The percentage of Telmisartan dissolved from tablet was calculated and the graph was plotted by time Vs % of drug dissolved16.
The in vitro drug release data is fitted to various release kinetic models like zero order, first order, Higuchi matrix, Hixson- crowell and KorseMeyer-Peppas kinetic model. The coefficient of correlation (R2) values were calculated
from the regression analysis of above plots. RESULTS AND DISCUSSION
Solubility study
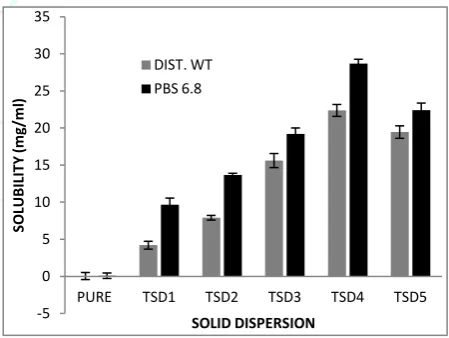
The solubility of pure drug in water was found to be 0.056 mg/ml which suggest that Telmisartan is practically insoluble in water, hence shows lower bioavailability. In present study solid dispersion of Telmisartan is prepared with PEG 6000 in ratios 1:1, 1:2, 1:3, 1:4, 1:5. The solubility of these dispersions were found 4.21, 7.91, 15.62, 22.38, 19.46 mg/ml and 9.65, 13.66, 19.21, 28.67, 22.42 mg/ml in distilled water and PBS (pH 6.8) respectively. Result suggests that solubility of Telmisartan is increased with respect to the concentration of PEG 6000 till 1:4 and it started decreasing thereafter.
Figure 1: Solubility profile of solid dispersion Infrared spectroscopy
The FTIR studies were carried out to investigate the possible interaction between the Telmisartan and PEG 6000 in the solid dispersion formulation. The FTIR spectra of pure drug, PEG 6000, and its solid dispersion shows no possible interaction between drug and carrier, which confirms the stability of drug in its solid dispersion. Solid dispersion brings characteristic change in the Telmisartan from crystalline to amorphous by dispersing in PEG 6000, which leads to solubility enhancement and improvements of flow properties.
-5 0 5 10 15 20 25 30 35
PURE TSD1 TSD2 TSD3 TSD4 TSD5
SO
LU
B
IL
ITY
(m
g/m
l)
SOLID DISPERSION
Figure 2: Fourier transform infrared (FTIR) spectra of Telmisartan, PEG 6000, and solid dispersion
Differential scanning calorimetry (DSC)
Differential scanning calorimetry (DSC) measurements was performed on Telmisartan, PEG 6000, and its solid dispersion using a DSC (JADE DSC-6, PYRIS, USA) to analyse the thermal behaviour. The DSC thermogram of Telmisartan exhibited (fig. 2) an endothermic peak at 2630C, which corresponds to the melting point of the
Telmisartan. The carrier PEG 6000 showed an endothermic peak at 63.060C, which corresponds to the melting point of
PEG 6000. There were only one endothermic peak observed for solid dispersion prepared using drug:carrier
1:4 at 58.060C. The disappearance of endothermic peak of
Drug content analysis
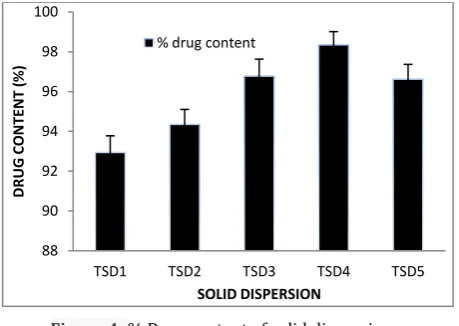
Percentage drug content of various solid dispersion formulations i.e. TSD1, TSD2, TSD3, TSD4, and TSD5 were found to be 92.94±0.48%, 94.35±0.57%, 96.78±0.78%, 98.34±0.76%, and 96.62±0.87% respectively. The percentage drug content found 100±5% for all solid dispersion formulations. It was graphically represented in fig. 4.
Figure 4: % Drug content of solid dispersion Formulation of ODTs using solid dispersion
From above study of solid dispersion preparation of Telmisartan with PEG 6000 it was found that solid
dispersion ratio TSD4 (1:4) has maximum solubility and drug content, is selected for further preparation of ODTs with addition of Superdisintegrants i.e. kyron T-314, croscarmellose sodium and sodium starch glycolate, taken in various ratios to find the optimum concentration of the Superdisintegrants required to yield formulation having least wetting time and disintegration time. Evaluation of ODTs
Micromeritic studies
Micromeritic properties of powder reflect the appropriateness of formulation. Hence, micromeritic properties of the drug excipients mixture were studied in term of bulk density, tapped density, car’s index and angle of repose to establish the flow property. The car’s index of all the formulations was found to be in the range from 15.15 % to 20.58%. The hausner’s ratio was found to be in the range from 1.17 to1.25 (i.e. less than 1.25) which indicates good flow properties. Angle of repose was found to be 25.76 to 30.21 degree (Table 2). The micromeritic properties of pure drug doesn’t show the free flow of powder for compression but when the solid dispersion of the Telmisartan is prepared with PEG 6000 and mixed with other excipients and evaluated for micromeritic properties shows free flow ability and compressibility for direct compression. PEG 6000 alters the particle size and shape of drug particles from crystalline to spherical resulting in enhancement of flow ability and compressibility.
Table 2: Micromeritic Studies of Various Powder Blend Formulations
Batch Angle of repose Bulk density Tapped density %Compressibility Hausner ratio
TF1 26.99±1.71 0.54±0.06 0.68±0.07 20.58±1.10 1.25±0.01
TF2 26.23±1.50 0.54±0.02 0.65±0.02 16.92±0.41 1.20±0.03
TF3 25.76±0.22 0.56±0.06 0.67±0.05 16.41±1.20 1.19±0.08
TF4 27.06±1.71 0.54±0.04 0.67±0.04 19.40±1.31 1.24±0.08
TF5 28.91±0.20 0.57±0.09 0.69±0.07 17.39±0.98 1.21±0.02
TF6 30.21±0.01 0.50±0.04 0.62±0.03 19.35±1.24 1.24±0.07
TF7 30.05±0.98 0.51±0.01 0.62±0.01 17.74±0.71 1.21±0.09
TF8 29.53±0.21 0.56±0.04 0.66±0.06 15.15±0.23 1.17±0.02
TF9 29.21±0.56 0.50±0.02 0.61±0.09 18.03±0.28 1.22±0.07
Values are expressed as mean ± S.D., n=3 Thickness and hardness
All the prepared tablets are characterized by their size and shape, which found round shape and uniform thickness in the range of 3.36 to 3.85 mm. The hardness of formulations was found within the range of 4.12 to 4.48 kg/cm2.
Friability and weight variation
Friability for all formulations was found to be less than 1%. This is the acceptable limit. The result shows resistance to loss of weight indicated the tablet ability to withstand abrasion in handling, packaging and shipment.
The weight variation of tablets was determined according to the specification in USP and all the tablets were found to comply with specification. Weight of the tablets was found in the range of (±5%) variation.
Wetting time
Wetting time for ODTs depends on the concentration of Superdisintegrants. We have used three types of Superdisintegrants i.e. kyron T-314, croscarmellose
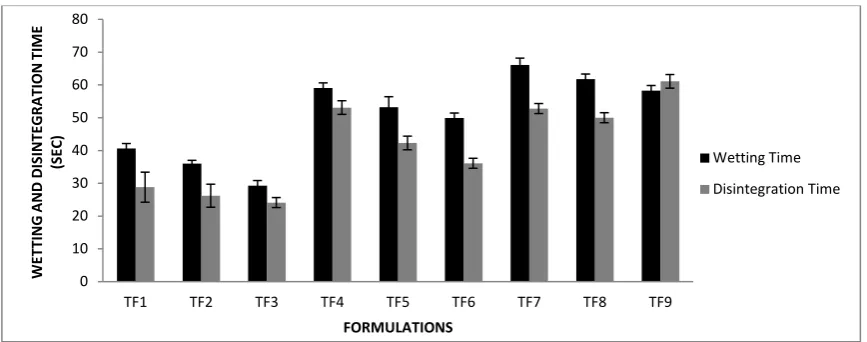
sodium and sodium starch glycolate in the concentration range of 4% to 6%. The wetting time for all formulations was 40.6 to 29.3 sec for kyron T-314 containing formulation, 59.1 to 49.9 sec for croscarmellose sodium containing formulation, and 66.1 to 58.3 sec for sodium starch glycolate containing formulation. The least wetting time amongst all formulation is found with TF3 formulation which contains 6% kyron T-314. Kyron T-314 is a crosslinked polymer of Polycarboxylic acidsbreaks the tablets into very smaller particles, thus it increases the effective surface area for the absorption of the active substances and ultimately it increases the dissolution and bioavailability of the active substances. Its 4.0% to 6.0% quantity is sufficient for dissolution improvement and suitable for direct compression. It also provide smooth cream-like mouth feel, so more suitable for ODTs. All the results of wetting time of all formulations are shown in table 3. This has a very high swelling tendency of hydration either in contact with water or G.I. fluids causing very fast wetting of the tablets.
88 90 92 94 96 98 100
TSD1 TSD2 TSD3 TSD4 TSD5
D
R
U
G
C
O
NT
ENT
(%
)
SOLID DISPERSION
Figure 5: Wetting and disintegration time of various Orodispersible tablets prepared
Disintegration time
Another fact for ODTs which is much more important is disintegration time of the tablets. According to European pharmacopoeia ODTs required less than 3 minute in disintegration. In the present study, all the tablets disintegrated in approximately in 1 minute. Disintegration time for all formulations was found between 28.8 to 24.1 sec for kyron T-314 containing formulation, 52.8 to 61.1 sec for croscarmellose sodium containing formulation, and
56.3 to 38.3 sec for sodium starch glycolate containing formulation (Table 3). In amongst all Superdisintegrants kyron T-314 show faster disintegration time for tablets (for TF3 24.1 sec) this is because it has a very high swelling tendency of hydration either in contact with water or G.I. fluids causing fast disintegration without the formation of lumps and thus acts as an effective tablet Superdisintegrant. The porous structure of the tablets is responsible for faster water uptake resulting in fast disintegration.
Table 3: Evaluation Parameters of Various Orodispersible Tablets
Batch Friability (%) Wetting time(sec) Disintegration time (sec) %Drug content
TF1 0.82±0.67 40.6±2.22 28.8±1.89 96.82±0.51
TF2 0.62±0.68 36.0±3.30 26.2±1.90 98.21±0.78
TF3 0.52±0.94 29.3±1.01 24.1±0.90 99.67±0.27
TF4 0.69±0.21 59.1±1.02 53.1±1.22 97.61±0.82
TF5 0.83±0.73 53.2±0.08 42.3±2.22 95.61±0.10
TF6 0.69±0.83 49.9±.62 36.1±0.45 98.24±0.36
TF7 0.72±0.93 66.1±1.78 52.8±0.34 96.45±0.92
TF8 0.66±0.41 61.8±0.51 50.0±1.41 97.81±0.30
TF9 0.59±0.01 58.3±0.22 61.1±1.92 96.67±0.60
Values are expressed as mean ± S.D., n=3
Drug content
Percentage drug content for various formulations i.e. TF1, TF2, TF3, TF4, TF5, TF6, TF7, TF8, TF9 were found to be 96.82%, 98.21%, 99.67%, 97.61%, 95.61%, 98.24%,
96.45%, 97.81%, 96.67% respectively. The percentage drug content was found to be in the USP limits for all formulations. The % drug content for all formulations is represented in table 3.
0 10 20 30 40 50 60 70 80
TF1 TF2 TF3 TF4 TF5 TF6 TF7 TF8 TF9
W
ETT
ING
A
ND
D
IS
INT
EG
R
A
TIO
N
TIM
E
(S
EC
)
FORMULATIONS
Wetting Time Disintegration Time
93 94 95 96 97 98 99 100 101
TF1 TF2 TF3 TF4 TF5 TF6 TF7 TF8 TF9
%
D
R
U
G
C
O
NT
ENT
FORMULATION
In vitro drug release study
The release characteristics of ODTs was studied using tablet dissolution test apparatus is paddle type (USP XXII type) at 50 rpm. 900 ml of Phosphate buffer pH (6.8) was used as the dissolution media at 37.0±20C. The cumulative
percentage drug release of formulations i.e. TF1, TF2, TF3,
TF4, TF5, TF6, TF7, TF8, TF9 were 97.72%, 96.92%, 99.93%, 95.82%, 92.87%, 89.01%, 90.56%, 93.81%, 95.28% respectively in 30 minute. All the results of Cumulative percentage drug release of all formulations graphically represented in fig. 7. Formulation TF3 containing kyron T-314 shows better drug release profile 99.93%.
Figure 7: Cumulative % drug releases of different formulations
The in-vitro drug release profile of various optimized formulations were studied for release kinectics with respect to zero order, first order, Higuchi, Hixson crowell and Korsemeyer-peppas model (Table 4). The R2 for
various kinetics models for optimized formulation TF3 was found 0.999, 0.654, 0.988, 0.972, 0.968 respectively which is closer to one, partially for Zero order model is very close to one. The diffusional exponent, n characterizes the
mechanism of drug release. It is known that for non-swelling tablets, the drug release can generally be expressed by the Fickian diffusion mechanism, for which n = 0.5. For non-Fickian release, the n value falls between 0.5 and 1.0 [0.5 < n < 1.0]; whereas in the case super case II transport n >1. The value of n for all formulations is in the range from 0.151 to 0.516. Which conclude that all formulation follow fickian diffusion mechanism.
Figure 8: Zero order Release kinetics of various solid dispersion formulations TABLE 4: Release Kinetics of Various Orodispersible Tablets Formu-
lations Zero order First order Higuchi kinetic Hixson-Crowell kinetic Korse Meyer-Peppas kinetic
R2 R2 R2 R2 R2 n
TF1 0.587 0.885 0.698 0.777 0.778 0.151
TF2 0.956 0.959 0.991 0.991 0.997 0.121
TF3 0.923 0.930 0.974 0.986 0.992 0.105
TF4 0.971 0.918 0.969 0.967 0.947 0.124
TF5 0.983 0.954 0.987 0.977 0.989 0.242
TF6 0.978 0.938 0.975 0.963 0.987 0.516
TF7 0.945 0.992 0.978 0.984 0.980 0.492
TF8 0.973 0.928 0.979 0.968 0.978 0.412
TF9 0.999 0.654 0.988 0.972 0.968 0.136
0 20 40 60 80 100 120
0 5 10 15 20 25 30 35
%
C
U
M
U
LA
TIV
E
D
R
U
G
R
EL
EA
SE
TIME (MIN)
TF1 TF2 TF3 TF4 TF5 TF6 TF7 TF8 TF9
R² = 0.587 R² = 0.956 R² = 0.923 R² = 0.971 R² = 0.983 R² = 0.978 R² = 0.945 R² = 0.973 R² = 0.999
0 20 40 60 80 100 120
0 5 10 15 20 25 30 35
C
U
M
U
LA
TIV
E
% DRU
G
R
EL
EA
SE
TIME (MIN)
CONCLUSION
The method utilized for the preparation of ODTs was simple and reproducible. ODTs of Telmisartan prepared with addition of solid dispersion technique by solvent evaporation method with PEG 6000 and Superdisintegrants like kyron T-314, croscarmellose sodium and sodium starch glycolate. Formulation containing 6% of Kyron T-314 shows least wetting time and disintegration time. Which indicates that kyron T-314 is suitable disintegrant for ODTs.
The results of the study establish the Telmisartan ODTs as a potential drug delivery system for effective management of hypertension with improved patient compliance. CONFLICT OF INTEREST
The authors confirm that this article content has no conflict of interest.
REFERENCES
1. Tyagi R, Dhillon V, Solid dispersion: a fruitful approach for improving the solubility and dissolution rate of poorly soluble drugs, Journal of Drug Delivery and Therapeutics, 2012; 2(4):5-14.
2. Deshmukh KR, Jain SK, Development of aceclofenac mouth dissolving tablets using solid dispersion technique: in-vitro evaluation, Indian Journal of Pharmaceutical Education and Research, 2012; 46(2):97-104.
3. Ali A, Sharma SN, Preparation and evaluation of solid dispersions of ibuprofen, Indian Journal of Pharmaceutical Sciences, 1991; 53(6):233-236.
4. Rao KRSS, Nagabhushanam MV, Chowdary KPR, In vitro dissolution studies on solid dispersion of mefanamic acid, Indian Journal of Pharmaceutical Sciences, 2011; 73(1):243-247.
5. Chaulang G, Patel P, Hardikar S, Kelkar M, Bhosale A, Bhise S, Formulation and evaluation of solid dispersions of
furosemide in sodium starch glycolate, Tropical Journal of Pharmaceutical Research, 2009; 8(1):43-51.
6. Kausalya J, Suresh K, Padmapriya S, Solubility and dissolution enhancement profile of telmisartan using various techniques, International Journal of Pharm Tech Research 2011; 3(3):1737-1749.
7. Lindgren S, Janzon L, Dysphagia: prevalence of swallowing complaints and clinical finding, Medical Clincs of North America, 1993; 77:3–5.
8. Habibh, W, Khankarik, R, Hontz, J, Fast-dissolve drug delivery system, Critical Reviews in Therapeutic Drug Carrier Systems, 2000; 17(3):61–72.
9. Douroumis D, Practical approaches of taste masking technologies in oral solid forms, Expert Opinion on Drug Delivery, 2007; 4:417–426.
10. Akiladevi D, Shanmugapandiyan P, Jebasingh D, Basak A, Preparation and evaluation of paracetamol by solid dispersion technique, Indian Journal of Pharmaceutical Sciences, 2011; 3(1):188-191.
11. Prajapati ST, Gohel MC, Patel LD, Studies to enhance dissolution properties of carbamazepine, Indian Journal of Pharmaceutical Sciences, 2007; 69(3):427-430.
12. Divya B, Sabitha P, Reddy R, Reddy MKK, Rao BN, An approach to enhance solubility of gatifloxacin by solid dispersion technique, Asian Journal of Research in Pharmaceutical Sciences, 2012; 2(2):58-61.
13. Sethia, S, Squillante, E, Physicochemical characterization of solid dispersions of carbamazepine formulated by supercritical carbon dioxide and conventional solvent evaporation method, Journal of Pharmaceutical Sciences, 2002; 91:1948–1957.
14. Lachman L, Herbert AL, Joseph LK. The theory and practice of industrial pharmacy. Bombay: Varghese publishing house; 2008. P. 430-455.
15. Gohel M, Patel M, Amin A, Agrawal A. Dave R, Bariya N, Formulation Design and Optimization of Mouth Dissolve Tablets of Nimesulide Using Vacuum Drying Technique, AAPS Pharm Sci Tech, 2004; 5(3):1-6.