Experimental Study on the Effectiveness of a Teaching
Approach Using Barker or Bachman Notation for
Conceptual Database Design
Aida Kamiˇsali´c1, Marjan Heriˇcko1, Tatjana Welzer1, and Muhamed Turkanovi´c1
University of Maribor,
Faculty of Electrical Engineering and Computer Science, Koroˇska cesta 46, 2000 Maribor, Slovenia
{aida.kamisalic, marjan.hericko, tatjana.welzer, muhamed.turkanovic}@um.si
Abstract. Relational databases are one of the pillars of information systems and as a consequence conceptual and logical design can be seen as the foundation of almost every application regardless of the platform. Nevertheless, little research has been done so far on the effectiveness of teaching approaches to database basic concepts and design. This paper introduces a multi-level experimental study developed to examine the effectiveness of learning database fundamentals, depending on the no-tation used for conceptual design. The main experiment was carried out at a higher education institution. We developed different experimental instruments to evalu-ate the effectiveness of a teaching approach using Barker or Bachman notation for conceptual database design. In contrast to Barker notation, Bachman notation incor-porates elements of logical design (i.e. foreign keys) in the conceptual design level. Students’ achievements were examined with regard to influencing factors through-out the learning process. Introducing the Bachman notation and a manual transfor-mation from a conceptual into a logical data model, could increase students’ under-standing of conceptual, logical and relational data model concepts. We found that the notation used during the learning process has an impact on students’ achieve-ments. Moreover, students achieved better results when solving tasks presented with a notation that incorporates elements of logical design into the conceptual level. Fi-nally, we required the use of manual transformation from a conceptual into a logical data model and the results confirmed an increase in students’ understanding.
Keywords:entity relationship models, modeling notations, conceptual design, log-ical design, foreign key, database design learning, Barker, Bachman
1.
Introduction
Relational databases represent a foundation for many applications. It is impossible to imagine the digital world without them. According to the rankings provided by the
DB-engines web page1 in May 2018, relational databases occupy the top four positions
ac-cording to their popularity. The Association for Computing Machinery (ACM) curricu-lum committee publishes recommendations on the content of model curricula for com-puter science and informatics disciplines. They provide curriculum guidelines for five defined sub-disciplines: Computer engineering, Computer science, Information systems,
Information technology and Software engineering. All provided guidelines recommend at least one and often several database courses at all study levels [1,2,3,24,34]. The intro-duction to database course is one of the essentials of computer science and/or informatics higher education programs. The basic topics on databases are mostly covered in a single semester course. These courses typically comprise data requirements elicitation, concep-tual database design, normalization, logical database design, and physical database design [10,14,17,25]. Since databases represent an important segment of computer science and information systems, it is important to adequately address different issues related to teach-ing approaches of database fundamentals. There is much research addressteach-ing issues re-lated to teaching computer science and informatics disciplines including various aspects of databases [5,9,10,13,16,17,21,22,25,29,30,31,35], but little research so far has dealt with the effectiveness of teaching approaches to database design (conceptual and logical modeling) [4,7,15,26].
There are different teaching approaches for the fundamentals of databases. The first approach starts the database design with conceptual modeling, followed by logical mod-eling. The second approach starts by combining conceptual and logical modeling, thus introducing elements of a logical model into the conceptual model. The first approach has been applied for many years at our institution as well.
Over the years we have encountered various issues (e.g. the correlation between the relationship of an E-R model and the foreign key of a logical model) for understanding es-sential database concepts among students. In order to evaluate identified issues and detect if there is a relationship between different study settings, we designed a multi-level study that consisted of two pre-experiments and one main experiment. The first pre-experiment was carried out at two secondary education institutions, which was viable since in Slove-nia database related subjects are included in the curricula of some secondary education institutions. The second pre-experiment as well as the main experiment were conducted in higher education institutions. Different experimental instruments (questionnaire, quiz, test and exam) were developed in order to evaluate students’ work and learning progress. Our research addresses various issues of learning fundamental concepts of database design considering notation used for conceptual design. We have studied the influence of notation used for conceptual design on learning outcome. The structure of the paper is as follows. Continuation of the current section presents in detail the motivation, aim of the study and methodological framework with research questions. In Section 2, related work is summarized. Preliminaries are provided in Section 3. The main contribution of the paper is presented in Sections 4 and 5 where the experiments, results and discussion are described in detail. Research limitations are provided in Section 6. Finally, the conclusions are presented in Section 7.
1.1. Motivation
translated to the querying of a database. In order to detect issues related to the under-standing of database fundamental concepts, individual interviews were carried out with current and former colleagues who are and were involved in the database teaching process or involved in a teaching process which incorporated databases. The results of provided interviews indicated that issues related to the understanding of database design essentials are directly influencing students’ capabilities in applying knowledge on databases in their further studies.
1.2. Aim of the study
We argue that a good conceptual model is important and represents an essential part of a database design. It contributes to the better understanding of the modeled system, facil-itates communication between users and developers, while also avoiding the burdening the students and laymen with additional information such as data types. Nevertheless, we also argue that adding foreign keys into the model as soon as possible, can facilitate the learning process of students and future developers.
We designed the experimental study on learning database concepts (i.e. conceptual, logical and relational data model concepts - hereinafter CLR concepts) in order to detect: (1) whether the used notation for conceptual design influences a student’s understanding and acceptance of database fundamental concepts, and (2) which notation for conceptual database design is more intuitive, while investigating which notation students achieve better results with and therefore show a better understanding of the evaluated concepts. Therefore we will be able to detect the teaching approach that leads towards a faster and better understanding of foreign key concepts, connecting tables and consequently writing queries.
1.3. Methodological framework
A multi-level experiment was designed to investigate the effects of the independent vari-able (notation used during laboratory work) on the dependent varivari-able, i.e. students’ un-derstanding of CLR concepts. The independent variable was the controlled usage of nota-tion during conceptual design. The dependent variable is observed in the form of assessed test scores from the experimental instruments (see Section 4.2). Furthermore, there were several controlled variables such as the database management system (hereinafter DBMS) used during the experiment, execution time and place of experimental instruments, task assessor and same teachers throughout entire experiment execution. The study is primarily quantitative research which reaches generalizations and conclusions based on statistical projections. Some of the analysis was performed by summing up the results of various experimental instruments, hence the main experiment allowed us to assess the effects over a period of time. A detailed overview of the experimental framework is presented in Section 4.
While designing the experiment we focused on some key elements (independent vari-able), thus forming two research questions, which were later on addressed and answered in the paper. The research questions are as follows:
Research Question 2 (RQ2) Does the manual transformation from conceptual into the logical data model contribute to students’ understanding of conceptual, logical and rela-tional data model concepts?
2.
Related work
Chan et al. in [7] presented a study to detect which interaction was easier for the user -using the E-R model or relational data model. Higher education students were the target group of the study. The results indicated that the E-R model achieved better accuracy, higher confidence and for its users took significantly less time than the time taken by users of the relational model.
An experimental methodology to determine which of two complete notations is easier to comprehend was proposed by Purchase et al. in [26]. They applied the methodology in [8] and SSADM notation (Structured systems analysis and design method) to indicate whether a supplied textual specification of objects and relationships matched Chen and SSADM E-R diagrams [36]. They were evaluating the results obtained from higher edu-cation students. The experiment was not a part of the learning process. The students got a limited amount of time (15 minutes) to study the prepared materials on both notations as well as textual specifications of the case study used in the experiment. The results indi-cated that SSADM notation provides an overall better understanding and performance as well as higher preference.
Thompson et al. in [33] proposed a new notation for E-R modeling and used it to facil-itate the process of teaching database design for graduate students. Their notation adapted many features from the Unified Modeling Language (UML) class diagram notation. In or-der to teach students logical database design the authors proposed an eight-page process where table representation and normalization processes are broken down into eight steps. The proposed notation and processes were used over several semesters with favorable students responses.
An experimental comparison of E-R and UML class diagrams for data modeling was presented by De Lucia et al. in [15]. They presented the results of three sets of controlled experiments. The main objective was to analyze whether UML class diagrams are more comprehensible than E-R diagrams. They considered the support given by the two no-tations in the comprehension and interpretation of data models, comprehension of the change needed to perform to meet a change request, and detection of defects contained in a data model. The experiments involved university students with different levels of ability and experience. Both notations were evaluated on the same group of students, which lim-ited the learning effect. The results indicated that the students using UML class diagrams achieved better comprehension levels. Both notations provide the same support during maintenance activities but UML class diagrams provide better support during verification activities.
di-agrams. Also UML class diagrams provide a better support during verification activities, while both notations give the same support during maintenance activities.
Sanchez et al. in [28] argue that system comprehension is easier when models are used to reduce its complexity. Thus, the learning process should be based on models. They presented a study on two empirical experiments about whether students understand E-R models better than SQL code. The results indicated better performance of E-R models, when the time to reason is shorter. Additionally, the capacity to reason on E-R models remains longer than the one in SQL code. They concluded that models should have a key role in computer science education, which would make the learning process easier.
Fessakis et al. in [18] presented a study on improving database design teaching in sec-ondary education. They designed and implemented educational action research in order to identify learning problems and to improve database design instruction. One of their proposals includes the usage of a didactically proper conceptual data model instead of the traditional E-R models. According to Fessakis et al. a didactically proper conceptual model permits: (1) the automatic transformation from a conceptual to a relational model and vice versa, (2) the use of binary relationships without attributes and (3) the explicit representation of foreign keys in a conceptual design that would reduce the problem of a foreign key definition to a decision of an adequate relationship selection.
A comparative analysis of E-R diagrams was presented by Song in [32]. They com-pared ten different notations and detected seven features which differentiate notations. The comparison was based on the differentiation of compared notations considering de-tected features. The observed features are: allowing n-ary relationships, allowing attributes in a relationship, representing cardinality and participation constraints, placing specified constraints, depicting overlapping and disjoint subclass entity-types, showing total/partial specialization and explicitly modeling foreign keys. They concluded that the notations which do not explicitly model foreign keys at the conceptual design need an extra step to convert an E-R diagram to the relational data model. Design tools supporting data mod-eling still lack the ability to check the correctness of the produced E-R diagrams. It relies on the data modeler’s knowledge.
Hay in [19] compared six different notations. The evaluation was based on technical completeness and its readability in terms of five features (entities and attributes, rela-tionships, unique identifiers, sub-types and super-types, and constraints between relation-ships). The provided comparison concluded that the ideal design tool would be the one that supports Barker notation for performing requirements analysis, has facilities for con-verting entity definitions into table definitions or class definitions, and has the ability to represent design constructs in UML for further refinement. A comparative analyzes of E-R diagrams was provided in [19] and [32] but did not include experiments to evaluate the effects of different notations on study outcomes.
As a possible teaching approach to database concepts, one could use intelligent tutor-ing systems and interactive learntutor-ing environments such as [9,11,12,23,29,30], but since the aim of our study is to analyze learning outcomes for basic CLR concepts when using different notations, we did not elaborate on these approaches in detail.
and design [11]. Rantanen et al. [27] found that the organizations consider database design to be the primary skill lacking among new IT graduates and current IT staff.
Our research addresses different issues of learning fundamental concepts of database design considering influencing factors such as notation used for conceptual design. The only work that provided an experimental study comparing two E-R notations was pub-lished in [26] by Purchase et al. They proposed a methodology to determine which nota-tion (Chen or SSADM) is easier to comprehend based on the request to indicate whether a supplied textual specification of objects and relationships matched Chen and SSADM E-R diagrams. Their experiment was not a part of the learning process. On the contrary, we compared two E-R notations (Bachman and Barker, see section 3.2) to evaluate learning effects on students’ understanding of CLR concepts through the entire learning process (i.e. the Databases I course).
3.
Preliminaries
3.1. Database modeling elements
Information system development starts with conceptual modeling in order to describe the functionality of the system based on real-world concepts and their relationships. It contributes to the better understanding of the modeled system and facilitates communi-cation between developers and users - different interest groups. The development further continues by specifying system properties and transferring real-world concepts into the requirement, architecture and implementation level concepts [20]. Databases represent an important segment for any information system development. Here the conceptual model represents concepts from the natural application environment - the way the users perceive data. An evolution of the conceptual model, where the requirements are taken into ac-count, is represented with a logical model - database modeler-oriented view of system usage. Moving from an abstract data model (higher-level conceptual model) to the im-plementation of the database is enabled by mappings from the conceptual model to the logical and physical model, where the physical model represents the DBMS-oriented view [6].
The important mechanism for conceptual database design is the Entity-Relationship (hereinafter E-R) model which was first introduced by Chen [8]. The E-R model uses a
collection of basic objects, calledentities, andrelationshipsbetween these objects.
Enti-ties are described by a set ofattributes. The E-R model also represents certain constraints,
3.2. Notations
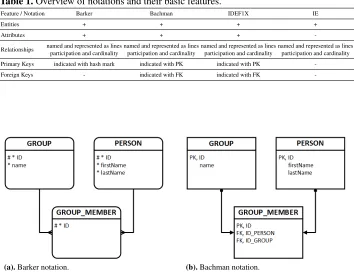
E-R diagrams can be presented with many different notations. Sometimes different names are associated with the same notation, which can lead to a misconception of notations. Nowadays, commonly used notations are Bachman, Barker, Information Engineering (IE) (originally James Martin notation), Crow’s foot and IDEF1X [19], [32]. There are differ-ent variations of listed notations, which are observed in differdiffer-ent design tools. For exam-ple, IE notation does not provide the means to represent attributes, data types or foreign keys, but Oracle modified this notation to also capture those features. Here we will give a short description for each of these notations referring only to the basic features they manage to represent, i.e. entities, attributes, relationships (their cardinality/participation), unique identifiers and foreign keys. Crow’s foot notation has been enriched to obtain Barker, IDEF1X and IE notations. The summary of described notations and their features is presented in Table 1, where + indicates presence of a specific feature while - indicates its absence.
Barker’s notation represents entities, attributes, relationships and unique identifiers. At-tributes have an indicator of optionality. Relationships are named and represented as lines. Participation is represented with solid (mandatory) and dashed (optional) lines, while us-ing a crow’s foot to represent cardinality ’up to many’. A hash mark is used to indicate the unique identifier [19].
IDEF1X is a complex notation, created for physical database design. It provides the means to represent entities, attributes, relationships, unique identifiers and foreign keys. It presents named relationships as lines and offers a complex way of describing car-dinality and participation, where a set of symbols describe a combination of the op-tional/mandatory participation and cardinality [19,32].
IE notation represents entities and relationships. Attributes are represented in a separate list (not as a part of a model). Relationships are presented as lines where a crow’s foot is used to represent ’up to many’ cardinality and a single line is used for ’one’ cardinality [19,32].
Bachman’s notation represents entities, attributes, relationships, unique identifiers and foreign keys. It presents the named relationships as lines where an arrow is used to ex-press ’up to many’ cardinality, while a single line is used for ’one’ cardinality. Optional participation is marked with an open circle while a filled-in circle is used for mandatory participation [32].
Table 1.Overview of notations and their basic features.
Feature / Notation Barker Bachman IDEF1X IE
Entities + + + +
Attributes + + +
-Relationships named and represented as lines participation and cardinality
named and represented as lines participation and cardinality
named and represented as lines participation and cardinality
named and represented as lines participation and cardinality
Primary Keys indicated with hash mark indicated with PK indicated with PK
-Foreign Keys - indicated with FK indicated with FK
-(a).Barker notation. (b).Bachman notation.
Fig. 1.E-R model presented with Barker and Bachman notations.
4.
Experimental framework
This section describes in detail the methodology of the experimental study. The experi-mental framework was divided into three parts, whereby the first two were pre-experiments and the third was the main experiment. The latter is our primary research study experi-ment.
The focus of each experimental part was on the evaluation of students’ laboratory work. Students from each experimental part were randomly split into two approximately equal size groups. Both groups worked on the same database modeling tasks, using the Oracle SQL Developer Data Modeler design tool. One of the groups used Bachman no-tation which explicitly includes the foreign key in the E-R diagram, while another group used the Barker notation, which does not explicitly include the foreign key in the E-R diagram [19].
The first pre-experiment was conducted at two secondary education institutions. More precisely: two general grammar schools were chosen, where only basic computer science and informatics courses take place for one year. Totally 53 students participated. Both groups consisted of male and female students, aged 16. The second pre-experiment was carried on a group of first year students of a higher vocational college, aged 19 - 41. The group consisted of 25 students (24 male and 1 female).
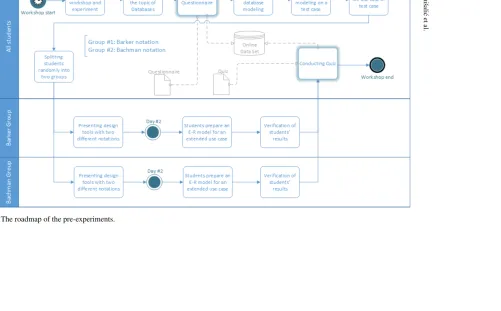
The pre-experiments were organized as four-hour workshops. These workshops cov-ered only the topic of Database conceptual modeling. The students were not presented with any information about notations used, nor was any theoretical lecture given about modeling notations. The roadmap of the pre-experiments is depicted in Figure 2 with the BPMN diagrammatic representation. Before the start of any content-related work, the stu-dents filled out a questionnaire (see Section 4.2). After finishing the task of modeling the complex database use case, the students were asked to take part in an online quiz (see Section 4.2).
4.1. Main experiment
The focus of our experimental study was the main experiment, carried out at the Faculty of Electrical Engineering and Computer Science at the University of Maribor. The experi-ment was performed during the academic year 2016/2017, throughout the second semester of the first year, the first cycle Bologna academic-degree study programs on Computer Science and Informatics: Computer Science and Information Technologies (CSIT) and Informatics and Technologies of Communication (ITC). The experiment was performed within the Database I course. It is a single semester course that includes 45 hours of the-ory/practice lectures (hereinafter lectures) and 30 hours of laboratory work in the form of computer exercises (hereinafter laboratory work). The course comprises data require-ments elicitation, conceptual database design, normalization, logical database design, and physical database design. The course format and the experimental execution are presented in detail in the following subsections.
Course format Lectures were conducted twice a week, three to five hours per week, in an auditorium (lecture room) for all students at once. The lectures were split into 30 hours of theory lectures and 15 hours of exercise lectures. Attendance was not obligatory.
For the purpose of laboratory work, the students were split into groups. Each group consisted of approximately 15 randomly assigned students of the same program. The laboratory work was carried out once a week, with a three-hour computer exercises per week. One laboratory work was performed with two teachers and two student groups at once in a computer room for 30 students.
The laboratory work consisted of five tasks, whereby the first four were content tasks and the last is a project finalization task (i.e. Conceptual modeling, Relational database model & SQL Data Definition Language (DDL), SQL Data Manipulation Language (DML), SQL Transaction Control Language (TCL) & Triggers, and Project finalization). For the laboratory work, a project-based teaching approach implemented in an individual context was chosen.
uniquely prepared project descriptions. The projects were assigned randomly but uniquely throughout two student groups.
A detailed overview of the experimental format is presented in the following section. In order to successfully complete the course, the students had to have at least 80% atten-dance at the laboratory work, successfully present their laboratory work deliverables and positively pass a written exam.
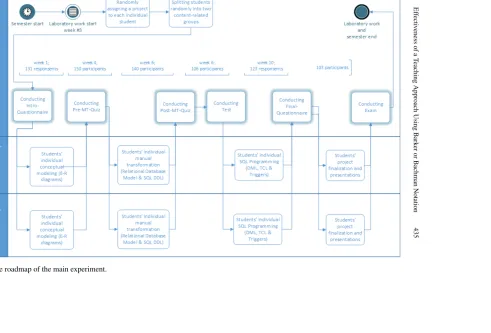
Experiment format The main experiment encompassed experimental tasks being exe-cuted with actively participating students during the lectures and laboratory work. The roadmap of the experiment and the course of the laboratory work is depicted in Figure 3 with the BPMN diagrammatic representation.
At the beginning of the course, 210 students were enrolled, but only 160 of them were actively involved during the course execution. Before the start of the laboratory work, half of the groups were assigned the Barker notation and another half with the Bachman notation. Students had to use the assigned notation throughout the laboratory work. Before the start of any content-related work, the students filled out the Intro-Questionnaire (see Section 4.2). The purpose of this questionnaire was to examine students’ overall initial knowledge and skills related to database design.
Afterwards, students started with individual conceptual modeling using the E-R dia-gram and their assigned notation. Each student had to model his/her own solution for the randomly assigned project (database requirement).
During the first three weeks, while conducting conceptual E-R diagram modeling, no information about the elements of the logical model, specifically on a foreign key (hereinafter FK) was given to the students. Nevertheless, it should be noted, that half of the students, while using the Bachman notation, got a glimpse into elements of the logical model (FKs).
After the conceptual modeling task, the students had to perform a manual transforma-tion of their conceptual model into a relatransforma-tional database model (schema), using the SQL Data Definition Language (SQL DDL). A manual transformation was chosen in order for students to learn and practice SQL DDL.
In order to correctly execute a manual transformation, comprehensive knowledge about the logical model and its elements is needed, e.g. FKs and data types. Thus, prior to the start of the second laboratory task, i.e. Relational database model & SQL Data Defini-tion Language (DDL), and prior to presenting the students with the needed knowledge for the successful execution of the second task, a quiz was conducted. We will refer to this particular quiz execution as the Pre-MT-Quiz (pre-manual-transformation-quiz). The quiz is explained in detail in Section 4.2. The quiz contained eight test questions on the topic of conceptual modeling (E-R diagram), whereby four were based on the Bachman notation and four on the Barker notation. The quiz was the same for all students who participated. Quiz participation was optional. The purpose of the Pre-MT-Quiz was to examine if there was any correlation between student’s understanding (score) of the CLR concepts, and notations used during conceptual modeling.
on student’s understanding of CLR concepts and if there is a correlation between their understanding (score) and the notations used while performing conceptual modeling. With the possibility of optional participation, 150 out of 160 students participated in the Pre-MT-Quiz and 140 in the Post-Pre-MT-Quiz.
After conducting the Post-MT-Quiz, students were given an additional test. They were asked to convert the relational data model into a conceptual model using the E-R diagram and vice versa. This test (forward and reverse engineering) is explained in detail in Sec-tion 4.2. The results of the test were added to the analyzed results of the experiment. It should be noted that the test was performed after completing the second task, thus after the students had performed a transformation of their own solution for the assigned project. Since the test participation was optional, only 106 students participated.
Next, students continued with task three and four of the laboratory work program, i.e. SQL querying, and preparing transactions and triggers. The project description that each student was assigned had a list of six questions, which had to be answered with SQL DML. Thus, each student had to answer unique questions related to the assigned project during their laboratory work, using their own prepared and generated database.
Prior to the end of the laboratory work, an anonymous questionnaire was given to all participating students (Final-Questionnaire). The questionnaire is explained in detail in Section 4.2. The purpose of the Final-Questionnaire was to examine if there is any corre-lation between the notation used during the laboratory work and students’ actual knowl-edge (score). Since the participation was optional, 123 students participated. Finally, after students’ project finalization and presentation, the laboratory work, the lectures, and the main experiment ended. The students were then called upon to take the exam.
4.2. Experimental instruments
In this section, a detailed presentation of the experimental instruments is given. First quiz and questionnaire are introduced. As a part of the experimental study they were used during both pre-experiments and during the main experiment (see Figure 2 and Figure 3). Afterwards test and exam are presented, as they only form a part of the main experiment. Each task per instrument was evaluated by the same teacher, ensuring the fairness of the tests assessment.
A copy of all experimental instruments is available in the supplementary materials provided on the web (see appendix A for a link).
Quiz During the main experiment the quiz was conducted twice (Pre-MT-Quiz and
Although there were eight tasks, only four distinct E-R diagrams were present, since each one was related to two tasks, one with the correct tabular representation of the re-lational model and one with the incorrect form. Therefore, each task had a correct E-R diagram with a possibly correct or incorrect tabular representation.
The purpose of the quiz (Pre-MT-Quiz) was to examine if there was any correlation between the student’s understanding of CLR concepts (test score) and notations used during the laboratory work.
Furthermore, while introducing the Post-MT-Quiz (see Figure 3), we wanted to eval-uate if the manual transformation from the conceptual model to the relational data model, using SQL DDL, has an impact on students’ understanding. In order to analyze the results of the quizzes, each task was evaluated with one point. Thus, eight points could be scored in total.
Questionnaire During the main experiment, the questionnaire was carried out twice (Intro- and Final-Questionnaire). The participation was optional. The questionnaire was split into two parts. The first part consisted of mainly closed-ended questions related to basic demographic information, database design tools and notation used during the labo-ratory work. The second part included open-ended questions, given in the form of a short test. The short test consisted of three consecutively simple tasks, whereby each was re-lated to the previous and each presented an increase in difficulty. In order to solve the test correctly, the participants had to use a form of one-to-many (hereinafter 1:N) and many-to-many (hereinafter M:N) relationship. The participants should not be given any instructions on how to solve the test. They should be left to use any means and techniques that seem appropriate. The foreseen time limit was 20 minutes.
The purpose of the Intro-Questionnaire was to examine students’ overall initial knowl-edge and skills related to database design, while the purpose of the Final-Questionnaire was to examine if there was any correlation between the notation used during the labora-tory work and students’ knowledge of CLR concepts. In order to evaluate the question-naire a scoring structure for the second part was needed. In order to solve the first task correctly, the participants had to model an entity (e.g., person) and give it some attributes and possibly a PK. For the second task, the participants had to model an additional entity (e.g. phone numbers) and present an 1:N relationship between the previous entity and the newly added one. For the third task, the participants had to add a third entity (e.g. ad-dress), and correctly use a form of M:N relationship between the previous entities and the newly added one. In order to be able to analyze the results, five concepts were evaluated: entity, relationship, attribute, PK and FK. The scoring was as follows: if they used any possible form of the concept in their solution and if the presented use of the concept was correct, participants got a point for the concept. Thus, five points could be scored in total.
Test The test was used once during the main experiment (see Figure 3). The participation
The purpose of the test was to examine if students understood the basic concepts of the conceptual database modeling (E-R diagram) and the relational data model through the forward and reverse engineering tasks. For the purpose of the main experiment we also wanted to examine if there was any correlation between students’ understanding (test score) and the notation used during the laboratory work.
In order to evaluate the test, a scoring was defined as follows. Each task was evaluated with 10 points, thus students could score a maximum of 20 points.
Exam The exam was used once during the main experiment (see Figure 3). It included
Kami
ˇsali
´c
et
al.
v
eness
of
a
T
eaching
Approach
Using
Bark
er
or
Bachman
Notation
435
5.
Results and discussion
In the next sections we report on the results achieved in the main experiment. Statistical analyzes were performed using IBM SPSS Statistics version 23.
5.1. Notation
Before presenting an analysis of the notation influencing factor, we use the results of the Intro-Questionnaire in order to evaluate the overall initial knowledge and skills related to database design. Even though we randomly split students into two groups, by gathering such results we analyzed students’ capabilities and experiences related to database design. Therefore we verify if the randomly generated groups are populated with students that have similar initial database design knowledge, thus avoiding the bias towards one group, i.e. towards one notation.
An analysis was performed on independent samples of results scored during the Intro-Questionnaire test, using the Mann-Whitney U test for independent samples, since the Shapiro-Wilk test of normality indicated that the data significantly deviates from a normal distribution (p-value below 0.05). The Mann-Whitney U test compares the differences between two independent groups (students assigned to the Barker or Bachman group) when the dependent variable (the student’s score) is either ordinal or continuous but not normally distributed.
There is no statistically significant difference between the test results of the Intro-Questionnaire, since the test returns an asymptotic significance higher than 0.05. There-fore it retains the null hypothesis for the aThere-forementioned element. The null hypothesis states that the distribution of the score is the same across categories of both Bachman and Barker groups.
Figure 4 depicts the correlation between the total score, and the group assigned at the beginning of the course. According to Figure 4, it is evident that students’ initial database design knowledge was similar in both assigned groups. We conclude that both groups are populated with students that have similar knowledge on database design.
Fig. 4.Students’ initial database knowledge per assigned group, i.e. per assigned notation.
The detailed analysis, taking into account all specific elements (i.e. FK, 1:M, M:N), is provided in order to demonstrate the direct advantage of one notation over the other.
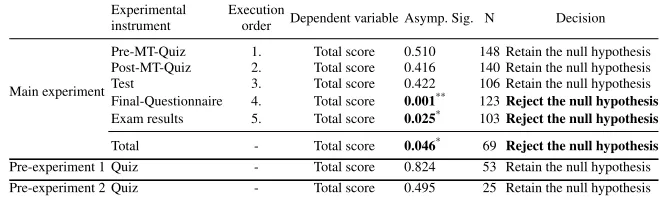
Notation used An analysis was performed on independent samples of results scored for five experimental instruments (see Section 4.2) used in the experimental study. It was based on data gathered from the Pre-MT-Quiz, Post-MT-Quiz, Test, Final-Questionnaire and Exam of the main experiment. Table 2 reports on the results of the analysis for each instrument separately and also the total sum. For the total sum we only included those students’ results who participated in all the mentioned instruments (i.e. 69 students). The analysis was performed using the Mann-Whitney U test for independent samples, since the Shapiro-Wilk test of normality indicated that the data significantly deviates from a normal distribution (p-value below 0.05).
There is a statistically significant difference between the results of the Final-Questionnaire, Exam and overall results considering the notation used in the learning process, since the test returns an asymptotic significance lower than 0.01 for the Final-Questionnaire and lower than 0.05 for the Exam and for the sum of results gathered from all instruments. Therefore it rejects the null hypothesis for the aforementioned elements, while it retains the null hypothesis for the Pre-MT-Quiz, Post-MT-Quiz and Test. The null hypothesis states that the distribution of the score is the same across categories of both Bachman and Barker notations.
Experimental instruments were executed in a specific order (see Section 4.1), which is indicated in Table 2. Considering the execution order it is evident that there are no sta-tistically significant differences at the beginning (i.e. Pre-MT-Quiz, Post-MT-Quiz, Test), while it becomes evident towards the end (i.e. Final-Questionnaire, Exam, Total). The re-sults scored at the end of the course have more importance for the teaching approach and students’ learning process, as they demonstrate students’ overall understanding of CLR concepts. All of this suggests that the usage of Bachman notation is more appropriate than the Barker notation as a teaching approach.
Table 2.Correlation of results scored and notation used.
Experimental instrument
Execution
order Dependent variable Asymp. Sig. N Decision
Main experiment
Pre-MT-Quiz 1. Total score 0.510 148 Retain the null hypothesis Post-MT-Quiz 2. Total score 0.416 140 Retain the null hypothesis Test 3. Total score 0.422 106 Retain the null hypothesis Final-Questionnaire 4. Total score 0.001** 123Reject the null hypothesis
Exam results 5. Total score 0.025* 103Reject the null hypothesis
Total - Total score 0.046* 69 Reject the null hypothesis
Pre-experiment 1 Quiz - Total score 0.824 53 Retain the null hypothesis Pre-experiment 2 Quiz - Total score 0.495 25 Retain the null hypothesis
*Significant at 5%; **Significant at 1%
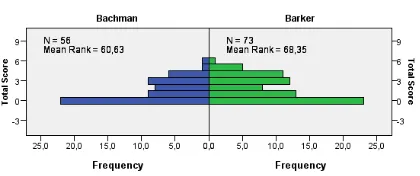
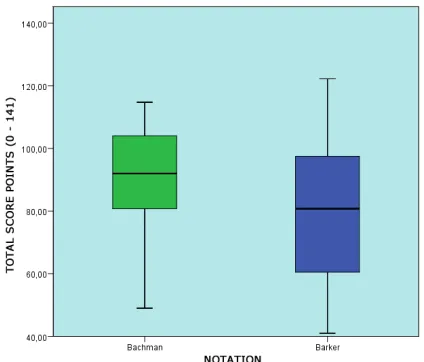
with the mean value of scored results at 89.23 and median at 92. On the other hand, there were 46 students who used the Barker notation with a mean value of scored results at 78.74 and median at 80.75. We concluded that students who used the Bachman notation during the learning process showed a better understanding of CLR concepts.
Fig. 5.Summed results of Pre-MT-Quiz, Post-MT-Quiz, Test, Final-Questionnaire and Exam in correlation with the notation used during the learning process.
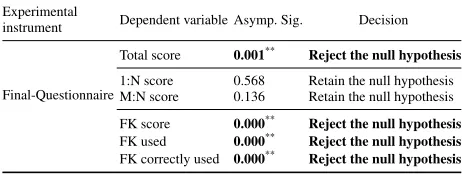
In order to additionally support the conclusions made, we further analyzed (using the Mann-Whitney U test) the results of specific CLR concepts from the Final-Questionnaire. Table 3 reports on the analysis of three important CLR concepts (i.e., 1:N, M:N, FK). The extracted concepts were separately considered because of their importance in conceptual and logical design. In addition, the main difference between used notations is the explicit representation of FK by the Bachman notation. We analyzed the scores reached for each concept. Moreover, the FK concept was analyzed in detail by examining whether students even used the FK and if it was correctly used. The test returned an asymptotic significance lower than 0.01 for the FK score, FK used and FK correctly used variables. Therefore it rejects the null hypothesis for the aforementioned variables, while it retains the null hypothesis for the 1:M and M:N scores. The results furthermore lend support to the idea that the inclusion of FK concepts into the conceptual design gives additional value to students’ understanding.
Table 3.Correlation of results scored for CLR concepts and notation used.
Experimental
instrument Dependent variable Asymp. Sig. Decision
Final-Questionnaire
Total score 0.001** Reject the null hypothesis
1:N score 0.568 Retain the null hypothesis M:N score 0.136 Retain the null hypothesis
FK score 0.000** Reject the null hypothesis
FK used 0.000** Reject the null hypothesis
FK correctly used 0.000** Reject the null hypothesis *Significant at 5%; **Significant at 1%
No. of participants: 123
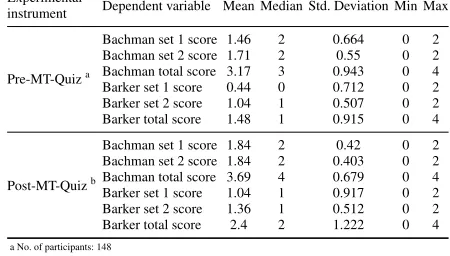
Notation presented An analysis was performed on related samples of results scored for tasks presented with Bachman and Barker notations. It was based on the data gathered from Pre-MT-Quiz and Post-MT-Quiz of the main experiment. The data for each quiz was analyzed separately. Furthermore, we grouped the tasks into sets by notation used to present them. Table 4 reports on the results of the analysis, which was performed using a Wilcoxon signed-rank test for related samples, since the Shapiro-Wilk test of normality indicated that the data significantly deviates from a normal distribution (p-value below 0.05). We used the Wilcoxon signed-rank test in order to compare two sets of scores, one for the Bachman notation and another for the Barker notation, that come from the same participants, since each quiz participant had to solve tasks presented with both notations. There is a statistically significant difference between the results scored for tasks pre-sented with Bachman and Barker notation, since the test returned an asymptotic signifi-cance lower than 0.01, thus rejecting the null hypothesis for all related samples. The null hypothesis states that the median of difference between all notation sets equals zero. The results indicate that usage of one notation over the other is more appropriate as a teaching approach.
Table 4.Correlation of results scored for tasks presented with Bachman and Barker notations.
Experimental
instrument Related Samples Asymp. Sig. (2-tailed) Decision
Pre-MT-Quiza
Barker set 1 score - Bachman set 1 score 0.000** Reject the null hypothesis
Barker set 2 score - Bachman set 2 score 0.000** Reject the null hypothesis
Barker total score - Bachman total score 0.000** Reject the null hypothesis
Post-MT-Quizb
Barker set 1 score - Bachman set 1 score 0.000** Reject the null hypothesis
Barker set 2 score - Bachman set 2 score 0.000** Reject the null hypothesis
Barker total score - Bachman total score 0.000** Reject the null hypothesis *Significant at 5%; **Significant at 1%
a No. of participants: 148 b No. of participants: 140
total results (i.e. for all 4 sets of tasks included) for tasks presented with the Bachman notation over the Barker notation. On the contrary, only seven participants reached the opposite results and 23 scored equal results for both notations. The Post-MT-Quiz re-sults showed a decrease in the difference between the scored rere-sults, indicating higher results scored for tasks presented with the Barker notation, while still under-performing in correlation with the Bachman notation. There were 92 out of 140 participants at the Post-MT-Quiz who scored higher total results for tasks presented with the Bachman nota-tion over the Barker notanota-tion. On the contrary, only five participants reached the opposite results, while 43 scored equal results for both notations. A further indication of the ad-vantage of the Bachman notation over the Barker notation can be observed in Table 6. It shows the results of the Pre- and Post-MT-Quiz. The mean of the reached score for all the tasks presented with Bachman notation during the Pre-MT-Quiz is 3.17, while the mean for the Barker notation stands at 1.48. In addition, the means at Post-MT-Quiz are 3.69 and 2.4, respectively.
During the learning process, some students used the Bachman notation, while others the Barker notation. All students had to solve tasks (experimental instruments), which were presented with both notations. We conclude that regardless of the notation used during the learning process, students showed a better understanding of CLR concepts when solving tasks presented with Bachman notation.
Table 5.Advantages of the results scored for tasks presented with one notation over the another.
Experimental
instrument Related samples N Mean Rank Sum of Ranks
Pre-MT-Quiz
Barker set 1 score - Bachman set 1 score
Negative Ranks 106 a 57.00 6042.00 Positive Ranks 6 b 47.67 286.00
Ties 36 c
Total 148
Barker set 2 score - Bachman set 2 score
Negative Ranks 98 d 55.67 5456.00 Positive Ranks 11 e 49.00 539.00
Ties 39 f
Total 148
Barker total score - Bachman total score
Negative Ranks 118 g 65.26 7701.00 Positive Ranks 7 h 24.86 174.00
Ties 23 i
Total 148
Post-MT-Quiz
Barker set 1 score - Bachman set 1 score
Negative Ranks 73 a 42.75 3121.00 Positive Ranks 7 b 17.00 119.00
Ties 60 c
Total 140
Barker set 2 score - Bachman set 2 score
Negative Ranks 73 d 38.53 2813.00 Positive Ranks 5 e 53.60 268.00
Ties 62 f
Total 140
Barker total score - Bachman total score
Negative Ranks 92 g 49.13 4520.00 Positive Ranks 5 h 46.60 233.00
Ties 43 i
Total 140
Table 6.Results of Pre- and Post-MT-Quiz considering Bachman and Barker sets of tasks.
Experimental
instrument Dependent variable Mean Median Std. Deviation Min Max
Pre-MT-Quiza
Bachman set 1 score 1.46 2 0.664 0 2 Bachman set 2 score 1.71 2 0.55 0 2 Bachman total score 3.17 3 0.943 0 4 Barker set 1 score 0.44 0 0.712 0 2 Barker set 2 score 1.04 1 0.507 0 2 Barker total score 1.48 1 0.915 0 4
Post-MT-Quizb
Bachman set 1 score 1.84 2 0.42 0 2 Bachman set 2 score 1.84 2 0.403 0 2 Bachman total score 3.69 4 0.679 0 4 Barker set 1 score 1.04 1 0.917 0 2 Barker set 2 score 1.36 1 0.512 0 2 Barker total score 2.4 2 1.222 0 4
a No. of participants: 148 b No. of participants: 140
Conclusions regarding RQ1:The usage of one notation over another has an influ-ence on students’ understanding of CLR concepts. The results show that students who use the Bachman notation in the learning process score better results, thus prove better under-standing. The Bachman notation enables students achieve better results on evaluated CLR concepts regardless of the notation used during laboratory work. Therefore, we conclude that the usage of Bachman notation has a positive influence.
5.2. Manual transformation
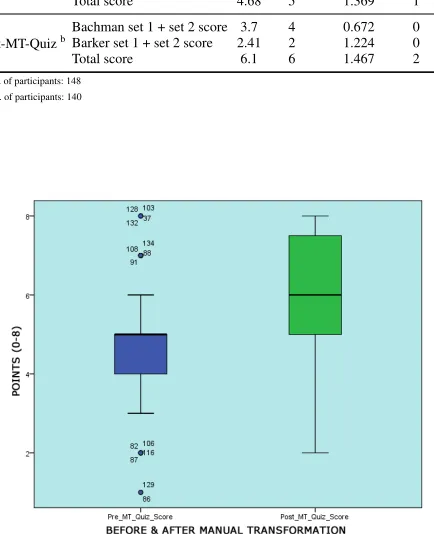
An analysis was performed on related samples of students’ quiz scores before and after they performed a manual transformation from the conceptual into the logical data model. It was based on the data gathered from Pre-MT-Quiz and Post-MT-Quiz of the main ex-periment. It should be noted that both quizzes were equal, that students did not get the results of the Pre-MT-Quiz until they finished with the MT-Quiz, and that the Post-MT-Quiz was performed immediately after the manual transformation. There were 148 students participating in the Pre-MT-Quiz and 140 in the Post-MT-Quiz, while 134 stu-dents participated in both quizzes (see Section 4.2), thus only these were included in the analysis.
We used the Wilcoxon signed-rank test for related samples in order to compare two sets of scores that come from the same participants. The Wilcoxon signed-rank test was chosen, since the Shapiro-Wilk test of normality indicated that the data significantly de-viates from a normal distribution (p-value below 0.05). There is a statistically signifi-cant difference between students’ score before and after the manual transformation. The Wilcoxon signed-rank test returns an asymptotic significance lower than 0.01, thus re-jects the null hypothesis for related samples. The null hypothesis states that the median of difference between the Pre-MT-Quiz score and Post-MT-Quiz score equals zero. There-fore the results suggest that introducing manual transformation has an impact on students’ understanding of CLR concepts.
obtained results were grouped by notations (Bachman, Barker) used to present the tasks in order to additionally evaluate if the notations have an impact on the results scored.
As observed in Table 7, results for each variable increased after the manual transfor-mation. For example, the mean of the total score of Bachman and Barker notation in the Pre-MT-Quiz was 4.68, while it was 6.1 in the Post-MT-Quiz. Furthermore, if we look at the median for each variable separately, for both quizzes, it is clear that the results
im-proved, i.e. 3→4, 1→2, 5→6. Therefore we can conclude that students’ understanding
of CLR concepts improved after the performed manual transformation.
Moreover, the results indicate that after the performed manual transformation, stu-dents better understood the role of foreign keys as well as notation that does not present the foreign keys explicitly (i.e. Barker). Such an increase in understanding can be at-tributed to the fact that, through this, students learn in detail the connection between the elements of the conceptual, logical and relational model. Nevertheless students achieved better results in both quizzes when using the Bachman notation. Hence we additionally support the conclusions given for research question 1.
Table 7.Results before and after manual transformation.
Experimental
instrument Variable Mean Median Std. Deviation Min Max
Pre-MT-Quiza
Bachman set 1 + set 2 score 3.2 3 0.937 0 4 Barker set 1 + set 2 score 1.48 1 0.937 0 4
Total score 4.68 5 1.369 1 8
Post-MT-Quizb
Bachman set 1 + set 2 score 3.7 4 0.672 0 4 Barker set 1 + set 2 score 2.41 2 1.224 0 4
Total score 6.1 6 1.467 2 8
a No. of participants: 148 b No. of participants: 140
Table 8 reports on the ranks of the performed Wilcoxon signed-rank test. There were 91 out of 135 students who scored higher results after the manual transformation was performed (Post-MT-Quiz). On the contrary, only 14 participants reached the opposite re-sults, thus furthermore proving that manual transformation leads towards students’ better understanding of CLR concepts.
Table 8.Cases of Post-MT-Quiz scores versus Pre-MT-Quiz scores.
Experimental
instrument Related samples N Mean Rank Sum of Ranks
Pre-MT-Quiz
Post-MT-QuizPost-MT-Quiz-Score - Pre-MT-Quiz-Score
Negative Ranks 14a 36.14 506.00
Positive Ranks 91b 55.59 5059.0 Ties 30c
Total 135
a Post-MT-Quiz-Score<Pre-MT-Quiz-Score b Post-MT-Quiz-Score>Pre-MT-Quiz-Score c Post-MT-Quiz-Score = Pre-MT-Quiz-Score
Conclusions regarding RQ2:The introduction of a manual transformation from a conceptual into a logical data model contributes to students’ understanding of CLR con-cepts. It enables students achieve better results for evaluated CLR concon-cepts. Furthermore, the manual transformation helped students to obtain better results regardless of the used notation, although students’ understanding of CLR concepts using Bachman notation was overall better.
5.3. Discussion summary
We finally conclude the discussion with a brief summary. Table 9 summarizes the re-search questions (see Section 1.3) and the corresponding confirmation status of the null hypotheses presented previously in detail.
Table 9.Summarized research questions and the appropriate null hypotheses’ confirmation status.
Research
Question Null hypothesis Confirmation status
RQ1
The distribution of students’ total score at the start of the course is the same across categories of both Bachman and Barker notations. Retain the null hypothesis The distribution of students’ total score at the end of the course is the same across categories of both Bachman and Barker notations.Reject the null hypothesis The distribution of students’ score for the foreign key concept is the same across categories of both Bachman and Barker notations. Reject the null hypothesis The median of difference between Bachman and Barker notation equals zero. Reject the null hypothesis RQ2 The median of difference between students’ score before and after manual transformation equals zero. Reject the null hypothesis
6.
Research limitations
This section announces and reflects on the research limitations of the study. Each of the limitation is described and presented in detail.
During the course and the study we used only basic conceptual models comprising a trivial number of entities. We believe that during the teaching process such examples are enough to test students’ knowledge on evaluated concepts. If students are capable of understanding the concepts based on a simple example, we believe that the knowledge would be easily translated also to more complex domains. Still, to confirm this another study should be prepared which would show how scaling the E-R models presented with specific notations, would influence students’ understanding. Also evaluating a general model comprehension when presented with one or other notation was not part of this study. We were focusing on evaluating students understanding of CLR concepts during the learning process.
Requirements analysis presents an important part of database design. Consequently verifying whether a conceptual design satisfies a textual requirements specification is important, and the influence of a notation can be studied, since notation which is more abstract might be more helpful for such tasks. Our experiment did not address these is-sues, since we focused on verifying students understanding of CLR concepts during the entire database design process. Therefore we did not limit our study to the requirements analysis.
Finally, conclusions made in this study are based on an experiment from a single semester, with a specific set of students. In order to transfer the conclusions globally, more studies with the same setting would have to be performed.
7.
Conclusions
The paper reported on the results of an experimental study aimed at analyzing the influ-ence of notation used for the conceptual design on students’ learning outcome. The study was designed as a multi-level experiment consisting of two pre-experiments and one main experiment. The purpose of the multi-level approach was to examine the effectiveness of learning CLR concepts, depending on different influencing factors at various educational levels.
During the experimental study two student groups were formed. One group used the Barker notation, which consists of traditional conceptual design elements. The other used Bachman notation, which in contrast consists of elements from both conceptual and log-ical design. The results show that the modeling notation used during individual students’ laboratory work has an impact on their understanding of CLR concepts. Additionally, they indicate that the impact is not present at the beginning of the learning process (i.e. Pre-MT-Quiz, Post-Pre-MT-Quiz, Test) , but is apparent towards the end (i.e. Final-Questionnaire, Exam, Total).
In order to obtain a logical data model from the conceptual model, a manual or DBMS-automated transformation can be performed. We used the manual transformation in the learning process. Using such an approach, students gain more knowledge on CLR con-cepts regardless of notation used. With the experimental results we confirm that students’ understanding of CLR concepts is better after the performed manual transformation. Fur-thermore, the results indicate that students’ scored higher results while using the Bach-man notation in both quizzes, but increased their score more when referring to the Barker notation in the Post-MT-Quiz. We conclude that the manual transformation promoted a better understanding of Barker notation thus mitigating the gap between both notations, although students’ understanding of Bachman notation was overall better.
Based on the obtained results, we propose guidelines which are compliant with recom-mendations provided by Fessakis et al. [18] for learning fundamental database concepts in secondary education. While Fessakis et al. outline the appropriateness of adding for-eign keys into the conceptual model, our research focuses on the usage and comparison of modeling notations, where one notation includes this element of logical modeling (Bach-man). Moreover, our research results are obtained during the active learning process of higher education students. During the conceptual modeling we recommend using Bach-man or a similar notation that combines conceptual and logical design concepts instead of using a traditional conceptual design, as part of teaching approach. Furthermore, we recommend the manual transformation from a conceptual into a logical data model.
Within this study we will also analyze results for other influencing factors, such as ed-ucational background and students’ knowledge perception. To corroborate the findings on the influence of manual transformation on the effectiveness of students’ understanding of CLR concepts, in the future we will consider alternative experimental settings. We plan to compare the outcomes of the manual and DBMS-automated transformation from a con-ceptual into a logical data model. Furthermore, we will set up a study on using different notations for the requirements analysis process. Since our institution has students with different backgrounds on database fundamentals (some students take an SQL program-ming course before taking Database I), we will be able to set up an experiment in order to evaluate the influence of SQL programming on database design (CLR concepts) learning outcomes. Moreover, we will study the influence of different design tools on students’ learning achievements.
Acknowledgments.We sincerely thank the student generation 2016/2017 of the Faculty of Electri-cal Engineering and Computer Science (University of Maribor) for their active participation in the experimental study, and the workshop participants at the 1st grammar school Maribor, 3rd grammar school Maribor and Higher vocational economics collage Murska Sobota. We are also thankful to the teachers of the above-mentioned schools for providing the necessary time and space. We would also like to express our appreciations to faculty colleagues for their participation in the interviews and the feedback received prior to the the execution of the experiment. Lastly, we acknowledge the financial support from the Slovenian Research Agency (Research Core Funding No. P2-0057).
References
2. ACM/IEEE: Software Engineering 2014 (SE2014) - Curriculum Guidelines for Undergraduate Degree Programs in Software Engineering. Tech. rep., ACM & IEEE (2015),http://www. acm.org/binaries/content/assets/education/se2014.pdf
3. ACM/IEEE: Computer Engineering Curricula 2016 (CE2016) - Curriculum Guidelines for Undergraduate Degree Programs in Computer Engineering. Tech. rep., ACM & IEEE (2016), http://www.acm.org/binaries/content/assets/education/ ce2016-final-report.pdf
4. Al-Shamailh, A.: An Experimental Comparison of ER and UML Class Diagrams. International Journal of Hybrid Information Technology 8(2), 279–288 (2015),http://dx.doi.org/ 10.14257/ijhit.2015.8.2.26
5. Brusilovsky, P., Sosnovsky, S., Yudelson, M.V., Lee, D.H., Zadorozhny, V., Zhou, X.: Learning SQL Programming with Interactive Tools: From Integration to Personalization. Trans. Comput. Educ. 9(4), 19:1–19:15 (2010),http://doi.acm.org/10.1145.1656255.1656257
6. Carter, J.: The relational database. Chapman & Hall (1995)
7. Chan, H.C., Wei, K.K., Siau, K.L.: Conceptual level versus logical level user-database interac-tion. In: ICIS 45. Proceedings. pp. 29–40 (1991)
8. Chen, P.P.S.: The Entity-relationship Model&Mdash;Toward a Unified View of Data. ACM Trans. Database Syst. 1(1), 9–36 (1976),http://doi.acm.org/10.1145/320434. 320440
9. Cheung, W., Li, E.Y., Yee, L.W.: Multimedia learning system and its effect on self-efficacy in database modeling and design: an exploratory study. Computers & Education 41(3), 249–270 (2003), http://www.sciencedirect.com/science/article/ pii/S0360131503000484
10. Connolly, T.M., Begg, C.E.: A Constructivist-Based Approach to Teaching Database Analysis and Design. Journal of Information Systems Education pp. 43–53 (2005)
11. Connolly, T.M., Stansfield, M., McLellan, E.: Using an Online Games-Based Learning Ap-proach to Teach Database Design Concepts. Electronic Journal of e-Learning 4(1), 103–110 (2006)
12. Cvetanovic, M., Radivojevic, Z., Blagojevic, V., Bojovic, M.: ADVICE—Educational System for Teaching Database Courses (2011)
13. Czenky, M.E.: How Do the Engineer Students Learn the SQL Language? International Journal of Engineering Pedagogy 4(1), 18–23 (2014)
14. Dargie, R., Steele, A.: Teaching Database Concepts using Spatial Data Types. In: In Proceed-ings of the 4th annual conference of Computing and Information Technology Research and Education New Zealand. pp. 17–21 (2013)
15. De Lucia, A., Gravino, C., Oliveto, R., Tortora, G.: An experimental comparison of ER and UML class diagrams for data modelling. Empirical Software Engineering 15(5), 455–492 (2010),http://dx.doi.org/10.1007/s10664-009-9127-7
16. Dietrich, S.W., Urban, S.D.: Database Theory in Practice: Learning from Cooperative Group Projects. SIGCSE Bull. 28(1), 112–116 (1996), http://doi.acm.org/10.1145/ 236462.236520
17. Dom´ınguez, C., Jaime, A.: Database design learning: A project-based approach orga-nized through a course management system. Computers & Education 55(3), 1312– 1320 (2010), http://www.sciencedirect.com/science/article/pii/ S0360131510001600
18. Fessakis, G., Dimitracopoulou, A., Komis, V.: Improving database design teaching in sec-ondary education: action research implementation for documentation of didactic require-ments and strategies. Computers in Human Behavior 21(2), 159–194 (2005),http://www. sciencedirect.com/science/article/pii/S0747563204001177
20. Jaakkola, H., Henno, J., Welzer-Druzovec, T., Thalheim, B., M¨akel¨a, J.: Why Information Sys-tems Modelling Is Difficult. SQAMIA 2016:CEUR workshop proceedings 1677, 29–39 (2016),
http://ceur-ws.org/Vol-1677/paper04.pdf
21. Koulouri, T., Lauria, S., Macredie, R.D.: Teaching Introductory Programming: A Quantita-tive Evaluation of Different Approaches. Trans. Comput. Educ. 14(4), 26:1–26:28 (12 2014),
http://doi.acm.org/10.1145/2662412
22. Kunkle, W.M., Allen, R.B.: The Impact of Different Teaching Approaches and Languages on Student Learning of Introductory Programming Concepts. Trans. Comput. Educ. 16(1), 3:1– 3:26 (2016),http://doi.acm.org/10.1145/2785807
23. Lavbiˇc, D., Matek, T., Zrnec, A.: Recommender system for learning sql using hints. Inter-active Learning Environments 25(8), 1048–1064 (2017),https://doi.org/10.1080/ 10494820.2016.1244084
24. Lunt, B.M., Ekstrom, J.J., Gorka, S., Hislop, G., Kamali, R., Lawson, E., LeBlanc, R., Miller, J., Reichgelt, H.: Information Technology 2008 (IT2008) - Curriculum Guidelines for Un-dergraduate Degree Programs in Information Technology. Tech. rep., ACM & IEEE (2008),
http://www.acm.org//education/curricula/IT2008Curriculum.pdf
25. Martin, C., Urpi, T., Casany, M.J., Burgue, X., Quer, C., Rodriguez, M.E., Abello, A.: Im-proving Learning in a Database Course using Collaborative Learning Techniques. International Journal of Engineering Education 29(4), 1–12 (2013)
26. Purchase, H.C., Welland, R., McGill, M., Colpoys, L.: Comprehension of diagram syntax: an empirical study of entity relationship notations. International Journal of Human-Computer Studies 61(2), 187–203 (2004),http://www.sciencedirect.com/ science/article/pii/S1071581904000072
27. Rantanen, J., Laux, F., Silpi¨o, K.: Combined Final Reports of WP3, WP5 and WP9 of Database Professional (DBTech Pro) Project. Tech. rep. (2005),http://myy.haaga-helia.fi/ ˜dbms/dbtechnet/finalr/WP3,5,9.PDF
28. S´anchez, P., Zorrilla, M., Duque, R., Nieto-Reyes, A.: Are models easier to understand than code? An empirical study on comprehension of entity-relationship (ER) models vs. structured query language (SQL) code. Computer Science Education 21(4), 343–362 (2011),http:// dx.doi.org/10.1080/08993408.2011.630128
29. Sedrakyan, G., Snoeck, M., Poelmans, S.: Assessing the effectiveness of feedback enabled simulation in teaching conceptual modeling. Computers & Education 78, 367–382 (9 2014), http://www.sciencedirect.com/science/article/pii/ S036013151400147X
30. Soflano, M., Connolly, T.M., Hainey, T.: An application of adaptive games-based learn-ing based on learnlearn-ing style to teach SQL. Computers & Education 86(Supplement C), 192–211 (2015),http://www.sciencedirect.com/science/article/pii/ S0360131515000937
31. Soflano, M., Connolly, T.M., Hainey, T.: Learning style analysis in adaptive GBL application to teach SQL. Computers & Education 86(Supplement C), 105–119 (2015),http://www. sciencedirect.com/science/article/pii/S0360131515000536
32. Song, I.Y., Evans, M., Park, E.: A Comparative Analysis of Entity-Relationship Diagrams. Journal of Computer and Software Engineering 3(4), 427–459 (1995)
33. Thompson, C.B., Sward, K.: Modeling and Teaching Techniques for Conceptual and Logical Relational Database Design. Journal of Medical Systems 29(5), 513–525 (2005),http:// dx.doi.org/10.1007/s10916-005-6108-3
34. Topi, H., Valacich, J.S.: IS2010 - Curriculum Guidelines for Undergraduate Degree Pro-grams in Information Systems. Tech. rep., ACM & AIS (2010),http://www.acm.org/ education/curricula/IS2010ACMfinal.pdf
36. Weaver, P.L., Lambrou, N., Walkley, M.: Practical SSADM version 4+ : a complete tutorial guide. Financial Times, Pitman Pub (1998)
A.
Supplementary Material
Supplementary materials contain all experimental instruments used in the study, which are also available on the web (http://goo.gl/8pPjH4).
Aida Kamiˇsali´cis a Teaching Assistant and researcher at the Faculty of Electrical Engi-neering and Computer Science at the University of Maribor. She holds a PhD in Computer Science since 2014. Her research interests include advanced database technologies, big data, blockchain technology, and medical informatics with focus on procedures modeling for chronic patients, and time knowledge acquisition for medical procedures.
Marjan Heriˇckois a Full Professor at the University of Maribor, Faculty of Electrical Engineering and Computer Science where he is the Head of the Institute of Informatics. He received his PhD (1998) in Computer Science and Informatics from the University of Maribor. His main research interests include all aspects of IS development with emphasis on software and service engineering, software process improvement, data, and process modeling.
Tatjana Welzer is a Full Professor at the University of Maribor, Faculty of Electrical Engineering and Computer Science. She is the Head of the Database Technologies Labo-ratory of the Institute of Informatics. She received her PhD in Computer Science in 1995. Her research work covers areas of database technologies, cross-cultural communication and problems in media communications.
Muhamed Turkanovi´cis an Assistant Professor at the University of Maribor, Faculty of Electrical Engineering and Computer Science. He received his PhD degree in Computer Science and Informatics from the University of Maribor 2016. His current research inter-ests include advanced database technologies, big data, blockchain technology, Internet of Things, cryptography, wireless sensor networks, and quantum cryptography.