Survey Research Methods (2016) Vol. 10, No. 3, pp. 171-187 doi:10.18148/srm/2016.v10i3.6703
c
European Survey Research Association ISSN 1864-3361 http://www.surveymethods.org
Sensitive Questions in Online Surveys: An Experimental Evaluation of
Di
ff
erent Implementations of the Randomized Response Technique and
the Crosswise Model
Marc Höglinger
University of Bern SwitzerlandBen Jann
University of Bern SwitzerlandAndreas Diekmann
ETH Zurich SwitzerlandSelf-administered online surveys may provide a higher level of privacy protection to respon-dents than surveys administered by an interviewer. Yet, studies indicate that asking sensitive questions is problematic also in self-administered surveys. Because respondents might not be willing to reveal the truth and provide answers that are subject to social desirability bias, the validity of prevalence estimates of sensitive behaviors from online surveys can be challenged. A well-known method to overcome these problems is the Randomized Response Technique (RRT). However, convincing evidence that the RRT provides more valid estimates than direct questioning in online surveys is still lacking. We therefore conducted an experimental study in which different implementations of the RRT, including two implementations of the so-called crosswise model, were tested and compared to direct questioning. Our study is an online survey (N=6,037) on sensitive behaviors by students such as cheating in exams and plagia-rism. Results vary considerably between different implementations, indicating that practical details have a strong effect on the performance of the RRT. Among all tested implementations, including direct questioning, the unrelated-question crosswise-model RRT yielded the highest estimates of student misconduct, which we would expect if the crosswise-model RRT is more valid than the other techniques. However, because the higher estimates may also be due to false positives, our results should not be taken as a proof for the superior validity of the crosswise-model RRT.
Keywords:Sensitive Questions, Online Survey, Randomized Response Technique, Crosswise Model, Plagiarism
1 Introduction
Many empirical studies in the fields of deviance, epi-demiology, political opinions, or attitudes are based on self-reports about sensitive behavior or potentially stigmatizing traits. Surveying sensitive topics and obtaining accurate an-swers to sensitive questions, however, is a persistent chal-lenge to survey research. Respondents might misreport on sensitive questions and, hence, introduce systematic
mea-surement error into survey data. Results from validation
studies, that is, studies in which the researchers know the true answers, illustrate that the proportion of respondents who do not answer truthfully to questions on norm
viola-Marc Höglinger, University of Bern, Fabrikstrasse 8, 3012 Bern, Switzerland, phone: +41 31 631 48 46, fax: +41 31 631 48 17, email:[email protected].
tions and deviant behavior can be substantial. For example, in a validation study by Preisendörfer and Wolter (2014), 42 percent (face-to-face interviews) and 33 percent (mail sur-vey) of respondents did not admit that they were convicted in court. Likewise, 75 percent of respondents who committed welfare or unemployment benefit fraud denied having done so in face-to-face interviews by van der Heijden, van Gils, Bouts, and Hox (2000). As a consequence of such misre-porting, the prevalence of sensitive behaviors is likely to be underestimated by population surveys and estimated corre-lations between sensitive characteristics and other variables might be biased.
1.1 Question sensitivity and social-desirability bias
Following Tourangeau and Yan (2007) three types of sen-sitive questions may be distinguished. First, a question might be perceived as too intrusive and personal. For such a
172 MARC HÖGLINGER, BEN JANN AND ANDREAS DIEKMANN
tion high rates of nonresponse, but not necessarily a high de-gree of misreporting, might be expected. Second, a ques-tion can involve a threat of disclosure and subsequent sanc-tions by third parties. For such a question we would expect deliberate misreporting by respondents as a means of self-protection, unless anonymity is guaranteed in a credible way. Third, and more generally, a question can be sensitive in the sense that it refers to the violation of a social norm. In such a case we may expect that respondents tend to answer in ac-cordance with the social norm, leading to so-called social-desirability bias. The misreporting might be due to deliberate
“impression management” (Paulhus,1984), or to more subtle
processes such as self-deception. Furthermore, the degree to which a question is perceived as sensitive and the answers that are considered as socially desirable or undesirable may
depend on context and may differ between subpopulations.
Questions on academic misconduct, for instance, the topic we survey in the present study, are perceived as more or less sensitive depending on respondents’ personal attitudes, their beliefs about the risk of disclosure and possible sanctions, and their perception of social norms against academic mis-conduct.
1.2 The Randomized Response Technique
A well-known strategy to elicit truthful answers to sen-sitive questions is the Randomized Response Technique (RRT), introduced by Warner (1965). The idea behind the RRT is to protect the privacy of respondents by introducing random noise into their answers. Respondents who appreci-ate the anonymity induced by the procedure, it is assumed, are more inclined to provide truthful answers, as the mis-classification resulting from the random noise breaks the link between individual answers and the true value of the sensi-tive variable and therefore eliminates the risk of disclosure as well as the opportunity for impression management. A widely used RRT variant is the forced-response design pro-posed by Boruch (1971) and Greenberg, Abul-Ela, Simmons, and Horvitz (1969), in which respondents employ a random-izing device (e. g., dice, coins) to determine whether they should answer the sensitive question (“yes” or “no”) or sim-ply give an automatic “yes” or “no” response irrespective of the true answer to the sensitive question. The result of the randomizing device is known only to the respondent, not to the researchers. Nonetheless, given the properties of the ran-domizing device, it is possible to infer the population preva-lence of the sensitive behavior in question. A meta-analysis of 32 studies on the RRT in face-to-face or paper-and-pencil mode revealed that, on average, the RRT was successful in eliciting higher prevalence estimates of sensitive behav-iors and attitudes than direct questioning (Lensvelt-Mulders,
Hox, van der Heijden, & Maas,2005). Other studies,
how-ever, cast doubt on the validity of the RRT (e. g. Holbrook
& Krosnick,2010; Wolter & Preisendörfer,2013).
Further-more, for self-administrated online mode, empirical evidence on the performance of the RRT is still scarce and inconclu-sive.
1.3 RRT in online surveys
Online surveys, as well as other self-administered sur-veys such as paper-and-pencil interviews or interactive voice
recognition (IVR), offer respondents more anonymity and
privacy than interviewer-administered surveys. Therefore,
effects of social desirability and perceived intrusiveness
(Tourangeau, Rips, & Rasinski, 2000), two main causes
of potential misreporting, might be attenuated. Conform-ing to that expectation, Kreuter, Presser, and Tourangeau (2008) found lower misreporting for several sensitive items in a validation study with university alumni for online mode compared to computer-assisted telephone interviews (CATI). However, misreporting remained substantial also in online mode, indicating that the application of sensitive-question techniques such as the RRT could be valuable. Moreover, respondents might actually be more attentive to privacy con-cerns in online surveys than in CATI or paper-and-pencil
in-terviews (Couper,2000). Results from the few studies
com-paring RRT to direct questioning in online mode are not very promising. Coutts and Jann (2011) found no higher preva-lence estimates for six socially undesirable behaviors using
five different forced-response RRT implementations. Quite
the contrary, prevalence estimates were often lower than with direct questioning, or even negative due to considerable non-compliance with the RRT procedure. Snijders and Weesie (2008) found similar results with numerous negative preva-lence estimates using a forced-response RRT design with a virtual die. Ostapczuk and Musch (2011) as well as Peeters (2005), both using a forced-response RRT design, found no
differences in prevalence estimates between RRT and direct
questioning. Holbrook and Krosnick (2010) surveyed vot-ing in the US, a socially desirable behavior, and found un-realistically high voter turnout estimates using various RRT implementations. The only online study we are aware of in which the RRT actually outperformed direct questioning is the study by de Jong, Pieters, and Fox (2010), which used a
special multi-item RRT design.1
1.4 Reasons for the failure of the RRT in online mode
There are several reasons why implementations of the RRT might fail in online surveys. First, respondents’ com-prehension of the underlying principle, protection through randomization, is far from universal in most samples but seems crucial to elicit truthful answers (Landsheer, van der
1Furthermore, Moshagen and Musch (2012) found higher preva-lence estimates if cheating correction (see footnote 11) was applied. Without cheating correction, however, the RRT estimates were not significantly different from the direct-questioning estimates.
SENSITIVE QUESTIONS IN ONLINE SURVEYS: AN EXPERIMENTAL EVALUATION OF DIFFERENT IMPLEMENTATIONS OF RRT AND CM 173
Heijden, & van Gils, 1999). In contrast to
interviewer-administered surveys, it is difficult in online mode to provide
respondents with additional assistance and tailored informa-tion about the sensitive-quesinforma-tion procedure if required. But if respondents do not comprehend the RRT and, as a con-sequence, do not trust it, they might prefer to behave in a self-protective way and answer “no” irrespective of instruc-tions. Second, in the forced-response variant of the RRT, respondents might be reluctant to provide a “yes” answer if they did not engage in the sensitive behavior, as this might be perceived as giving a wrong answer or being forced to lie, or because they fear being falsely accused of something they
did not do (Edgell, Himmelfarb, & Duchan,1982;
Lensvelt-Mulders & Boeije,2007). Third, it is difficult to find a
suit-able randomizing device for online mode that is at respon-dents’ immediate disposition, imposes no mode shift, and is perceived as trustworthy. Conventional devices such as dice
or coins (Coutts & Jann,2011; de Jong et al.,2010; Holbrook
& Krosnick,2010) are problematic because they require
re-spondents to leave the computer and pause with the survey. This might induce respondents to refrain from applying the
randomizing device or break offthe interview. Furthermore,
electronic devices such as virtual dice, virtual coins or a
vir-tual random wheel (Coutts & Jann,2011; Peeters,2005;
Sni-jders & Weesie,2008) can be manipulated or tracked by
ex-perimenters, and thus might not be judged trustworthy by the respondents. Because the randomizing devices employed in most of the published studies did not solve these problems, it remains unclear whether the poor performance of the RRT in online mode is simply due to the lack of a suitable random-izing device.
1.5 The crosswise-model RRT
Yu, Tian, and Tang (2008) introduced the crosswise-model RRT as a promising alternative to conventional RRT variants. In the crosswise-model RRT respondents are pre-sented two questions at the same time: a sensitive question and an unrelated non-sensitive question. Respondents then have to indicate whether their answers to the two questions
are the same (i. e. both “yes” or both “no”) or different (i. e.
one “yes”, one “no”). As long as the answer to the unrelated question is unknown, the respondent’s answer to the sensi-tive question remains private. Again, however, prevalence estimation is feasible if the probability distribution of the non-sensitive question is known. Respondents should eas-ily understand that the crosswise-model RRT protects their
privacy since the possible answers, “the same” or “diff
er-ent”, are obviously ambiguous. Furthermore, there is no clear self-protective answering strategy and no one is forced
to give a “false” answer. Note that the crosswise-model
RRT is formally equivalent to the original RRT scheme by Warner (1965). However, it follows a different logic than
the Warner scheme and appears qualitatively different to the
respondents as two questions have to be answered
simul-taneously and no affirmative or negative answer has to be
given. A first empirical application of the crosswise-model RRT in a small-scale paper-and-pencil survey on paper pla-giarism among students yielded significantly higher preva-lence estimates compared to direct questioning (Jann, Jerke,
& Krumpal, 2012). Promising results are also reported by
Shamsipour et al. (2014). However, evidence on the perfor-mance of the crosswise-model RRT is still scarce and the technique has not yet been tested in online mode.
1.6 Our study
In our study we compare different variants of the RRT, including the crosswise model, to direct questioning in an online survey on student misbehavior such as cheating in ex-ams and plagiarism. One of the first empirical studies of stu-dent misconduct was carried out in the early 1960s at the Bureau of Applied Social Research in Columbia (Bowers, 1964) and a series of similar studies followed (for reviews
see: Crown & Spiller, 1998; McCabe, Trevino, &
Butter-field,2001). Concerns about student cheating and, in
partic-ular, plagiarism received increased attention as the Internet has provided growing opportunities for plagiarism – and, at the same time, new sophisticated tools for detecting rism. Survey questions on exam cheating and paper plagia-rism may thus raise social desirability concerns as well as worries about serious consequences in the case of disclosure. Both universities where the study was conducted have for-mal rules explicitly stating that cheating on exams and pla-giarism will result in disciplinary actions and – depending on the severity of the misconduct and on the context – in sanc-tions such as a failing grade, expulsion from the respective course or field of study, temporary or indeterminate expul-sion from the university, or revocation of an academic title.
The items in our survey cover different aspects of sensitivity
(Tourangeau et al.,2000; Tourangeau & Yan,2007) and we
expect substantial underreporting if the questions are asked directly. The RRT implementations, if successful, should therefore yield higher estimates of the sensitive behaviors.
The goals of our study are as follows. First, we want to provide evidence on the performance of the RRT in online surveys in general, as convincing evidence that the RRT pro-vides more valid estimates than direct questioning in online surveys is still lacking. Second, we want to evaluate whether the poor performance of the RRT in some of the previous online studies is due to the lack of a good randomizing de-vice. Therefore, we compare a traceable virtual random-izing device, as has been used in previous studies, against a novel virtual randomizing device that cannot be tracked. Third, previous evidence indicates that the often-used forced-response RRT might be subject to noncompliance because respondents are reluctant to provide a “false” forced answer. We therefore compare the forced-response RRT to a design
174 MARC HÖGLINGER, BEN JANN AND ANDREAS DIEKMANN
in which respondents answer an unrelated question instead of providing a forced response, a design that might mitigate the noncompliance problem as all respondents provide an answer to a “real” question. Fourth, the unrelated-question RRT still has the problem that there is a clear self-protective answering strategy (always say “no”). The crosswise-model RRT might overcome this problem. Furthermore, we think that the crosswise-model RRT is particularly well suited for use in self-administered online surveys due to its simplicity. We therefore evaluate how the crosswise-model RRT com-pares to the other RRT variants and whether the promising results of earlier studies can be replicated in online mode. Fifth, a limitation of the classic crosswise-model RRT is that it requires the researcher to come up with sensible unrelated questions for which the probability distribution is known. We therefore evaluate the performance of a new implemen-tation of the crosswise-model RRT in which the unrelated-questions are replaced by a (non-traceable) virtual random-izing device.
2 Data and Methods
2.1 Online survey on cheating in exams and plagiarism
We conducted an online student survey with a
random-ized experimental design to test and compare the diff
er-ent sensitive-question techniques (Höglinger, Jann, &
Diek-mann,2014). The survey was implemented using the EFS
Survey 8.0 platform by Globalpark AG (see www.unipark.
de). It was administered in spring 2011 to all Bachelor’s and Master’s degree students enrolled at two major Swiss univer-sities, the University of Bern and ETH Zurich. Students re-ceived an invitation email with a unique access link to a ques-tionnaire on “Exams and written assignments” that included, among other questions, five sensitive questions. These ques-tions covered behaviors such as copying from other students in an exam or handing in a plagiarized paper. Table 1 lists the five sensitive questions in the order they were presented to the respondents.
For details on the questionnaire development (includ-ing several rounds of cognitive and quantitative pretest(includ-ing) and fieldwork see the data documentation (Höglinger et al., 2014). In total, 19,410 students were invited, 6,491 pleted the interview, and 863 started the survey without com-pleting it (about half only looked at the first page of the ques-tionnaire). Excluding the incomplete interviews, the overall
response rate was 33.4% (RR1, AAPOR, 2011).2 Median
response time for the interviews was 12 minutes.
In the subsequent analysis we include all respondents who completed their interview at least to the point where the sen-sitive questions began (6,701 of 7,354 students). We also exclude the 392 respondents who skipped all sensitive ques-tions because they had not yet had an exam and did not yet hand in a paper (or, in 4 cases, because of a technical
failure). Furthermore, we exclude 272 respondents whose mother tongue is not German and who did not assess their
German to be at least “good”.3 The resulting sample size is
6,037.
2.2 Experimental conditions
Respondents were randomly assigned to one of six experi-mental conditions: direct questioning, one of two implemen-tations of the forced-response RRT, an implementation of the unrelated-question RRT, or one of two implementations of the crosswise-model RRT. Table 2 provides an overview of the six experimental conditions and their sample sizes. The wording of the sensitive questions was identical in all con-ditions. Due to item non-response and because not all re-spondents had to answer all sensitive questions (e. g., if they
did not yet hand in a paper) sample sizes slightly differ by
experimental condition and question (available sample sizes per experimental condition are between 963 and 983 respon-dents for the items on behavior in exams and between 710 and 725 respondents for the items on plagiarism).
The direct questioning condition (DQ) served as a
bench-mark for the evaluation of the different RRT variants. A
screen announcing several sensitive questions, stating the im-portance of honest answers for the success of the study, and providing a privacy assurance statement, preceded the sen-sitive questions. The five sensen-sitive questions (see table 1) then followed one by one on separate screens. Each question could be answered with “yes” or “no”.
The first variant of the RRT (“FR Wheel”) used a
sym-metric forced-response design (Boruch,1971; Greenberg et
al., 1969) and a virtual random wheel as randomizing
de-vice.4 First, a screen announcing several sensitive questions
2At the University of Bern, the response rate was considerably lower (28.9% of 8,610 invited students) than at ETH Zurich (37.1% of 10,800 invited students). At the University of Bern, due to data protection regulation, the student administration office submitted the invitations. Reminder emails were not possible. At ETH Zurich, the research team submitted the invitations. A reminder email was sent to students who did not respond within three weeks. The diff er-ence in response rates is due to the effect of the reminder email. The sample at ETH Zurich includes 200 observations from the last quan-titative pretest, as a random sample was used for the pretest and no changes were made to the design and questionnaire after the pretest. Excluding these observations does not change our findings (results without these observations are available in the online supplement).
3The survey was only available in German and given the com-plexity of the instructions to the sensitive-question techniques we believe that it is sensible to exclude respondents whose German is poor. However, including these observations in the analysis does not change our main findings (results available in the online supple-ment).
4In a symmetric design the forced response can be either “yes” or “no”. Such a design seems to be preferable over an asymmet-ric design, in which the forced response is always “yes” (or
al-SENSITIVE QUESTIONS IN ONLINE SURVEYS: AN EXPERIMENTAL EVALUATION OF DIFFERENT IMPLEMENTATIONS OF RRT AND CM 175
Table 1
Sensitive questions on student misconduct (translated from German)
Item Wording
Copying from other students in exam In your studies, have you ever copied from other students
during an exam?
Using crib notes in exam In your studies, have you ever used illicit crib notes in an
exam (including notes on mobile phones, calculators or similar)?
Taking drugs to enhance exam performance In your studies, have you ever used prescription drugs to
enhance your performance in an exam?
Including plagiarism in paper In your studies, have you ever handed in a paper
contain-ing a passage intentionally adopted from someone else’s work without citing the original?
Handing in someone else’s paper In your studies, have you ever had someone else write
a large part of a submitted paper for you or have you handed in someone else’s paper as your own?
Table 2
Experimental conditions and number of observations
Experimental condition Design Randomizing device N
DQ direct questioning 1004
FR Wheel forced-response RRT virtual random wheel 1010
FR Number forced-response RRT pick-a-number device 1014
UQ Benford unrelated-question RRT Benford procedure and unrelated question 998
CM Question crosswise-model RRT unrelated question 1008
CM Number crosswise-model RRT pick-a-number device 1003
and the use of a special technique to guarantee respondents’ privacy was displayed. Then, the procedure of the sensitive-question technique and how it protects respondents’ privacy was explained. The respondents then had to answer a train-ing question about whether they had ever ridden public tran-sit without paying the fare, which was followed by a screen with additional explanations on how the RRT protects the respondents’ answers. After that, the five sensitive questions followed one by one on separate screens.
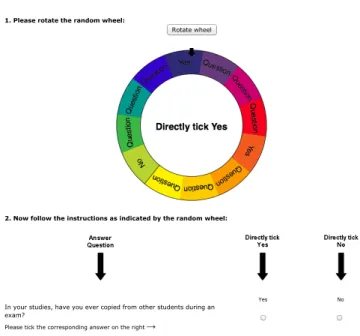
For each question, respondents had to apply a virtual ran-dom wheel to generate a ranran-dom instruction (figure 1). After stopping at a random position, the resulting instruction (“An-swer Question”, “Directly tick Yes”, or “Directly tick No”) was displayed in the middle of the wheel (the wheel could
only be spun once).5
The virtual random wheel corresponds to the classic spin-ner used in some early variants of the RRT (see Fox & Tracy, 1986, p. 39). Peeters (2005) (also see Peeters,
Lensvelt-Mulders, & Lasthuizen,2010) presented a first online
imple-mentation of such a spinner. Because the outcome of a virtual random wheel could easily be tracked or even predetermined (it was not in our application), we would expect that respon-dents do not trust the virtual random wheel. The same prob-lems exist with virtual dice or coins, which have been used
frequently in past studies (Coutts & Jann, 2011;
Lensvelt-Mulders, van der Heijden, Laudy, & van Gils, 2006;
Sni-jders & Weesie, 2008). We included this condition in our
study to evaluate empirically whether respondents actually do mistrust such a virtual randomizing device.
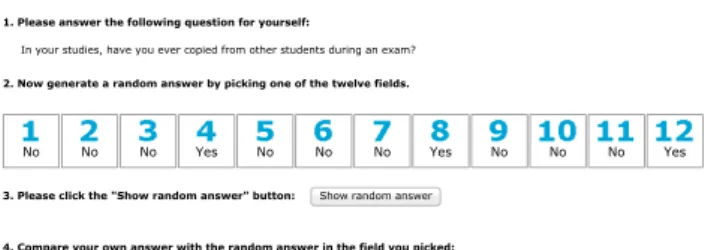
For our second variant of the forced-response RRT (“FR Number”) we developed a new randomizing device that is more credible than the virtual random wheel because it can-not be tracked. Apart from the randomizing device, “FR Number” was identical to “FR Wheel”. The new pick-a-number randomizing device worked as follows: Respondents were presented twelve fields on the screen, numbered from 1 to 12. They were told to privately choose a field and mem-orize their choice (without clicking on it). Then, they were told to click a “Show instructions” button to uncover the in-structions hidden within the fields and follow the instruction
ways “no”, depending on context) (Ostapczuk, Moshagen, Zhao, & Musch,2009).
5Respondents were randomized between a lower privacy pro-tection scheme and a higher privacy propro-tection scheme (9 “Answer Question” sectors versus 8 “Answer Question” sectors). Similar privacy protection variations were employed for the other RRT im-plementations. Results for the two protection schemes were very similar. We therefore do not report results from separate analyses.
176 MARC HÖGLINGER, BEN JANN AND ANDREAS DIEKMANN
Question 1
1. Please rotate the random wheel:
Rotate wheel
2. Now follow the instructions as indicated by the random wheel:
Yes No
In your studies, have you ever copied from other students during an exam?
Please tick the corresponding answer on the right →
Back Forward
Survey file:///Users/jann/Documents/Forschung/rrt/projects/plagiaris...
1 of 1 28/03/14 16:38
Figure 1. Screenshot of the forced-response random wheel implementation (“FR Wheel”)
Question 1
1. Please pick one of the twelve fields.
2. Now click the "Show instructions" button: Show instructions
3. Please follow the instruction displayed in the field you picked:
Yes No
In your studies, have you ever copied from other students during an exam? Please tick the corresponding answer on the right→
Back Forward Answer
Question Directly tickYes QuestionAnswer QuestionAnswer QuestionAnswer Directly tickNo QuestionAnswer QuestionAnswer QuestionAnswer Directly tickYes QuestionAnswer QuestionAnswer
Survey file:///Users/jann/Documents/Forschung/rrt/projects/plagiaris...
1 of 1 12/18/13 17:09
Figure 2. Screenshot of the forced-response pick-a-number implementation (“FR Number”)
Please generate a random number that determines whether you have to answer question A or question B on the subsequent screens:
1. For this purpose, think of an acquaintance of yours who doesn't live in your household and whose address and house number you know.
2. Take the first digit of this person's house number (for instance "3" for number 3, number 37, or number 348).
3. Memorize this digit - it is your personal random number for the following questions.
Back Forward
Survey file:///Users/jann/Documents/Forschung/rrt/projects/plagiaris...
1 of 1 28/03/14 16:40
Figure 3. Screenshot of the unrelated-question Benford im-plementation (“UQ Benford”), screen 1
Question 1
Please answer question A or question B according to your random number: If your random number is 1, 2, 3, or 4 →
A In your studies, have you ever copied from other students during an exam?
If your random number is 5, 6, 7, 8, or 9 →
B Is your mother's birthday in the first half of the year (January to June)?
(If you don't know, please take the birthday of another person you know.)
Yes No
Back Forward
Survey file:///Users/jann/Documents/Forschung/rrt/projects/plagiaris...
1 of 1 12/18/13 17:09
Figure 4. Screenshot of the unrelated-question Benford im-plementation (“UQ Benford”), screen 2
that appeared in the field they chose (figure 2). As above, possible instructions were “Answer Question”, “Directly tick Yes”, or “Directly tick No”. The instructions were random-ized across fields.
Our implementation of the unrelated-question RRT (“UQ Benford”) used a design with the Benford distribution of the
first digits of house numbers as a randomizing device.6 In
a first step, respondents were asked to think of an acquain-tance and use the first digit of this person’s house number as their personal random number (figure 3). Then, for each sensitive item, respondents were asked to either answer the sensitive question or answer an unrelated auxiliary question,
depending on their personal random number (figure 4).7
Diekmann (2012) provides empirical evidence that first digits of house numbers provided by respondents follow “Benford’s Law”. According to the law, for example, the probability of 1, 2, 3, or 4 is 0.699. These probabilities are likely to be underestimated by respondents, so that the pri-vacy protection by the procedure might be perceived higher than it actually is (called the “Benford illusion” by
Diek-mann).8
Our first implementation of the crosswise-model RRT (“CM Question”) used an unrelated-question design as em-ployed in Jann et al. (2012). For each sensitive item, re-spondents were presented two questions at the same time, the sensitive question and an unrelated non-sensitive ques-tion. Respondents were then instructed to indicate whether their answers to the two questions were the same (both “yes”
or both “no”) or different (one “no”, the other “yes”) (figure
5).9
Our second implementation of the crosswise-model RRT (“CM Number”) was analogous to “FR Number”, except that random answers (“Yes” or “No”) were included in the fields instead of instructions for the forced-response RRT. Respon-dents were told to privately choose a field (without clicking
6See Diekmann (2012) for a first application of the Benford dis-tribution as a simple RRT randomizing device. Greenberg et al. (1969) first proposed the unrelated-question design for the RRT. For an overview see Fox and Tracy (1986).
7The auxiliary questions asked whether one’s mother’s birthday was in the first half of the year, an even-numbered month, the first half of the month, an even-numbered day, or in an even-numbered year. They were randomly paired with the sensitive questions for each respondent. See the data documentation for details (Höglinger et al.,2014).
8Using two dice as randomizing device is a similar strategy since many respondents erroneously assume a uniform distribution of the added outcomes (Moriarty & Wiseman,1976).
9Again, the non-sensitive questions were randomly paired with the sensitive questions for each respondent. The questions asked about the mother’s or father’s birthday being in a specific part of the year or a in specific part of the month, or about the last digit of the parent’s phone number. See the data documentation for details (Höglinger et al.,2014).
SENSITIVE QUESTIONS IN ONLINE SURVEYS: AN EXPERIMENTAL EVALUATION OF DIFFERENT IMPLEMENTATIONS OF RRT AND CM 177
Question pair 1
Question A: Is your mother's birthday in January or February?
(If you don't know, please take the birthday of another person you know.)
Question B: In your studies, have you ever copied from other students during an exam?
Compare your answers to the two questions: Are the answers the same or different? same (both Yes or both No)
different (one Yes, and the other No)
Back Forward
Survey file:///Users/jann/Documents/Forschung/rrt/projects/plagiaris...
1 of 1 12/18/13 17:08
Figure 5. Screenshot of the unrelated-question crosswise-model implementation (“CM Question”)
Question 1
1. Please answer the following question for yourself:
In your studies, have you ever copied from other students during an exam?
2. Now generate a random answer by picking one of the twelve fields.
3. Please click the "Show random answer" button: Show random answer
4. Compare your own answer with the random answer in the field you picked: Are the answers the same or different?
same (both Yes or both No) different (one Yes, and the other No)
Back Forward
No No No Yes No No No Yes No No No Yes
Survey file:///Users/jann/Documents/Forschung/rrt/projects/plagiaris...
1 of 1 12/18/13 17:08
Figure 6. Screenshot of the pick-a-number crosswise-model implementation (“CM Number”)
on it) and then press a button to uncover the random answers in the fields. They then had to indicate whether the random
answer in the field they chose was the same or different than
their answer to the sensitive question (figure 6).
2.3 Data analysis
Analysis of data collected by the RRT can be
accom-plished by means of simple variable transformations. LetY
be the observed outcome variable withY =1 if a respondent
answers “yes” (or “the same” in the crosswise-model RRT)
andY = 0 if a respondent answers “no” (or “different” in
the crosswise-model RRT). Likewise, letS be the sensitive
item withS =1 if the sensitive item applies andS =0 else.
In the forced-response RRT, the respondents are instructed
to answer “yes” with known probability pyes, answer “no”
with known probabilitypno, or answer the sensitive question
truthfully with probability (1−pyes−pno). Assuming that
respondents comply with the instructions, the overall proba-bility of a “yes” answer in the forced-response RRT is
Pr (Y=1)=(1−pyes−pno) Pr (S =1)+pyes, (1)
where Pr(S = 1) is the unknown probability that the
sensi-tive item applies. Solving for Pr(S = 1) shows that taking
the mean of
˜
Y= Y−p
yes
(1−pyes−pno) (2)
provides a consistent estimate of Pr(S =1). The same
trans-formation can also be employed for data from the
unrelated-question RRT, settingpyes=pupyes,uandpno=pu(1−pyes,u),
wherepuis the known probability of being directed to the
un-related question andpyes,uis the known probability of a “yes”
answer to the unrelated question. Finally, for the crosswise-model RRT, the corresponding transformation is
˜
Y =Y+p
yes,u−1
(2pyes,u−1) (3)
wherepyes,uis again the probability of a “yes” answer to the
unrelated question.10
Standard methods can be used to estimate expected values from these transformed variables, yielding the same point estimates and standard errors as the basic formulas usually
found in the RRT literature (Chaudhuri,2011; Fox & Tracy,
1986). An equivalent approach, followed in the analyses
be-low, is to estimate a least-squares regression on ˜Y across the
whole sample including dummy variables for the different
sensitive-question techniques (with ˜Y = Y for direct
ques-tioning), employing heteroscedasticity robust formulas for
standard errors (Jann, 2008). Such an integrated model is
convenient because it readily provides tests for differences
among techniques. Furthermore, additional covariates can
be included in the model to analyze effects of predictors of
sensitive behaviors.11
3 Results 3.1 Question sensitivity
A prerequisite for the validity of our evaluation of the dif-ferent sensitive question techniques is that respondents per-ceive the questions we asked as sensitive. As mentioned above, the universities at which our study was conducted
10As in the original Warner scheme, pyes,u must be unequal 0.5 for the crosswise-model estimate to be identified.
11An alternative approach would be to use suitably modified maximum-likelihood logistic regression (Jann, 2005; Maddala,
1983, also see Jann et al., 2012, for the crosswise-model RRT). We prefer the linear regression approach here because it imposes fewer assumptions about the data generation process. For exam-ple, logistic regression may break down if respondents do not com-ply with the RRT instructions. Yet another approach is nonlinear least-squares estimation (e. g. Cameron & Trivedi,2005, chapter 5.8). Using maximum-likelihood logistic regression or nonlinear least-squares estimation does not change our main findings (results available in the online supplement). Interesting extensions to these approaches are so-called cheating-correction methods that exploit variations in design parameters (e. g. Clark & Desharnais, 1998; Moshagen & Musch,2012; van den Hout, Böckenholt, & van der Heijden,2010) or response patterns across multiple items (Böcken-holt & van der Heijden,2007; de Jong, R., & Stremersch,2012) to identify the proportion of respondents who do not comply with the RRT instructions, and correct the prevalence estimates accordingly. We do not employ such methods here because the variation in de-sign parameters is too low in our study for the cheating-correction estimates to be efficient and also because additional assumptions are required (such as, e. g., that the variation in design parameters has no effect on the willingness to provide a truthful answer).
178 MARC HÖGLINGER, BEN JANN AND ANDREAS DIEKMANN
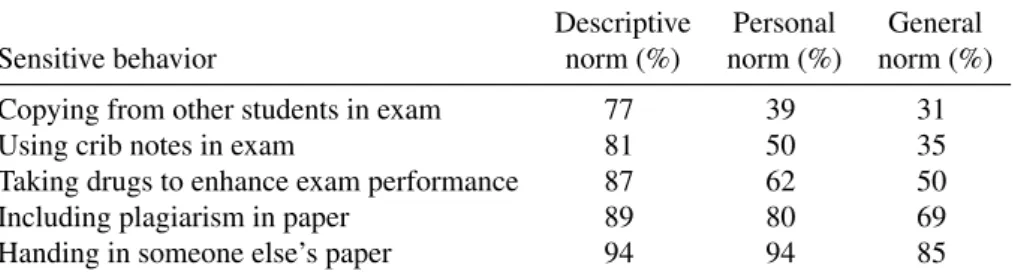
have formal rules about how to sanction cheating on exams and plagiarism. The sanctions can be severe and the stu-dents seem to be well aware of that fact (for example, 26% of our respondents believe that they will be expelled from their studies if they get caught plagiarizing in a Bachelor’s or Master’s thesis; overall, serious sanctions are expected by 89% of the respondents). We therefore assume that the threat of disclosure is of serious concern to our respondents. Fur-thermore, strong norms against academic misconduct appear to exist among the respondents so that socially desirable re-sponses can be expected. Table 3 provides evidence on three
dimensions of norm prevalence (see, e. g., Bicchieri,2006):
the percentage of students who the respondents believe have never engaged in the specific behaviors (perceived descrip-tive norm), the percentage of respondents who think the spe-cific behaviors are bad or very bad (personal norm), and the percentage of respondents who believe that most others con-sider the specific behaviors as bad or very bad (perceived general norm).
The results in table 3 reveal a consistent ordering of the five sensitive questions. Compared to the other behaviors, compliance to norms against copying from other students and using crib notes is perceived as relatively low, with an aver-age estimated percentaver-age of students who never engaver-aged in these behaviors of 77% and 81%, respectively. Furthermore, only 39% to 50% of respondents consider these behaviors as bad or very bad, and 31% to 35% of respondents believe that most others consider these behaviors as bad or very bad. For plagiarism, perceived norm compliance is substantially higher (89% and 94%) and the vast majority of respondents think that these behaviors are bad or very bad (80% and 94%) and that most others consider these behaviors as bad or very bad (69% and 85%). The prevalence of the norm against tak-ing drugs to enhance exam performance, for which no formal sanctions are defined at the two universities, lies between the prevalence of the norms against exam cheating and plagia-rism. About 60% of respondents consider this behavior as bad or very bad.
In sum, although differences exist, in particular between
exam cheating and plagiarism, there seem to be significant norms against the behaviors we study. Together with the pos-sible sanctions in case of disclosure (for four of the five ques-tions) we therefore suppose that the questions in our survey appeared sensitive to at least a substantial proportion of the respondents. For the more sensitive items (plagiarism), we
expect a larger share of norm-offenders to misreport so that
the sensitive question techniques, should they be successful in reducing misreporting, will have a stronger (relative)
ef-fect. Yet, because the true share of norm-offenders is likely
lower for these behaviors, the observable absolute effect of
the sensitive question techniques may be lower than for the less sensitive items.
3.2 Prevalence estimates by experimental conditions
Assuming that respondents only falsely deny but never falsely admit a sensitive behavior, higher prevalence esti-mates from the sensitive-question techniques than from di-rect questioning (DQ) indicate that more respondents an-swered truthfully. Hence, relying on the “more-is-better”
assumption (Lensvelt-Mulders et al., 2005) we interpret a
positive difference to DQ as evidence for a technique’s
su-perior validity. We will come back to this assumption in the discussion.
The left panel in figure 7 depicts the point estimates of the proportion of respondents admitting a particular sensitive behavior and the corresponding 95%-confidence intervals by experimental condition (also see table A1 in the appendix).
Differences in the prevalence estimates between a particular
RRT implementation and DQ are shown in the right panel. The crosswise-model RRT implementation using unrelated questions (“CM Question”) produced the highest estimates of all implementations for four out of the five items.
Fur-thermore, the difference between “CM Question” and DQ is
substantial for all items and highly significant for three of them (“copying from others”, “using crib notes”, and “tak-ing drugs to enhance performance”). The size of the absolute
differences between “CM Question” and DQ follows a rough
pattern with larger differences for high prevalence items and
smaller differences for low prevalence items. Such a
pat-tern is consistent with what we would expect from a success-ful sensitive-question technique that manages to elicit truth-ful answers from respondents who misreport when asked directly. The results for the second implementation of the crosswise-model RRT that used the pick-a-number device to generate a random answer (“CM Number”) are less favor-able. The DQ estimates are substantially exceeded only for two items (statistically significant in just one case), the re-sults for the remaining three items are very similar to the DQ estimates.
Results for the two forced-response RRT implementations (“FR Wheel” and “FR Number”) are disillusioning. In only two out of ten comparisons did these implementations yield a significantly higher prevalence estimate than DQ (“RRT Wheel” for “copying from others”, “RRT Number” for “us-ing crib notes”). On the other hand, there are three cases in which one of these implementations produced significantly lower estimates than DQ. In fact, in these three cases the prevalence estimate is negative (significantly negative in one
case).12 This suggests that there was substantial
noncompli-ance with the RRT instructions, that is, that many
respon-12Negative estimates do not make sense, of course, and are a re-sult of the data violating our assertion about how they came about. Forcing the prevalence estimate into [0,1] could easily be achieved (e. g. using maximum-likelihood techniques; see footnote 11), but doing so would obscure the fact that there is a problem with the data.
SENSITIVE QUESTIONS IN ONLINE SURVEYS: AN EXPERIMENTAL EVALUATION OF DIFFERENT IMPLEMENTATIONS OF RRT AND CM 179
Table 3
Norms against academic misconduct
Descriptive Personal General
Sensitive behavior norm (%) norm (%) norm (%)
Copying from other students in exam 77 39 31
Using crib notes in exam 81 50 35
Taking drugs to enhance exam performance 87 62 50
Including plagiarism in paper 89 80 69
Handing in someone else’s paper 94 94 85
Descriptive norm (perceived norm compliance): mean of respondents’ estimate of the percent-age of students who never engpercent-aged in the behavior; Personal norm: percentpercent-age of respondents who think the behavior is rather bad or very bad; General norm: percentage of respondents who believe that most people think the behavior is rather bad or very bad;Nbetween 5871 and 5921
18 23 19 17 30 25 9 11 14 13 18 11 3 -1 -2 5 15 5 3 1 3 8 8 8 2 0 -4 2 6 0 5 1 -1 12 7 2 5 4 9 2 -4 -5 1 12 1 -2 0 5 5 6 -1 -6 1 5 -1 copying from other students in exam using crib notes in exam taking drugs to enhance exam performance including plagiarism in paper handing in someone else's paper DQ FR Wheel FR Number UQ Benford CM Question CM Number DQ FR Wheel FR Number UQ Benford CM Question CM Number DQ FR Wheel FR Number UQ Benford CM Question CM Number DQ FR Wheel FR Number UQ Benford CM Question CM Number DQ FR Wheel FR Number UQ Benford CM Question CM Number -10 0 10 20 30 40 -10 -5 0 5 10 15 20
Prevalence estimate in % Difference to DQ
Figure 7. Prevalence estimates and difference to DQ by experimental condition
dents answered “no” even though the procedure instructed them to respond “yes.” Unfortunately, due to the nature of the RRT, it is not possible to identify noncompliance with the RRT instructions at the individual level, which hampers an in-depth analysis of instruction noncompliance. Finally, the unrelated-question RRT implementation (“UQ Benford”) yielded higher estimates than DQ for two items (statistically significant in one case), and produced very similar estimates
to DQ for the remaining three items.13
In sum, the unrelated-questions crosswise-model RRT (“CM Question”) consistently produced higher prevalence estimates than direct questioning for all sensitive items. The alternative implementation of the crosswise-model RRT
13As mentioned above, the design parameters of the sensitive question techniques were varied among respondents, leading to somewhat different levels of respondent protection. We found no evidence whatsoever that these variations affected the respondents’ answers to the sensitive questions (results available in the online supplement). However, we do find some weak evidence that the level of respondent protection affected the self-reported trust in the privacy protection by the survey (correlation:r=0.032,p=0.026) and the perceived protection of answers by the special technique (correlation: r=0.034,p=0.019) (see below for details on these variables). For “CM Number”, we additionally varied whether ran-dom answer “yes” or “no” was more frequent. Although formally arbitrary, we find weak evidence that this variation affected respon-dents’ behavior. Prevalence estimates tended to be somewhat higher
180 MARC HÖGLINGER, BEN JANN AND ANDREAS DIEKMANN
(“CM Number”), however, produced substantially higher prevalence estimates for only two out of five items. Preva-lence estimates from the two forced-response RRT imple-mentations are comparable to the direct-questioning esti-mates, or are even lower. This casts serious doubt on the validity of the estimates from the forced-response RRT im-plementations. The unrelated-question RRT implementation (“UQ Benford”) performed similar to “CM Number”.
Com-paring the relative effects of the techniques between sensitive
questions does not offer much insight given the poor overall
performance of most of the techniques. However, relative
effects for the technique with the highest face validity, “CM
Question”, indicate that, as expected, effects are weaker for
the less sensitive questions on cheating in exams (70 to 100% increase in prevalence estimates compared to direct ques-tioning) than for the more sensitive questions on plagiarism
(160 to 300% increase). Surprisingly, however, the effect is
strongest for the question on taking drugs to enhance exam performance (350% increase). Yet, there is too little
statis-tical power to draw firm conclusions about the differences
among these relative effects (an overall test has a p-value of
0.104; among the 10 possible contrasts, only the difference in
relative effects between taking drugs and copying from other
students,p=0.014, and between taking drugs and using crib
notes,p=0.035, are significant at the 5% level).
3.3 Alternate quality criteria
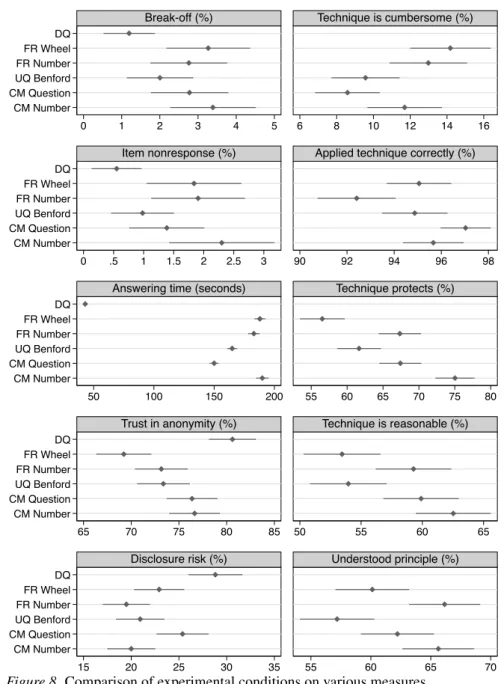
We now turn to the evaluation of the sensitive-question techniques on various alternative quality criteria such as item-nonresponse, ease of use, or respondents’ understand-ing of the procedure. The left panel of figure 8 displays re-sults for quality criteria available for all techniques including direct questioning, the right panel contains results from ad-ditional criteria available only for the RRT implementations (also see table A2 in the appendix).
The RRT places additional burden on respondents, which
might lead to higher break-offrates and item non-response.
In fact, we observe slightly increased break-offrates
(mea-sured as the proportion of respondents who did not com-plete the interview among the respondents who reached the introductory screen for the sensitive questions) from about 1% for DQ to about 2% or 3% for the RRT implementa-tions (although the difference between DQ and “UQ Ben-ford” is not statistically significant). Likewise, we observe slightly increased levels of item-nonresponse (measured as the proportion of sensitive questions that remained unan-swered) from about half a percent for DQ to about 1% or
2% for the RRT implementations (the difference between DQ
and “UQ Benford” again being insignificant). We conclude
that the sensitive-question techniques increase break-offand
item non-response only slightly.
Of greater concern is the fact that all RRT implemen-tations require much more answering time than DQ (third
graph on the left in figure 8). Answering time is measured as the median response time required to complete the five sen-sitive questions, including all screens with instructions and explanations. Using the RRT causes a threefold to fourfold increase in median answering time (around 3 minutes for the whole block) compared to DQ (below 1 minute). Even if we exclude all instruction and training screens, using the RRT still causes a twofold to threefold increase in median answer-ing time compared to DQ (not shown).
A crucial aspect of sensitive-question techniques is that they should increase respondents’ trust in the protection of their privacy. After all, this is the assumed mechanism by which these techniques are supposed to increase honest an-swering. At the end of the interview, we asked the respon-dents about how much they trusted in the protection of pri-vacy by the survey (“Please be honest: How much do you trust in our measures for anonymity and privacy protection of the participants of this survey?”). The fourth graph on the left in figure 8 shows the percentage of respondents who answered “rather much” or “very much.” Levels of self-reported trust were significantly lower for all sensitive-question techniques (around 75%) than for DQ (over 80%). An explanation for this surprising finding might be that there
is a salience effect. The usage of a special technique raises
suspicion and makes respondents aware of privacy concerns they might not have had if asked directly. In a way, using a special technique signals to the respondents that they should,
in fact, be concerned. This crowding-out effect was highest
for the RRT implementation with the virtual random wheel (below 70% trust), which makes sense since this randomiza-tion device is, in fact, not trustworthy. We also asked the respondents about how likely they thought it was that one could discover whether a survey participant engaged in one of the sensitive behaviors (“How likely do you think is it that, based on this survey, one can reconstruct whether a specific participant engaged in one of sensitive behaviors we asked about?”). The bottom graph on the left in figure 8 displays the percentage of respondents who thought that such disclo-sure was “rather likely” or “very likely.” For DQ the percent-age was about 30%, which is significantly higher than for
in the condition in which “yes” was more frequent (p = 0.027 across all five sensitive questions). Note that in “CM Question” we used a design in which always random answer “no” was more frequent. Finally, we checked for differences in response behavior between students of the University of Bern and students of the ETH Zurich, between science students and social science or humanities students, and between males and females. Although some isolated differences do exist, we did not find any evidence for a clear pattern (only 5 of 75 tested interactions between subgroups and questioning techniques were significant, which is hardly more than one would expect by chance; furthermore, these 5 differences did not cluster in any meaningful way; see the online supplement for details). Test-ing for subgroup differences with respect to education or age was not possible due to the homogeneity of the sample.
SENSITIVE QUESTIONS IN ONLINE SURVEYS: AN EXPERIMENTAL EVALUATION OF DIFFERENT IMPLEMENTATIONS OF RRT AND CM 181 DQ FR Wheel FR Number UQ Benford CM Question CM Number DQ FR Wheel FR Number UQ Benford CM Question CM Number DQ FR Wheel FR Number UQ Benford CM Question CM Number DQ FR Wheel FR Number UQ Benford CM Question CM Number DQ FR Wheel FR Number UQ Benford CM Question CM Number 0 1 2 3 4 5 6 8 10 12 14 16 0 .5 1 1.5 2 2.5 3 90 92 94 96 98 50 100 150 200 55 60 65 70 75 80 65 70 75 80 85 50 55 60 65 15 20 25 30 35 55 60 65 70
Break-off (%) Technique is cumbersome (%)
Item nonresponse (%) Applied technique correctly (%)
Answering time (seconds) Technique protects (%)
Trust in anonymity (%) Technique is reasonable (%)
Disclosure risk (%) Understood principle (%)
Figure 8. Comparison of experimental conditions on various measures
the RRT, with percentages between 20% and 25% (with the exception of the unrelated-question implementation of the
crosswise-model RRT, for which the difference to DQ is not
significant; p=0.087). Hence, even though general privacy
concerns were lower among respondents in the DQ condi-tion, they rightly judged the risk of disclosure to be higher in DQ than in the RRT conditions.
The plots on the right in figure 8 display additional results on a number of specific questions answered by respondents in the RRT conditions. We asked the respondents whether the employed technique was cumbersome (“How cumber-some was the application of this special survey technique to you?”), whether they thought that they applied the
tech-nique correctly (“Do you think that you applied the spe-cial survey technique correctly in each case?”), whether they were convinced that the technique protected their answers (“What is your personal opinion: Does the special survey technique provide 100% protection of your answers to the sensitive questions?”), whether they thought that the tech-nique was a reasonable approach to protect respondents’ pri-vacy (“How reasonable do you think is the use if this survey technique to protect the answers of survey participants to sensitive questions?”), and whether they believed that they understood how the technique protects their answers (“Do you understand why the employed survey technique provides 100% protection of your answers?”). The majority of
re-182 MARC HÖGLINGER, BEN JANN AND ANDREAS DIEKMANN
spondents did not find the techniques cumbersome, but the percentage of respondents who answered that the technique was “rather” or “very” cumbersome was slightly higher in the conditions in which an explicit randomization device was employed (about 12% to 14%; “FR Wheel”, “FR Number”, “CM Number”) than in the conditions where no such device was used (between 8% and 10%; “UQ Benford”, “CM Ques-tion”). Furthermore, between 92% and 97% of respondents believed that they applied the technique correctly (“rather” or “definitely”); they seemed to have the least problems with “CM Question”, the most with “FR Number”. The third plot on the right in figure 8 shows the percentage of respon-dents who were convinced that the technique protects their answers (“rather” or “definitely”). As expected, the virtual random wheel was trusted least (57%), but also “UQ Ben-ford” (62%) was trusted significantly less than the other im-plementations (67% to 75%), presumably because many re-spondents did not understand its rationale (see below). Con-sequently, the respondents also deemed these two techniques least reasonable to protect respondents’ privacy (fourth plot on the right in figure 8; shown is the percentage of respon-dents who thought the technique was “rather” or “very” rea-sonable). Finally, only between 57% and 66% of respondents claimed that they understood the rationale behind the tech-niques (“rather” or “definitely”). “UQ Benford” seems to be the implementation that was most difficult to understand.
We also analyzed correlations among the different quality
criteria. Strongest correlations are found among the items measuring general self-reported trust in the survey, whether the technique protects one’s answers, whether the technique was considered reasonable, and whether the principle of the technique was understood. Most notably, understanding
cor-related with general trust (r =0.24), protection (r =0.46),
and reasonableness (r=0.31) (all correlations being highly
significant with p < 0.001; computations based on
di-chotomized items as used for figure 8). This illustrates that a good understanding of a technique’s principle is crucial for developing trust in the technique’s privacy protection, which, we assume, is a precondition for increasing the likelihood of answering truthfully. Due to these associations, we conclude that levels of understanding of about 60% or 65%, as found in
this study, are insufficient. Yet, when regressing the
respon-dents’ answers to the sensitive questions on the level of trust we only find weak evidence for the assertion that trust in-creases the likelihood of admitting sensitive behaviors. Only for “FR Wheel” we find a marginally significant positive
ef-fect of trust (p=0.025; using a joint test across all sensitive
questions).
To test for effects of respondents’ perceptions of the
sen-sitive question techniques on prevalence estimates we ran re-gressions on all self-reported quality criteria. Table 4 sum-marizes the results from these regressions. The only no-table results are that, for “UQ Benford”, perceived
cumber-someness is associated with increased prevalence estimates
(p < 0.001) and correct application is associated with
de-creased prevalence estimates (p = 0.032) and, for “CM
Number”, perceived reasonableness of the technique to pro-tect privacy is associated with decreased prevalence
esti-mates (p = 0.028; using joint tests across all five sensitive
questions). However, we could not find a robust effect of any
of the surveyed quality criteria on prevalence estimates in general, that is, across more than one RRT implementation.
In sum, compared to direct questioning, all RRT imple-mentations come at large costs with respect to answering
time, but increases in break-offrates and item-nonresponse
are only small. Using sensitive question techniques seems to undermine respondents’ general trust in the survey, but at the same time respondents consider the risk of disclosure lower if questioned by the RRT than by direct questioning. Perhaps the most striking result is that only between 57% and 75% of respondents claim that they understood how the RRT protects their answers. However, none of the surveyed subjective evaluation criteria shows a consistent correlation with the propensity to admit a sensitive behavior.
4 Discussion and Conclusions
Three main findings result from our study. First, diff
er-ent implemer-entations of the RRT, even of the same variant
but using different randomizing devices, can produce quite
diverse estimates of sensitive behaviors. It is, therefore, dif-ficult to draw a final conclusion about the RRT based on the evaluation of just one implementation, an aspect that is ig-nored in most studies. The high variability of results across implementations is not very helpful for clarifying whether the RRT is a suitable sensitive question technique for online surveys. However, it clearly shows that drawing final con-clusions based on just one or two implementations might be
premature (e. g. Holbrook & Krosnick,2010).
Second, the forced-response RRT variants (“FR Wheel”, “FR Number”), as implemented in our study, did not yield systematically higher estimates than direct questioning. They even produced negative estimates in some cases. This questions the viability of the forced-response RRT variant for online surveys. The reason for these low or even nega-tive RRT estimates might lie in respondents’ noncompliance with the RRT instructions. More specifically, we assume that many respondents answer “no” even if instructed to provide an automatic “yes,” because they are reluctant to give a false “yes” answer and always answering “no” is obviously the best self-protective answer strategy in the forced-response
RRT. Although a lot of effort has been put into pretesting and
finding good implementations, no convincing evidence could be found that forced-response RRT variants yield more valid estimates than direct questioning. Even a completely anony-mous randomizing device such as the pick-a-number proce-dure did not help to overcome the method’s weaknesses. The
SENSITIVE QUESTIONS IN ONLINE SURVEYS: AN EXPERIMENTAL EVALUATION OF DIFFERENT IMPLEMENTATIONS OF RRT AND CM 183
Table 4
Summary of effects of evaluation criteria on prevalence estimates
DQ FR UQ CM
Wheel Number Benford Question Number N
Trust in anonymity (+) + n.s. n.s. n.s n.s. 5879
Disclosure risk n.s. n.s. n.s. n.s. n.s. n.s 5869
Technique is cumbersome n.s. n.s. +++ n.s. n.s. 4861
Applied technique correctly n.s. n.s. −− n.s. n.s. 4861
Technique protects n.s. n.s. n.s. (–) n.s. 4859
Technique is reasonable n.s. n.s. n.s. n.s. – 4858
Understood principle n.s. n.s. n.s. n.s n.s 4861
Computations based on dichotomized evaluation criteria as used for figure 8; detailed results are available in the online supplement.
+mostly positive;−mostly negative
JointFtest: (±) : p< .1; ±: p< .05; ±±: p< .01; ± ± ±: p< .001; n.s.: not significant.
unrelated-question RRT implementation “UQ Benford” per-formed somewhat better, generating similar estimates as DQ for three items and higher estimates for two items. However, with respect to respondents’ assessment of the technique in terms of understanding, protection, and reasonableness, “UQ Benford” fared among the worst of the techniques we evalu-ated.
Third, the unrelated-question crosswise-model RRT im-plementation (“CM Question”) produced higher prevalence estimates than direct questioning for all sensitive questions (significantly higher in three cases). Assuming the “more-is-better” assumption is valid, “CM Question” succeeded in eliciting more truthful answers to the sensitive questions than direct questioning and, hence, produced more valid es-timates. “CM Question”, therefore, seems to be a promising alternative to conventional RRT variants. Main advantages of the crosswise-model RRT are that no one is forced to provide a “false” answer and that the optimal self-protective answer strategy is far less obvious than for the most other RRT
vari-ants.14 A drawback of the crosswise-model RRT compared
to forced-response or unrelated-question RRT, however, is its
lower statistical efficiency (compare the confidence intervals
in figure 7 or the standard errors in table A1). Another critical point is that results for the crosswise-model RRT implemen-tation employing an explicit randomizing device (“CM Num-ber”) are inconclusive as this implementation yielded higher estimates than DQ for only two items (statistically significant in one case). That is, also for the crosswise-model RRT the details of implementation seem to matter.
That the unrelated-question crosswise-model RRT per-formed well in the sense that it generated higher estimates of sensitive behaviors than DQ did not come as a big sur-prise given the preliminary positive findings of some earlier studies. However, whether its results can be considered more valid than the results from DQ depends on the viability of the “more-is-better” assumption, a limitation shared with most
other studies on sensitive question techniques. Higher esti-mates are a necessary condition for the validity of a tech-nique’s results if – as suggested by a number of validation
studies (e. g. Kreuter et al., 2008; Preisendörfer & Wolter,
2014; van der Heijden et al.,2000) – DQ is affected by
un-derreporting. Yet, higher estimates may not be sufficient. It
is possible that higher estimates come about by some other mechanisms than an increase in the share of respondents who answer truthfully. In fact, two recent validation studies
pro-vide epro-vidence that the crosswise-model RRT may be affected
by “false positives” (Höglinger & Diekmann,forthcoming;
Höglinger & Jann,2016). That is, the higher prevalence
esti-mates by the crosswise-model RRT found in our study may, at least in part, be due to respondents who falsely admit the sensitive behavior if interviewed by this technique. For ex-ample, if many respondents are confused by the instructions of the crosswise-model RRT and provide random answers, prevalence estimates will be biased towards 50% (although, in this case, we would expect a percentage-point deviation from the DQ results that is more or less constant across items, a pattern which is not observed in our study). Therefore, even though good opportunities for validation are notoriously hard to find, the next step in this research program should be a study in which respondents’ answers are compared to known true values. Furthermore, a limitation of our study is that it is based on a sample of university students and results may not be generalizable to other populations. In particular, prob-lems with the RRT due to lack of understanding of the proce-dure and its instructions may be more pronounced in general population surveys, in which the average respondent’s
edu-14Detection of the optimal self-protective answer strategy would require a thorough understanding of Bayesian updating and the crosswise-model principle by respondents. Ifpyes,u<0.5, the opti-mal self-protective answer is “the same”; ifpyes,u>0.5, the optimal self-protective answer is “different”.
184 MARC HÖGLINGER, BEN JANN AND ANDREAS DIEKMANN
cational level is lower than in our study. On the other hand, our results do not seem to depend on the University, field of study, or gender of the respondent (see footnote 13).
Eliciting truthful answers to sensitive questions remains a big challenge in online surveys. Although levels of mis-reporting seem to be somewhat lower than in interviewer-assisted surveys, the available validation studies show that also in online mode misreporting is substantial. Better strate-gies than direct questioning are necessary. That RRT
ap-proaches offer a viable solution cannot be confirmed without
qualification by our study. However, the development and testing of such techniques in online mode is still at an early stage. Our study showed how resulting prevalence estimates
depend on implementation details. That results differ so
much by implementation appears discouraging at first sight. In our view, however, it indicates that the RRT does have po-tential, if a good implementation can be found. Future stud-ies should hence focus on identifying the factors that render an RRT implementation successful. In our study we empha-sized the choice of the randomizing device and the basic RRT design. Our results suggest that using an explicit random-izing device such as a virtual random wheel or the pick-a-number device does not work so well and that using unrelated questions might be preferable. Moreover, for all evaluated implementations we found rather low levels of trust and un-derstanding by respondents. In our view, this is problematic because trust and understanding are essential preconditions for increasing the likelihood of respondents answering truth-fully. Overall, from our results we conclude that a successful implementation should be nontechnical, easy to understand, and simple to apply, that no respondents should be forced into providing “false” positive answers, and that no obvious self-protective answering strategy should be available.
Acknowledgements
The authors thank Debra Hevenstone for her comments on an earlier draft of this article. This research was sup-ported by the German Research Foundation (DFG) Priority Program Number 1292 on “Survey Methodology”, grant DI
292/5. An online supplement for this article as well as
repli-cation materials are provided at the journal’s website. The dataset and the study documentation can be retrieved from
https://ideas.repec.org/p/bss/wpaper/8.html(Höglinger et al.,
2014).
References
AAPOR. (2011).Standard definitions. Final dispositions of
case codes and outcome rates for surveys. 7th edi-tion. Lenexa, KS: The American Association for Pub-lic Opinion Research.
Bicchieri, C. (2006).The grammar of society. The nature and
dynamics of social norms. New York: Cambridge Uni-versity Press.
Böckenholt, U. & van der Heijden, P. G. M. (2007). Item randomized-response models for measuring noncom-pliance: risk-return perceptions, social influences, and
self-protective responses.Psychometrika,72(2), 245–
262.
Boruch, R. F. (1971). Assuring confidentiality of responses
in social research: a note on strategies.The American
Sociologist,6(4), 308–311.
Bowers, W. J. (1964).Student dishonesty and its control in
college. New York: Columbia University.
Cameron, A. C. & Trivedi, P. K. (2005).Microeconometrics:
methods and applications. Cambridge, New York: Cambridge University Press.
Chaudhuri, A. (2011). Randomized response and indirect
questioning techniques in surveys. Boca Raton, F:
Chapman and Hall/CRC.
Clark, S. J. & Desharnais, R. A. (1998). Honest answers to embarrassing questions: detecting cheaters in the
randomized response model.Psychological Methods,
3(2), 160–168.
Couper, M. P. (2000). Web surveys: a review of issues
and approaches.The Public Opinion Quarterly,64(4),
464–494.
Coutts, E. & Jann, B. (2011). Sensitive questions in on-line surveys: experimental results for the randomized response technique (RRT) and the unmatched count
technique (UCT).Sociological Methods &Research,
40(1), 169–193.
Crown, D. F. & Spiller, M. S. (1998). Learning from the lit-erature on collegiate cheating: a review of empirical
research.Journal of Business Ethics,17(6), 683–700.
de Jong, M. G., Pieters, R., & Fox, J.-P. (2010). Reducing social desirability bias through item randomized re-sponse: an application to measure underreported
de-sires.Journal of Marketing Research,47(1), 14–27.
de Jong, M. G., R., P., & Stremersch, S. (2012). Analysis of sensitive questions across cultures: an application of multigroup item randomized response theory to
sex-ual attitudes and behavior.Journal of Personality and
Social Psychology,103(3), 543–546.
Diekmann, A. (2012). Making use of “Benford’s law” for the
randomized response technique.Sociological Methods
&Research,41(2), 325–334.
Edgell, S. E., Himmelfarb, S., & Duchan, K. L. (1982). Va-lidity of forced responses in a randomized response
model.Sociological Methods&Research,11(1), 89–
100.
Fox, J. A. & Tracy, P. E. (1986). Randomized response:
a method for sensitive surveys. Newbury Park, CA: Sage.
Greenberg, B. G., Abul-Ela, A.-L. A., Simmons, W. R., & Horvitz, D. G. (1969). The unrelated question