Toward mapping surface deformation in three dimensions using InSAR
Tim J. Wright,1Barry E. Parsons,1 and Zhong Lu2
Received 12 October 2003; revised 25 November 2003; accepted 28 November 2003; published 14 January 2004.
[1] One of the limitations of deformation measurements made with interferometric synthetic aperture radar (InSAR) is that an interferogram only measures one component of the surface deformation—in the satellite’s line of sight. We investigate strategies for mapping surface deformation in three dimensions by using multiple interferograms, with different imaging geometries. Geometries for both current and future missions are evaluated, and their abilities to resolve the displacement vector are compared. The north component is always the most difficult to determine using data from near-polar orbiting satellites. However, a satellite with an inclination of about 60/120would enable all three components to be well resolved. We attempt to resolve the 3D displacements for the 23 October 2002 Nenana Mountain (Alaska) Earthquake. The north component’s error is much larger than the signal, but proxies for eastward and vertical motion can be determined if the north component is assumed negligible. Inversions of hypothetical coseismic interferograms demonstrate that earthquake model parameters can be well recovered from two interferograms, acquired on ascending and descending tracks. INDEX TERMS: 1243 Geodesy and Gravity: Space geodetic surveys; 1242 Geodesy and Gravity: Seismic deformations (7205); 1294 Geodesy and Gravity: Instruments and techniques; 6969 Radio Science: Remote sensing;
KEYWORDS:.Citation: Wright, T. J., B. E. Parsons, and Z. Lu (2004), Toward mapping surface deformation in three dimensions using InSAR, Geophys. Res. Lett., 31, L01607, doi:10.1029/ 2003GL018827.
1. Introduction
[2] In the past decade, InSAR has proved a powerful technique for mapping surface deformation at an unprece-dented spatial resolution [Massonnet and Feigl, 1998;
Bu¨rgmann et al., 2000]. A limiting factor in interpreting interferograms is that they are only sensitive to surface movements towards or away from the satellite.Fialko et al.
[2001] recovered the 3D displacements for the 1999 Hector Mine earthquake using ERS interferograms acquired on ascending and descending passes, and surface-parallel motion calculated by correlating the SAR amplitude images. This method is only effective for events such as large earthquakes where the deformation signal is large—they estimate an error of 10 cm on their north component of deformation. Here we investigate ways to resolve 3D surface displacement fields by using multiple interfero-grams. We use geometries that are possible with current,
planned and proposed SAR missions, and discuss the implications for future image acquisition strategies.
[3] In addition, we attempt to resolve the 3D surface displacements for the 23 October 2002, Nenana Mountain (Alaska) earthquake, which to our knowledge is the first earthquake for which interferograms with 4 different view-ing geometries have been acquired in the epicentral area. One important question is whether 3D displacements are necessary. We investigate whether the determination of simple earthquake models is improved by the use of interferograms with more than 2 viewing geometries.
2. Determining 3D Displacements
[4] Before determining 3D displacements, it is necessary to detrend all the interferograms, removing orbital errors, and to determine a reference phase level. In many cases, this can be done using data in the far field of the interferogram, away from the deforming area. In the subsequent discussion, calculations are performed on a pixel by pixel basis.
[5] Let p^ be the unit row vector (px, py, pz), pointing
from the ground to the satellite in a local east; north; up reference frame. The observed range change r, with the positive being equivalent to motion away from the satellite in its line of sight, is then given byr=^pu, whereuis the column vector (ux, uy,uz)T, containing the vector
compo-nents of displacement in the same reference frame. [6] Suppose now that a point on the ground is observed in interferograms with four different look directions, for instance, with the antenna looking both right and left on both ascending and descending passes, or for two different incidence angles on ascending and descending passes. DefiningR= (r1,r2,r3,r4)T, whereriare the line-of-sight
displacements for the different look directions, then R =
Pu wherePis the 4 3 matrix given by
P¼ ^ p1 ^ p2 ^ p3 ^ p4 0 B B @ 1 C C A ð1Þ
If the covariance matrix for errors in the observed range changes isR, then the weighted least-squares (maximum likelihood) solution foru is
^
u¼ PT2R1P1PT2R1R ð2Þ and the covariance matrix for the estimated vector compo-nents is
2u¼ PT2R1P
1
ð3Þ 1COMET and Department of Earth Sciences, Oxford University, UK.
2
USGS, EROS Data Center, SAIC, South Dakota, USA. Copyright 2004 by the American Geophysical Union. 0094-8276/04/2003GL018827$05.00
In the case where we assume that errors in range change are independent and have equal standard deviations,s, we get
2u¼s2 PTP
1
ð4Þ The square root of the diagonal terms of u give the standard errors in the estimates of the components of the ground displacement. If we set s = 1, then the diagonal terms provide a measure of the effect of geometry on these estimates in terms of the relative measurement error (equiv-alent to the dilution-of-precision used with GPS measure-ments [e.g.,Strang and Borre, 1997]).
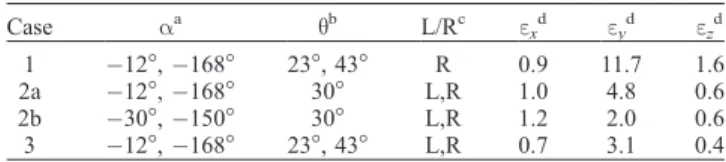
[7] Below, we consider three cases of viewing geometry that are possible with current, planned or proposed mis-sions. In most geometries we consider a standard, near-polar orbit, as used by current SAR satellites such as Envisat. Because the swath azimuth is approximately constant between 60S and 60N, where most volcanoes and fault zones occur, we calculate the dilution of precision assuming azimuths of 12 for ascending passes and 168 for descending passes, measured clockwise from local north.
2.1. Case 1: Right-Looking, 2 Incidence Angles
[8] We first consider the case where range changes are observed for two different incidence angles on both ascend-ing and descendascend-ing swaths. This is possible usascend-ing satellites such as Envisat and Radarsat-1 that have multiple beam modes, recording data at different incidence angles, or with overlapping swaths from fixed beam satellites. If the two incidence angles are assumed to be 23and 43, the relative errors of the vector components are given in Table 1. It can be seen that the error in the north component of the ground displacement is much larger than in the other components. The difficulty in resolving the north component results from the near-polar orbits and the small angular separation of the different line-of-sight observations: 20between ascend-ing and descendascend-ing passes and between the two incidence angles. For a reasonable rms error of 10 mm in the range change observations, the north component of displacement would have an error of12 cm—comparable to the error in the north component of displacement determined using SAR azimuth offsets [Fialko et al., 2001].
2.2. Case 2: Left & Right-looking
[9] Some proposed SAR missions, such as ECHO and EVINSAR [Wadge et al., 2003], have the ability to rotate the spacecraft in order to acquire data with the radar looking left or right. The relative errors for a sun-synchronous orbit assuming an incidence angle of 30are given as case 2a in
Table 1. The error in north component is improved by a factor of two with this geometry, but remains relatively poor compared to the east and vertical components because of the choice of a near-polar orbit. To emphasise this point, we consider case 2b with the same incidence angle as before, but swath azimuths of30and150for ascending and descending passes respectively. This geometry, as proposed for the EVINSAR mission, enables all three components to be well-resolved (Table 1). The disadvantage of such a mission is that it acquires little data outside the latitude range 60S to 60N.
2.3. Case 3: Left & Right-looking, 2 Incidence Angles
[10] In a few cases it might be possible to obtain two incidence angles on ascending and descending passes with the radar both left-looking and right-looking. To investigate this extreme possibility, we extended the analysis for case 2a to eight range change measurements (Case 3; Table 1). The error in the north component has become relatively accept-able, although the result is best interpreted as a pffiffiffi2 improvement in errors through doubling the number of observations, rather than any stronger geometrical constraints.
3. The Nenana Mountain Earthquake
[11] To our knowledge, the M6.7, 23 October 2002 Nenana Mountain (Alaska) Earthquake is the only earth-quake for which interferograms have been acquired with 4 different look directions. This is all the more remarkable in that the 4 Radarsat-1 post-event images were acquired within 6 days of the event, before the much larger M7.9, 3 November 2002 Denali Earthquake, which occurred on the Denali Fault, immediately east of the Nenana Mountain event (Figure 1f ). The 23 October 2002 event was right-lateral strike-slip on a vertical fault. Slip reached 90 cm at a depth of12 km, but failed to break the surface [Wright et al., 2003]. We constructed 5 interferograms using data from Radarsat-1 with 4 different geometries—split evenly between ascending and descending passes, and with incidence angles between 24and 45(Auxiliary Table 11). Images were detrended, and a reference level was set using the far field of the interferograms. Unfortunately, the ascending interferograms did not acquire data north of the fault, because of a change in the beam mode at that location. More details of the InSAR data and processing are presented in Wright et al. [2003], along with a source model for the event.
[12] We determined the vector components of displace-ment using equation (2), and their errors using equation (3), because the noise varied between interferograms (Auxiliary Table 11). The standard errors in east, north and up components are 6, 286, and 41 mm respectively. The large errors in north and vertical components for this geometry mean that the noise swamps the signal, although the east component is well-determined and the simplicity of the inversion results suggest the 6 mm error is realistic (Figures 1a – 1c). However, because the earthquake is approximately east-west in orientation, the expected north Table 1. Relative Errors (Dilution of precision) in Vector
Components of Ground Displacements Estimated From Observed Line-of-Sight Displacements Withs= 1
Case aa qb L/Rc exd eyd ezd 1 12,168 23, 43 R 0.9 11.7 1.6 2a 12,168 30 L,R 1.0 4.8 0.6 2b 30,150 30 L,R 1.2 2.0 0.6 3 12,168 23, 43 L,R 0.7 3.1 0.4 aSatellite Azimuth. b Incidence angle.
cLook direction. L = Left-looking; R = Right-looking. d
Dilution of Precision inx,y, andzcomponents.
1Auxiliary material is available at ftp://ftp.agu.org/apend/gl/
component of deformation is small. We can therefore determine proxies for eastward and vertical deformation,
ux0,uz0, by settinguy= 0 (Figures 1d and 1e). The errors for
these proxies are 6 and 4 mm respectively, and a dramatic improvement is noticeable in the systematic pattern of uz0,
with 4 cm of uplift and subsidence evident in the convergent and extensional quadrants respectively. The east component of surface deformation reaches a maximum of
10 cm, some 10 km south of the fault. 4. Do We Need 3D Displacements?
[13] Although it may not be possible to acquire 4 of-sight components routinely, it is possible to do so for 2 line-of-sight components—right-looking on ascending and descending passes. We illustrate the desirability of doing so by looking at the trade-offs in earthquake model param-eters that exist when only a single line-of-sight measure-ment is available, as is the case in the majority of earthquakes studied using near-polar satellites such as ERS-1/2.
[14] Figure 2 shows synthetic interferograms for the 4 possible line-of-sight directions for a near-polar orbiting mission, calculated using an elastic dislocation model [Okada, 1985] with source parameters similar to those of the 1999 Du¨zce (Turkey) Earthquake, i.e., a right-lateral strike slip earthquake with 5 m of slip on an E-W fault dipping north [Bu¨rgmann et al., 2002]. As in case 2a above an incidence angle of 30was assumed, with azimuths of
Figure 1. Determining the 3D displacement field for the Nenana Mountain Earthquake. (a–c) Estimates ofux,uy, anduz
respectively. Note that the standard errors inux,uyanduzare 6, 286 and 41 mm respectively, hence the noisy appearance of
uyanduz; (d,e) Solutions forux0anduz0, determined assuminguy= 0. Ina–e, the contour interval is 10 mm, except inb
where it is 100 mm. The extents of the figure are shown as a dashed box inf; (f) Location map for the Nenana Mountain earthquake, whose aftershocks are shown in white. Focal Mechanisms for the 23 October and 3 November 2002 earthquakes are from Harvard CMT, and their epicentres are indicated by the stars. Black lines delimit the extents of the InSAR data available for this study, and the region of overlap where 3D displacements were determined is highlighted in yellow. White lines are mapped faults, and the red line is the surface rupture of the 3 November 2002 earthquake.
Figure 2. Synthetic interferograms for a Du¨zce-like
earthquake [Strike/Dip/Rake/Depth Range/Length/Slip = 262/52/175/0 – 11 km/20 km/5 m], calculated with different viewing geometries (Case 2a; Table 1). Each fringe is equivalent to a range change of 100 mm, half of the wavelength of an L-band mission.
12and168. With these azimuths, the ascending, right-looking and descending, left-right-looking interferograms are very similar, as are the descending, right-looking and ascending, left-looking images.
[15] The synthetic interferograms were subsampled using the quadtree algorithm [e.g., Jo´nsson et al., 2002], and a series of Monte-Carlo inversions [Wright et al., 1999] were then carried out in which the synthetic data were perturbed randomly for each inversion, the noise being based on a 1-dimensional covariance function derived from real interferograms in the Du¨zce area [Wright et al., manuscript in preparation, 2003; Hanssen, 2001]. Figure 3 shows the trade-offs that exist between the slip, rake and moment for the model when only the descending, right-looking data are used (as would be the case for most applications of ERS), when both ascending and descending right-looking data are used, and with 4 components (ascending & descending, left & right-looking). Trade-offs for other fault parameters are shown in Auxiliary Figure 11.
[16] There is a marked trade-off among parameters when only the descending track is used, which is substan-tially reduced when inverting data from both ascending and descending tracks. Use of left-looking data in addition only produces a small extra benefit and again is best interpreted as apffiffiffi2reduction in errors through a doubling of the observations. We repeated the calculation using a fault with an N-S strike, with all other parameters identical (Auxiliary Figure 2)1. Despite the largest com-ponent of deformation being sub-parallel to the satellite azimuths, and hence harder to detect, earthquake parame-ters can again be reliably recovered using only ascending and descending, right-looking interferograms. It seems likely that this combination of ascending and descending, right-looking interferograms is sufficient to resolve the parameters of dislocation source models for events large enough to deform the surface by more than a few centimeters.
5. Conclusions
[17] We have shown that it is possible to resolve 3D displacements to a high degree of accuracy with an optimally configured InSAR satellite. A satellite that only covers the earth between latitudes of 60S and 60N would cover most continental volcanoes and fault zones,
and would enable north-south deformation to be deter-mined with an error only twice as large as the error in range changes (i.e., 20 mm for typical atmospheric conditions), if it acquired left and right looking images on ascending and descending passes. Stacking multiple interferograms could reduce this error further such that slow north-south deformation could be measured. For near-polar orbiting satellites resolving the north compo-nent of deformation is more difficult due to lack of diversity in viewing geometry. Again, a satellite that looks both left and right would be the best option, and the north error could be reduced to 30 mm if images with multiple incidence angles could be acquired; this might not be accomplished without a constellation of radar satellites.
[18] With a single, polar-orbiting satellite, it is likely that such a strategy may only be possible in exceptional circum-stances, for very specific targets. In the general case, acquiring both ascending and descending imagery over volcanoes and fault zones should be straightforward, with-out causing any programming conflicts in a dedicated mission. We show that this is sufficient to determine earthquake model parameters, and strongly recommend that such acquisition strategies be implemented for current and future SAR missions.
[19] Acknowledgments. COMET is a NERC-supported Earth Obser-vation Centre. TJW is supported by a NERC postdoctoral research fellowship. RADARSAT-1 images are#2002 Canadian Space Agency and were provided by the Alaska SAR Facility (ASF). Part of this research was performed at the SAIC, EROS Data Center under USGS contract O3CRCN0001 and funding from NASA (NRA-99-OES-10 RADARSAT-0025-0056). Some figures were prepared using the public domain Generic Mapping Tools GMT.
References
Bu¨rgmann, R., P. Rosen, and E. Fielding (2000), Synthetic Aperture Radar interferometry to measure Earth’s surface topography and its deforma-tion,Ann. Rev. Earth. Planet. Sci.,28, 169 – 209.
Bu¨rgmann, R., M. E. Ayhan, E. J. Fielding, T. J. Wright, S. McClusky, B. Aktug, C. Demir, O. Lenk, and A. Tu¨rkezer (2002), Deformation during the 12 November 1999, Du¨zce, Turkey earthquake, from GPS and InSAR data,Bull. Seismol. Soc. Am.,92, 161 – 171.
Fialko, Y., M. Simons, and D. Agnew (2001), The complete (3-D) surface displacement field in the epicentral area of the 1999Mw7.1 Hector Mine earthquake, California, from space geodetic observations,Geophys. Res. Lett.,28(16), 3063 – 3066.
Hanssen, R. (2001),Radar interferometry: Data interpretation and error analysis, Kluwer Academic Publishers, Netherlands.
Figure 3. Trade-offs among slip, rake and moment for Monte-Carlo inversions of noisy, synthetic data for the Du¨zce
earthquake (Figure 2). Black points were obtained using only descending, right-looking interferograms, red points using interferograms from both ascending and descending tracks with a right-looking radar, and the cyan points using interferograms from both ascending and descending track with both right-looking and left-looking radar.
Jo´nsson, S., H. Zebker, P. Segall, and F. Amelung (2002), Fault slip dis-tribution of the 1999 Mw 7.1 Hector Mine earthquake, California, esti-mated from satellite radar and GPS measurements,Bull. Seismol. Soc. Am.,92, 1377 – 1389.
Massonnet, D., and K. L. Feigl (1998), Radar interferometry and its appli-cation to changes in the earth’s surface,Rev. Geophys.,36, 441 – 500. Okada, Y. (1985), Surface deformation due to shear and tensile faults in a
half-space,Bull. Seismol. Soc. Am.,75, 1135 – 1154.
Strang, G., and K. Borre (1997), Linear algebra, geodesy, and GPS, Wellesley-Cambridge Press, Wellesley MA, USA.
Wadge, G., B. Parsons, and the EVINSAR science team (2003), Achieving the EVINSAR objectives with TerraSAR-L, inProc. Third International Workshop on ERS SAR Interferometry, Frascati, Italy, 2 – 5 December. Wright, T. J., B. Parsons, J. Jackson, M. Haynes, E. Fielding, P. England,
and P. Clarke (1999), Source parameters of the 1 October 1995 Dinar
(Turkey) earthquake from SAR interferometry and seismic bodywave modelling,Earth Planet. Sci. Lett.,172, 23 – 37.
Wright, T. J., Z. Lu, and C. Wicks (2003), Source model for theMw6.7, 23 October 2002, Nenana Mountain Earthquake (Alaska) from InSAR, Geophys. Res. Lett.,30(18), 1974, doi:10.1029/2003GL018014.
T. J. Wright and B. E. Parsons, Centre for the Observation and Modelling of Earthquakes and Tectonics, Department of Earth Sciences, Parks Road, Oxford, OX1 3PR, UK. ([email protected]; barry.parsons@ earth.ox.ac.uk)
Z. Lu, U.S. Geological Survey, EROS Data Center, SAIC, 47914, 252nd St. Sioux Falls, SD 57196, USA. ([email protected])