Webinar
Webinar - O Nutricionista
12 de agosto 19:00
(segunda quarta feira do mês)
Rick Grant – PhD – Instituto Miner
O que aprendemos das pesquisas realizadas no Instituto
Miner . Foco em nutrição aplicada na fazenda.
Creating the Perfect
Dining Experience:
Focus on Applied Nutrition and
Feeding Management
Rick Grant
William H. Miner Agricultural Research Institute
Chazy, NY
Topics for Today …
Focus on feeding
environment.
Mix recent Miner
Institute research with
published data.
Goal: meet cow
behavioral needs with
feeding management.
Where is/what is Miner
Institute?
“
Agriculture is the fundamental
occupation.
No other occupation is so vitally
important to the human race, nor
requires such a wide range of
practical and technical
Charles J. Sniffen
Dairy Research & Education Complex
350 Holstein cows 14,058 kg RHA
Creating the perfect dining
experience …
Well-formulated,
palatable ration
Forage quality
Feed available when
cow wants to eat
Competition doesn’t
limit feed access
No restrictions on
Importance of management
environment
(Bach et al., 2008)
47 herds with similar genetics were fed same TMR Mean milk yield=29.5 kg/d
Range: 20.4 to 33.6 kg/d
Non-dietary factors accounted for 56% of variation in
milk yield
Feeding for refusals (29.0 vs 27.5 kg/d) Feed push-ups (28.9 vs 24.9 kg/d)
Stalls per cow and milk
production
(Bach et al., 2008)R2=0.32
Milk yield = 20.4 + 7.5 x stall/cow
Stalls per cow and milk
production
(Bach et al., 2008)R2=0.32
Milk yield = 20.4 + 7.5 x stall/cow
Overcrowding is an Industry
Challenge in US …
United States
57% of producers consistently overcrowd their facilities
Northeast
Average feed-bunk stocking density = 142%
Free-stall stocking density
ranges from 71-197 %
60% of high-producing
groups overstocked
Stocking Density and
Feeding Management
No fun being the cow in
the middle …
As stocking density increases:
Greater aggression and
displacements
Time of eating shifted Fewer meals
Eating rate increased
Greater potential for sorting Largest effect on subordinate
cows
Within limits, cows can adjust feeding behavior in response to variable SR
Stocking density and DMI
(Grant and Tylutki, 2010)
y = 5.5x + 18.0 R2 = 0.05 0 5 10 15 20 25 30 35 40 0 0.2 0.4 0.6
Manger space (m/cow)
D M I (k g /d )
Weak short-term relationship between stocking
density or manger space and DMI
Stocking density and
eating rate
(Grant and Tylutki, 2010)y = -80.9x + 134.5 R2 = 0.43 40 60 80 100 120 140 160 0 0.2 0.4 0.6
Manger space (m/cow)
E ati n g r ate (g D M /m in )
Eating rate increases with increased stocking
density, reduced feeding space
Stocking density and
DMI by parity in mixed groups
Interaction between parity and stocking density
y = -90.9x2 + 109.0x - 8.6 R2 = 0.85 y = -64.2x2 + 68.8x + 6.7 R2 = 0.82 15 17 19 21 23 25 27 29 0.3 0.4 0.5 0.6
Manger space (m/cow)
D ry ma tte r i n ta ke (k g /d ) MP PP (Grant, 2010)
Primi- versus multiparous cows
and stocking density
(Hill et al., 2008)
100% 113% 131% 142%
Multi - primi
Milk, lb/d
+5.9 +13.8 +21.1 +14.9
Milk losses reflect reductions in resting and
Total U se by p ari ty/ total occu p at
ion Preferred stalls tended to be in the middle of the pen;
closest to feed bunk
Heifers avoid preferred stalls
(Miner Institute, 2014)
69%
Rumination by primiparous cows
in preferred/less preferred stalls
(Krawczel, 2007)
Preferred
Less
preferred
P-value
Rumination time,
min/d
81.4
147.8
0.09
% resting time
spent ruminating
35.2
58.4
0.05
Long-term implications?
Management Environment x Diet
Interactions
Management x diet
interaction: Focus on rumen
Management explains majority of variation among farms in
milk yield (Bach et al., 2008)
Feed availability Stocking density
Does stocking density interact with diet?
peNDF, uNDF, CHO fermentability
Does stocking density interact with feed availability?
Effects of stocking density and
physically effective fiber on
short-term responses in ruminal
fermentation and behavior of
Holstein dairy cows
M. A. Campbell, K. W. Cotanch, C. S. Ballard, H. M. Dann, and R. J. Grant
William H. Miner Agricultural Research Institute, Chazy, NY
University of Vermont, Department of Animal Science, Burlington, VT Abstract 165
Ingredient composition
(% of ration DM)
Table 1. Ingredients, chemical composition, and digestibility
of treatment diets
Item
No Straw
Straw
SEM
Ingredients, % of ration DM
Corn silage
39.7
39.7
––
Haycrop silage
6.9
2.3
––
Wheat straw, chopped
––
3.5
––
Citrus pulp, dry
4.8
4.8
––
Whole cottonseed, fuzzy
3.5
3.5
––
Soybean meal, 47.5%
solvent
––
1.1
––
Molasses
3.2
3.2
––
Concentrate mix
41.9
41.9
––
Analyses
Crude protein, % of DM
15.0
15.1
0.3
NDF, % of DM
30.8
30.1
0.4
ADL, % of DM
3.8
3.8
0.1
Starch, % of DM
25.0
25.5
0.5
Sugar, % of DM
7.4
8.1
0.4
Fat, % of DM
5.9
5.7
0.1
7-h starch digestibility, %
of starch
73.3
74.3
0.9
Physically effective
NDF
1.18 mm, % of DM23.9
25.9
0.7
30-h uNDFom, % of DM
13.1
14.9
0.3
120-h uNDFom, % of DM
9.0
10.2
0.2
240-h uNDFom, % of DM
8.5
9.7
0.2
Item No Straw (NS) Straw (S) Corn silage 39.7 39.7Hay crop silage 6.9 2.3
Wheat straw, chopped … 3.5
Citrus pulp, dry 4.8 4.8
Whole cottonseed, fuzzy 3.5 3.5
Soybean meal, 47.5% solvent … 1.1
Molasses 3.2 3.2
Chemical composition
(% of ration DM)
Item NS S CP 15.0 15.1 NDF 30.8 30.1 Starch 25.0 25.5 Sugar 7.4 8.1 Ether Extract 5.9 5.77-h starch digestibility, % of starch 73.3 74.3
peNDF1.18 mm 18.0 22.5
30-h uNDFom 13.1 14.9
Stocking density and
rumen pH
(Campbell et al., 2015)100% 142% SD Diet S NS S NS Mean pH 6.13 6.17 6.10 6.09 0.07 0.62 Min pH 5.67 5.70 5.59 5.62 0.11 0.53 Max pH 6.58 6.63 6.53 6.56 0.07 0.22 pH<5.8, h/d* 1.90 2.29 2.77 4.12 <0.01 0.01 AUC<5.8, pH units x h/d* 0.38 0.19 0.58 0.34 0.06 0.03 *Interaction (P < 0.09).
Associated with reduced lying time, recumbent rumination, and lower milk and milk fat output.
DMI, milk production and
composition – short term
100% 142% P-value NS S NS S SEM STKD DIET DMI, kg/d 25.4 25.3 25.3 25.2 0.4 0.78 0.69 Milk, kg/d 41.2 40.4 40.7 40.0 0.7 0.10 0.06 Fat, kg/d 1.73 1.73 1.70 1.69 0.03 0.10 0.20 True protein, kg/d 1.38 1.36 1.37 1.34 0.02 0.23 0.06
DMI, milk production and
composition – short term
100% 142% P-value NS S NS S SEM STKD DIET DMI, kg/d 25.4 25.3 25.3 25.2 0.4 0.78 0.69 Milk, kg/d 41.2 40.4 40.7 40.0 0.7 0.10 0.06 Fat, kg/d 1.73 1.73 1.70 1.69 0.03 0.10 0.20 True protein, kg/d 1.38 1.36 1.37 1.34 0.02 0.23 0.06
Higher stocking density and marginal peNDF negatively affect rumen pH and performance.
Higher peNDF counteracts the negative pH effect especially at high stocking density.
Stocking density and milk fat
depression
(Hill et al., 2006)
Milk fat % reduced with overcrowding
Overstocked cows ate faster (+25%), ruminated less (1 h/d less).
Perspectives…
Management environment
has large impact on rumen and cow response to diet.
First study to investigate
this interaction.
Need to account for role of
management in nutrition models.
Effect of nutrition and management
practices on
de novo
fatty acid synthesis
in Northeastern US dairy herds
M. E. Woolpert
*1,2, C. Melilli
3, K. W. Cotanch
1, H. M. Dann
1, R. J. Grant
1,
L. E. Chase
3, and D. M. Barbano
31William H. Miner Agricultural Research Institute, Chazy, NY 2 University of Vermont, Burlington, VT
3 Cornell University, Ithaca, NY
Abstract 81
Management environment: impact
on
de novo
fatty acid synthesis
(Woolpert et al., 2015)
Investigated effects of management practices on de
novo fatty acid concentrations in bulk-tank milk
from commercial dairy herds.
44 (Year 1) and 30 (Year 2) in VT and NY Grouped as high or low de novo FA herds
De novo FA synthesized primarily from rumen
fermentation products acetate and butyrate.
Hypothesis: farms with higher de novo milk FA
concentrations prioritize management and nutrition
that promote rumen health.
De novo
fatty acids and milk fat
and protein are positively
correlated
(Barbano et al., 2015)
y = 0.1678x + 0.1222 R2 = 0.4547 2,0 2,5 3,0 3,5 4,0 4,5 5,0 5,5 6,0 6,5 18 20 22 24 26 28 30 Fa t, %
De novo FA, % of total FA
y = 0.123x + 0.2771 R2 = 0.6842 2,0 2,5 3,0 3,5 4,0 4,5 18 20 22 24 26 28 30 True p rot e in , %
Feeding environment
HDN LDN SEM P - value Herd days in milk 175 165 7 0.35 Bunk space, cm/cow1 44.6 37.4 3.1 0.13
Cows per stall1 1.05 1.20 0.06 0.07
Feeding frequency
Tie stall2 4.8 2.8 0.7 0.03
Free stall3 1.7 1.2 0.4 0.32
1 Freestall facilities only (n = 10 HDN; n = 13 LDN)
2 n = 5 HDN, n = 9 LDN component fed; n = 3 HDN, n = 4 LDN TMR fed 3 Freestall farms all TMR fed
Feeding environment and
milk composition
(Woolpert et al., 2015, unpublished)
Greater peNDF
23.4 vs 20.0% of DM
65.2 vs 59.1% >4.0-mm screen with PSPS
Higher
de novo
milk fatty acid synthesis
65% of variation explained by bunk space
Interaction of
Management
Environment and
Forage Quality
Forage NDF and time
spent eating…
Item Low CCS High CCS Low BMR High BMR
53% forage 40%CS:13% HCS 67% forage 54%CS:13% HCS 49% forage 36%BMR:13%HCS 64% forage 51%BMR:13%HCS TMR NDF, % of DM 32.1 35.6 31.5 35.1 TMR 24-h NDFD, % 56.3 54.0 62.0 60.3 Eating Behavior Eating, h/d 4.6ab 5.1a 4.1b 4.6b % of TCT 34.7 35.7 35.1 33.8
abc Least squares means within a row without a common superscript differ (P ≤ 0.05).
Higher forage diets with slower fermenting forage-NDF
take longer to process.
Forage NDF and time
spent eating…
Item Low CCS High CCS Low BMR High BMR
53% forage 40%CS:13% HCS 67% forage 54%CS:13% HCS 49% forage 36%BMR:13%HCS 64% forage 51%BMR:13%HCS TMR NDF, % of DM 32.1 35.6 31.5 35.1 TMR 24-h NDFD, % 56.3 54.0 62.0 60.3 Eating Behavior Eating, h/d 4.6ab 5.1a 4.1b 4.6b % of TCT 34.7 35.7 35.1 33.8
abc Least squares means within a row without a common superscript differ (P ≤ 0.05).
Higher forage diets with slower fermenting forage-NDF take longer to process.
Time budget challenge especially when overstocked at feed bunk or mixed parity pens.
Food for thought …
Feeding frequency
Feed push-up
Bunk space
Feed refusals
Do we need to
re-assess industry
norms?
Cows naturally have
aggressive feeding drive …
Cows willingly exert
>227-kg
pressure against feed barrier
while eating
102 kg
causes tissue damage
Defines “aggressive feeding
drive”
We can train cows to become
less aggressive eaters!
Feed push-up
(Armstrong et al., 2008)
1 to 2 hours post-feeding is most competitive; most
displacements
Push-up each ½ hour for first 2 hours versus once per hour
Fed 3x/day
Item 1x/h 2x/h
DMI, kg/d 18.8 18.2
Milk, kg/d 27.9b 29.7a
Milk/DMI, kg/lkg 1.48b 1.63a
1x versus 2x TMR feeding
(Sova et al., 2013)
Twice versus once daily feeding:
More feed availability throughout day Less sorting against long particles
Increased DMI by 1.4 kg/d, milk by 2.0 kg/d
Overall improvement in efficiency Greater feeding frequency:
Improved rumen fermentation Greater rumination
Feeding frequency greater
than 2x/day?
(Grant, 2012)
Reference FF
/d
Eating
time % DMI % Milk % Rest %
DeVries et al. (2005) 1 vs 2x 2 vs 4x +3.5 +4.6 -2.0 -3.0 NR NR -0.8* 0* Mantysaari et al. (2006) 1 vs 5x + 7.0 -4.8 -1.0 -12.1
Phillips and Rind (2001) 1 vs 4x +11.0 -6.3 -4.7 -8.6
Nikkhah et al. (2011) 1 vs 4x NS -5.2 -2.5 NS
Increased TMR feeding frequency improves efficiency: Is it desirable long-term if it reduces resting time?
Circadian rhythms in feeding
behavior
(Harvatine, 2012)
With >4x/d feeding:
Decreased ruminating
Disruption of normal
circadian lying pattern
In particular, appears to
be antagonism between
resting and feeding at
night.
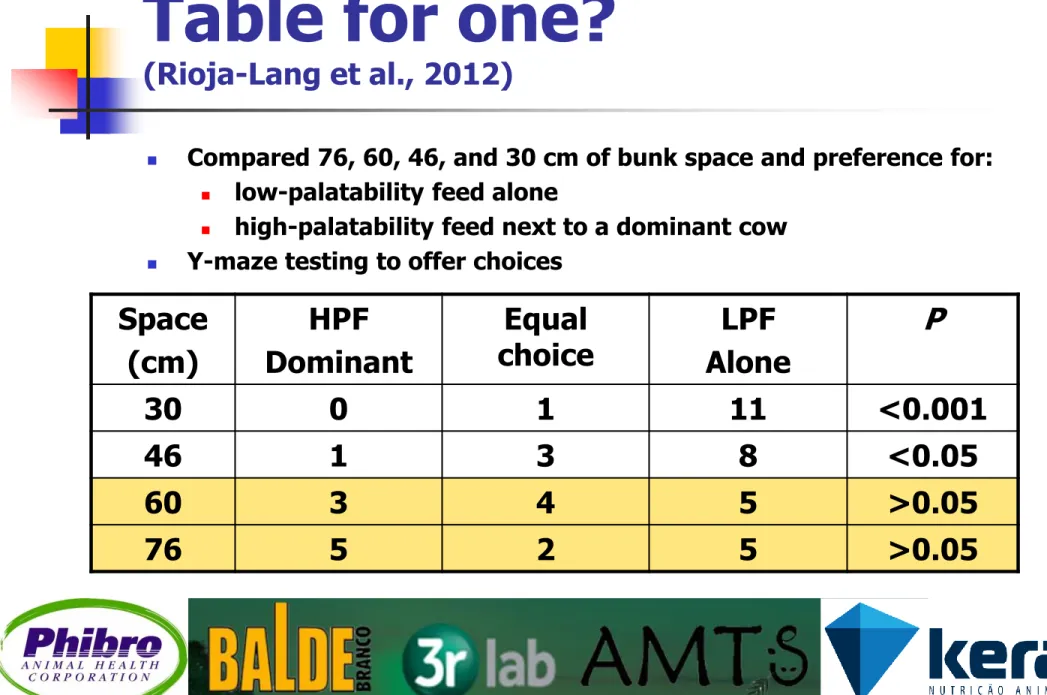
Table for one?
(Rioja-Lang et al., 2012)
Compared 76, 60, 46, and 30 cm of bunk space and preference for:
low-palatability feed alone
high-palatability feed next to a dominant cow
Y-maze testing to offer choices
Space (cm) HPF Dominant Equal choice Alone LPF P 30 0 1 11 <0.001 46 1 3 8 <0.05 60 3 4 5 >0.05 76 5 2 5 >0.05
Are 60 cm/cow enough?
Cows cannot access feed all together.
Distribution of DMI changed – pushed to later hours of
day.
3- versus 2-row pens
Is TMR the same quality?
60 vs 76.2 vs 91 cm/cow
10, 6, 3 displacements per cow/d
Greater feeding time…
Refusal amount and
sorting …
Individually fed cows:
Sorting occurs over day, but by 24 h
cows consume ration similar to that
offered
(Maulfair and Heinrichs, 2013).Competitive feeding situation:
• Each 2%-unit increase in refusalsassociated with 1.3% increase in sorting (Sova et al., 2013).
• Milk/DMI decreases 3% for each 1% increase in sorting.
Feed refusal amount:
intake, milk, efficiency
2.5 vs 5.0
(French et al., 2005)• DMI = 25.9 kg/d, FCM = 42.1 kg/d, FE = 1.63
11.6 vs 16.1
(Greter and DeVries, 2011)• DMI = 21.6 kg/d, MY = 41.6 kg/d, FE = 1.93
11.5 vs 18.0
(Miller-Cushon and DeVries, 2010)• DMI = 26.6 vs 29.7, MY = 39.8, FE = 1.50 vs 1.34
2.9, 6.3, 9.4, 12.7
(Miner Institute, 2013)Two percent feed refusals:
What it looks like…
How long can the feed
bunk be empty?
Cow’s motivation to eat increases markedly after
3 hours (Schutz et al., 2006)
0, 3, 6, 9 h/d feed restriction
Linear increase in motivation to eat
Restricted feed access time by 10 h/d (8:00 pm to
6:00 am) reduced DMI by 1.6 kg/d (Collings et al.,
2011)
Effect of empty-bunk time
(Matzke and Grant, 2003)
Compared 0 vs 6 h/d
functionally empty bunk
(midnight to 6:00 am)
•
+3.6 kg/d milk yield
•
1.8x greater lying in stalls
•
2x greater feeding at bunk
Restricted feed access and
overcrowding
(Collings et al., 2011) Restricted feed (10 h/d) and
overcrowding (1:1 or 2:1 cows:bin)
~3x displacements when restricted
cows were overstocked
during 2 h after morning
feeding and after afternoon milking
25% increase in feeding rate in first
The Perfect Dining Experience?
Recommended Feeding Management
Management that enhances rest and rumination
Feed available on demand
Consistent feed quality/quantity along the bunk
Bunk stocking density ≤100% (≥60 cm/cow)
TMR fed 2x/day
Push-ups focused on 2 hours post-feeding
~3% refusal target
Future feeding management
research at Miner?
Diet x stocking density
Mixed parity pens
Feed availability
Heat stress
Forage quality
uNDF, fermentable CHO
9 de setembro 19:00
(segunda quarta feira do mês)
Adam Lock – PhD – Universidade de Michigan
Gordura para vacas de leite: qual o nível de precisão em
fazendas comerciais. Foco na utilização de gordura e
Sua empresa pode ser parceira no próximo Webinar.
Ajude-nos a trazer aos nutricionistas Brasileiros o que
existe de mais novo em nutrição de vacas leiteiras no
mundo.
[email protected]
Cadastre-se nos nossos meios de comunicação para
receber os slides em português e o Webinar
gravado:
http://3rlab.wordpress.com/
https://www.facebook.com/3rlab
Excelente material para treinamento de equipes/grupos de estudos
0 5 10 15 20 25 30 35 40 45 50 40 50 60 70 > 70 Brasil EUA Argentina
0 10 20 30 40 50 60 70 80 90 Espaço de cocho não é fator de ajuste da dieta Se não tiver espaço de cocho eu aumento a sobra Se não tiver espaço de cocho eu aumento forragem Espaço de cocho interfere na dieta somente na transição Se não tiver espaço de cocho eu aumento frequência de tratos Brasil EUA Argentina
0 10 20 30 40 50 60 70 Qualidade da forragem Espaço de cocho Frequência de alimentação Recursos humanos Instalação Brasil EUA Argentina
10 fazendas com genética similar e
produção diferente
0 10 20 30 40 50 60 70 2x/dia empurrando 4 vezes 1x/dia empurrando 8 vezes 3x/dia empurrando 4 vezes 3x/dia empurrando 8 vezes Mais que 3x/dia Brasil EUA Argentina