MPRA
Munich Personal RePEc Archive
The effects of School Accountability on
Teacher Mobility and Teacher Sorting
Hege Marie Gjefsen and Trude Gunnes
Statistics Norway, Research Department
February 2016
Online at
https://mpra.ub.uni-muenchen.de/69664/
The eects of School Accountability on Teacher Mobility
and Teacher Sorting
∗
Hege Marie Gjefsen
†and Trude Gunnes
‡Abstract
Does school accountability change the teacher composition in schools? We exploit a nested school accountability reform to estimate the causal eect of accountability on teacher mobility and teacher sorting. In 2003, lower secondary schools in Oslo became formally accountable to the school district authority. In 2005, a value added measure of student achievement in lower secondary schools also became public information. Both when using a double and a triple dierence estimator, we nd signicantly increased teacher mobility. Almost all teachers that moved left the teaching sector entirely. Non-stayers were largely replaced by high-ability teachers, yielding a positive sorting eect after the second part of the reform.
JEL-classications:I2, J2
Keywords: school accountability, teacher turnover, teacher sorting, dierence-in-dierence-in-dierence ∗We are grateful for generous comments from Torberg Falch, David Figlio, Lars Kirkebøen, Marte Rønning, Kjetil Telle, in addition to comments from seminar participants at the Norwegian annual meeting for economists in Oslo 2014, the Royal Economic Society Conference in Manchester 2014, and the SOLE/EALE world meeting in Montreal 2015. We are also grateful for data provided by the Norwegian Universities and Colleges Admission Service, and for valuable comments from the school district authority in Oslo. The usual disclaimer applies.
†Statistics Norway, Research Department, Postbox 8131 Dep., N-0033 Oslo, Norway, e-mail: [email protected] ‡Statistics Norway, Research Department, Postbox 8131 Dep., N-0033 Oslo, Norway, e-mail: [email protected]
1 Introduction
School accountability is intended to reduce the principal-agent problem in education by pro-viding incentives for teachers to boost student achievement and thereby school performance. However, school accountability may also induce teacher mobility and work as a sorting mech-anism. For instance, student achievement is not directly attributable to teacher behavior. In fact, many elements inuencing student achievement are out of the teachers' control.1 Making
teachers accountable might therefore induce negative pressure and more risk on teachers, and hence trigger teacher mobility. In addition, school accountability may increase the adminis-trative workload for teachers and may crowd out their intrinsic motivation.2 Moreover, it may
cause a shift in focus, from student learning to student testing. This may induce disutility for some teachers. Teacher mobility might further aect the composition of teachers within schools. Dierences in the turnover decisions made by high- and low-ability teachers may in-duce teacher sorting. If low-quality teachers move and are replaced by high-quality teachers, the sorting eect could be intentional, and could increase overall teacher quality.
In this paper, we study if school accountability has an impact on teacher turnover and teacher composition, and whether it works as a sorting mechanism. We exploit a management reform from 2003 that made schools internally accountable to the school district authority for student achievement, and the fact that a market-element was added in 2005: Information on school performance, a measure of conditional student achievement, became public, making schools also externally accountable.
1See Kane and Stagier (2002) and Koretz (2002) for the pitfalls of imprecise school accountability measures. 2Extensive work by Deci and Ryan (e.g., 1985, 2000) indicates that too much control or distrust might
negatively inuence an individual's intrinsic motivation. Whereas school accountability is meant to give teachers more autonomy in the classroom, school quality measures might be perceived as a signal of distrust. See Fehr and Falk (2002) concerning the psychology of incentives in general.
When studying turnover and recruitment, economists have traditionally emphasized pe-cuniary variables and to a lesser extent organizational and social structures. However, there is a growing interest in such topics. For example, Boyd et al. (2011) nd that teachers with better pre-service qualications are more likely to apply for a transfer, while teachers whose students demonstrate higher achievements are less so. Jackson (2009) studies the causal eect of changes in student characteristics on teacher sorting. He nds a decline in teacher quality in schools with increased black enrollment share due to these schools losing experienced and eective teachers.
Although there exists a vast literature on teacher mobility and sorting, their eects have largely been overlooked in the school accountability literature. Numerous studies have found that school accountability has a positive eect on student test scores (e.g., Rouse et al., 2013), however there is no real consensus on the mechanism through which the impact of accountability takes place.3
Confounding sorting eects play an important role in other settings. Lazear (2000) nds that introducing performance pay in the auto glass sector increased productivity by 44 %. Half of the increase was attributed to sorting, the other half to incentives. In a eld experiment, Leuven et al. (2011) nd that more able students tend to select themselves into tournaments with the higher prizes, and nd no eect of tournament participation on study eort and exam results. Their results indicate that the non-experimental results are completely due to sorting, not incentives.
3Hanushek and Raymond (2004)) nd that just reporting results has minimal impact and that the force of
accountability comes from attaching sanctions and rewards. Bishop et al. (2001) nd that the stick is more eective than the carrot. Harri and Herrington (2006) argue that the positive eects of accountability should mainly be attributed to the existence of exit exams. Rouse et al. (2013) show that improvement in student achievement can be attributed to changes in teaching practices.
The literature on school accountability focuses mainly on channels through which school rankings can induce gaming responses: Teachers increase the use of special education place-ments (Jacob, 2005; Figlio and Getzler, 2006), substitute away from low-stakes subjects (Figlio, 2006), teach for the test (Jacob, 2005), cheat (Jacob and Levitt, 2003), and shift more attention to students in the middle of the achievement distribution in order to inate accountability scores (Neal and Schanzenbach, 2010).
Feng et al. (2011) are one of few to study the eect of school accountability on teacher mobility.4 They exploit a change in Florida's school accountability system that exogenously
shocked some schools to higher accountability scores and others to lower accountability scores. They nd that teachers are more likely to leave schools that have been downwardly shocked and less likely to leave schools that have been upwardly shocked. Dizon-Ross (2014) goes one step further and also study joining teachers' quality. She nds that a lower accountability grade among schools at the bottom end of the school grade distribution decreases teacher turnover among high-quality teachers and increases joining teachers' quality, whereas a lower accountability grade among schools at the top end of the school grade distribution has no turnover eect, but decreases joining teachers' quality.
We follow up the analysis of Feng et al. (2011) and Dizon-Ross (2014) by studying the eect of accountability on teacher composition. More specically, we study if the ability distribution of the teachers changes as a consequence of the reform. Teacher ability is in the following based on teachers' academic performance in higher education. Several scholars provide evidence of 4There are some papers on school accountability and the mobility of school principals. E.g., Li (2012)
nds that No Child Left Behind induced more able principals to move to schools less likely to face sanctions, thereby decreasing the average principal quality at schools serving disadvantage students. In addition, there are a few papers on school accountability and pupil sorting. E.g., Burgess et al. (2013) nd indications of student sorting when school accountability was combined with school choice.
a positive inuence of teacher' academic achievement on student achievement, and hence that teachers' own grades from higher education is a proxy for teacher quality (e.g., Hanushek et al., 2014; Hanushek and Rivkin, 2006; Clotfelter et al., 2006 and 2007). In addition, teachers' own academic achievement is a good indicator regarding teachers' outside options as teachers own grades are salient for potential future employers. In contrast to Feng et. al. (2010) and Dizon-Ross (2014), we study the reactions to the introduction of an accountability system instead of reactions within an already existing one. Furthermore, we disentangle teacher responses to two accountability regimes, one internal and one external, and study how they trigger teacher turnover and sorting. Although not able to make causal inference, we also discuss if a potential gain in student achievement is related to changed behavior of the incumbent workforce or to changes in the ability composition of teachers.
The performance indicator is salient in an accountability system. The performance in-dicator embedded in the nested school accountability reform was based on student grades. The lack of grading in primary education created a higher reform intensity in lower secondary than in primary education. We exploit this dierence in reform intensity in a dierences-in-dierences (DD)-approach. For the general policy environment and the composition of students to be similar in the treatment and comparison groups, we compare lower secondary school teachers to primary school teachers in Oslo, before and after the reform was introduced. To ensure that any results are not driven by systematic dierences between lower secondary and primary school teachers, we add a third dierence: We compare the dierence between treated teachers in lower secondary education and untreated teachers in primary education in the reform district to the dierence between lower secondary and primary school teachers in school districts not aected by the reform in a dierence-in-dierence-in-dierences
(DDD)-approach. We use rich Norwegian data on public school teachers to study causal eects of school accountability on teacher turnover and sorting.
We nd signicantly increased teacher mobility after the internal part of the reform. The external part of the reform also triggers teacher turnover in lower secondary education, but not to a larger extent than the internal part. Almost all non-stayers leave the teaching sector entirely. High-ability teachers respond more strongly in terms of teacher mobility than low-ability teachers. Nevertheless, we identify a positive sorting eect after the external part of the reform, indicating that high-ability teachers who quit are being replaced by other high-ability teachers. We nd a small positive relationship between student achievement and school accountability after the external part of the reform, which is coherent with the pattern of teacher sorting.
The paper proceeds as follows: Section 2 presents the institutional setting and the reform details. The empirical strategy is outlined in section 3. Section 4 presents the data, denes important variables in the analysis, and presents some descriptive statistics. Section 5 presents the empirical results and robustness tests regarding teacher mobility and sorting. Section 6 oers a discussion on how sorting and incentive eects may contribute to student achievement. Section 7 oers some concluding remarks.
2 Institutional setting and the accountability reform
2.1 The Norwegian educational system
The educational system in Norway is based on public schools, in which more than 95% of the students are enrolled. Public schools have a common curriculum and the same number of teaching hours in each subject. They are organized in school districts and each district is in charge of their own school policies. Oslo, the reform district, has proved to be an active policy maker. For instance, teachers in Oslo are hired by the school they work at, which is not the case for all school districts in Norway. Whereas the governance structure can vary across districts, it is similar for primary and lower secondary school teachers within school districts. The desirability of retaining and ring teachers may change as schools become more re-sponsible for their performance. In Norway, the teacher labor market is strictly regulated, making it dicult to lay o teachers who have permanent positions. In addition, wage bar-gaining is centralized. There is little variation in wages across teaching jobs, and wages are dicult to use as a means of retaining teachers. In such an environment, mobility within the school sector will primarily be motivated by non-wage job attributes, as found by Falch and Strøm (2005).
Alternative wages are important in explaining out of sector mobility (Dolton and van der Klaauw, 1995, 1999; Hoxby and Leigh, 2004). Chingos and West (2012) nd that teachers with high value added have higher earnings compared to other teachers after leaving the teaching sector. In Norway, the wage structure is compressed and the returns to education are generally low, particular in the public sector (Barth and Moene, 2000). In terms of wages, teachers' external labor market is similar to the teacher labor market at least within the public sector.
As regards the student body, schools take in students based on their catchment areas. The compulsory education track, composed of primary and lower secondary education, starts at age 6 and continues until the age of 16. In contrast to many other countries, students in Norway are not graded before entering lower secondary education at the age of 13. In primary education, the evaluation of students is based on low-stakes tests only. There is no objective measure of school performance in primary education in the time period analyzed. Students in lower secondary education, on the other hand, are graded by their teachers in a total of ten subjects. In addition, students sit for one central exit exam.5 Grades from the last year
of compulsory education are used to compete for study seats in upper secondary education, making them high stakes for the students.
2.2 The nested accountability reform
An emphasis on school performance was gradually implemented in Oslo. In 2002, there was a major reorganization in which school principals were granted substantive impact on school policies and hence assigned an important role in the process of generating educational success. In 2003 (i.e., the internal part of the reform), school principals became accountable to the school district authority for student achievement. Individual meetings at which school performance was discussed were arranged annually between the authority and each school principal. School performance was based on student achievement. In lower secondary edu-cation, student grades (both teacher-awarded grades and central exam scores) were salient in this respect. Student grades are easily interpretable to both teachers, principals, and the 5Students are randomly assigned to one examination among four subjects: Norwegian I and II, English
school district authority. In the case of low performance, school principals had to commit to changes in order to increase performance later on.
In 2005 (i.e., the external part of the reform), a market element was added to the account-ability regime. First, a new adjusted school quality indicator was calculated for schools in lower secondary education, which aimed at indicating each school's contribution to student achievement, i.e., the value added. The indicator was based on mean grade points from both teacher-awarded grades and central exams, and it was adjusted for individual student and parental characteristics (Hægeland et al., 2004). By relaying on student grades that are high stakes for students in contrast to accountability tests, the scope for gaming by teachers was reduced. Adjusting the school quality indicator and including centrally graded exam scores also made articially inating student achievement more dicult.
Second, the school quality indicator was publicly disclosed for the rst and only time on November 18th. The aim was to inform parents and other stakeholders, and to further induce teachers to focus on school performance. At the time of the publication, both school principals and the public were told that there would not be any further public disclosures of school quality indicators. After the 2005 general election, the new government strongly opposed public disclosure of school performance. Hence, the threat of further exposure for teachers in lower secondary education in Oslo was no longer imminent.
In 2006, a national reform implemented accountability mechanisms in all school districts, thereby aligning the system in Oslo with other school districts. In addition, a new performance measure with written assessments was implemented in primary schools in Oslo from 2006.
2.3 What to expect of the nested accountability reform?
Neither the internal nor the external part of the reform were so-called high-stakes account-ability regimes. Both were low-powered as no rewards or sanctions - such as threats of ring teachers, replacement of principals, or reconstitution of schools - were attached. Whereas these elements are often regarded as necessary to change teacher behavior, Figlio and Loeb (2011) suggest that even accountability systems absent of strong sanctions or rewards will aect the teaching environment and impact student achievement. In fact, increased focus on school performance and creating a new focal point can in itself be eort enhancing6
The internal part of the reform initiated a new way for school principals and teachers to govern and conduct schools. School principals were made responsible for student achievement towards the school district authority, and teachers were the main channel through which they could fuel student achievement. School principals were therefore induced to inform and motivate teachers in parallel with delegating more responsibility and making teachers more accountable for student achievement. Furthermore, the incentive embedded in the external part of the reform was more high-powered. The ranking of schools based on adjusted student grades, which could be interpreted as school value added, was made public. This external mechanism was added to the internal part of the reform and could have provided enhanced incentives for teacher to increase student achievement.7
School accountability may, however, not function as an incentive for incumbent teachers 6In a theoretical setting, Dewatripont et al. (1999), by extending the one-task career concerns model
of Holmström (1982), nd that total eort goes up when the number of tasks an individual has to perform decreases. The rationale behind this result is that accountability increases with the clarity of an organization's mission. In contrast, when an organization practices a fuzzy mission the market is uncertain about which mission an individual is actually pursuing, inducing lower career concerns, eort and performance.
7Carnoy and Loeb (2002) nd a positive and signicant relationship between the strength of states'
to increase their eort. As mentioned in the introduction, teachers might nd the conditions under which they operate inadequate: Many elements inuencing student achievement are out of their control. Accountability may also crowd out teachers' intrinsic motivation, and may lead to a shift in focus from student learning to testing. The performance-contract between schools and the school district authority is also likely to have induced a higher administrative workload for teachers in Oslo compared to in other parts of the country. Hence, the nested school accountability reform may trigger teacher mobility.
Dierent teacher types may react dierently to school accountability. Whereas high-quality teachers are considered to embody the necessary skills in order to respond to the new regime and therefore are more likely to stay than low ability teachers, they might nd it hard to increase the overall school performance and may become demotivated, and hence leave. In addition, high-quality teachers, as measured in terms of teachers' academic achievement, may have better outside options compared to low quality teachers as potential future employers value applicants with strong academic records.
Dohmen and Falk (2010) nd that introducing performance pay for teachers may crowd in teachers who are less trusting and more negatively reciprocal, at the cost of the current prole. As a consequence, the composition of teachers might negatively change and have an adverse eect on students' educational progress. A low-stakes accountability system is likely to yield dierent results. The incentives inherent in the accountability regime studied in this paper might be more suitable for teachers than the individualized and explicit incentive studied by Dohmen and Falk (ibid.).8
8Individual performance pay can be an adequate incentive for teachers (e.g., Lavy, 2009). Lavy (2015) even
nds that teachers' pay for performance has positive long run eects on students' educational and labor market outcomes. Barley and Neal (2012) propose an incentive scheme for educators that rely on ordinal information contained in assessment results. They claim that such a scheme will reduce the gaming behavior of teachers
3 Empirical strategy
3.1 Teacher mobility
To estimate what we can interpret as a causal eect on teacher mobility by the reform, we need to control for two kinds of potentially confounding trends: Changes in teacher mobility over time that have nothing to do with the nested reform, and dierences in teacher mobility between teachers at the dierent school levels. We employ a DD-framework to estimate the eect of the accountability reform on teacher mobility.
The existence of grading in lower secondary in contrast to in primary schools result in lower secondary being aected and primary schools not aected by the reform. We exploit this dierence in accountability pressure by using lower secondary education as treatment group and primary education schools as comparison group.
The school districts are in charge of school policies, and Oslo has proved to be an active policy maker. For the general policy environment to be similar in the treatment and compar-ison groups, we only include schools from the same school district. Moreover, primary and lower secondary schools in Oslo share the same student population, which could be a factor impacting teacher turnover.
The following DD-equation is estimated:
yist =βo+β1Es+dt+γ1(EsdTt) +β2Xit+εist (1)
as these schemes are more adequate than those relying on cardinal rankings. In general though, output-based incentives for teachers are often suggested to be low-powered in order to avoid gaming as high-powered explicit incentives are best used when output is well dened, the eort-performance relation is well understood, the production is uni-dimensional, and the outcome is easily measured (Dixit, 2002; Lazear, 2003).
The outcome variable yist is a dummy for whether teacher i who works at school s quits
the job in year t or not. βo is a constant. Es is a dummy variable that equals one if s is a
lower secondary school and zero if a primary school, i.e., the comparison group. dt is a set of
year dummies covering the period before, during and after the nested accountability reform (i.e., 2000-2006). dT
t is a dummy variable equal to one if a reform year (i.e., 2004-2005 or
2006) or zero otherwise. Xit is a vector of covariates that include gender, age, experience,
controls for yearly local labor market conditions by educational background, a dummy for working in primary or lower secondary education, teacher education level, and dummies for having a teacher education at bachelor's and master's level. Age and experience are included as a quadratic functions. εist is a random error term clustered on school level to safeguard
against the possibility that the error term can be correlated within schools.9 Our parameter
of interest in Equation 1 isγ1. This parameter, in which the reform year dummy is interacted
with treatment group status, measures the change in teacher turnover in the reform years relative to the years before the reform.
Quit decisions are made each year, so we also estimate a more general equation than Equation 1. Instead of an average reform eect, pooled over all reform years we replace the DD-parameter, γ1, with a vector of year specic parameters. Both specications allow us to
study the mobility responses to the internal (2004-2005) reform and the additional external element in 2006.
That the same reform leads to dierent accountability pressure in primary and lower sec-ondary schools is a hypothesis that is important for identication. Grades in lower secsec-ondary 9To avoid a potential bias from too few clusters, we never have fewer than 42 clusters in any of our
education, salient to the dierence in accountability pressure, are easily interpretable and the learning objectives for the them are clearly stated. Grades in lower secondary education are given for each grade level and in all subjects. In contrast, tests in primary education are low stakes, and evaluations of students are neither easily interpretable nor comparable across classrooms. If the hypothesis does not hold, and primary school teachers are aected in the same way in spite of the institutional dierences, any eects must be a result of other factors inuencing the dierence between primary and lower secondary school in Oslo. On the other hand, if primary and lower secondary school teachers are similarly aected by the reform, but react opposite, we will overestimate the eect of the reform.
There are concerns with the DD-approach. Systematic dierences in educational traits for primary and lower secondary school teachers could imply that common shocks in the labor market aect the two groups of teachers dierently. If that is the case, the estimated eect using Equation 1 is not necessarily an eect of the reform, but could be an eect of dierent reactions to labor market conditions in primary and lower secondary education.
Systematic dierences between primary and lower secondary school teachers should be similar across school districts. There might be a dierence in how shocks aect primary and lower secondary school teachers, but the dierence should be similar inside and outside the reform district. To safeguard that the estimated reform eect is not caused by dierent reactions to the same shocks, we compare the dierence between lower secondary and primary school teachers in the reform district to the same dierence in the rest of the country before and after the reform.
By adding a third dierence between teachers inside and outside the reform school district, any within-school level dierences, e.g., systematic dierences in educational traits, are netted
out. Dierences in the labor market situation across school districts are still accounted for by the fact that primary and lower secondary education teachers are situated in the same labor market area.
In the DDD-framework, the following equation is estimated:
yist =βo+β1Ts+β2Es+dt+dtEs+dtTs+γ1(TsEs) +γ2(TsEsdTt) +β3Xit+εist (2)
Our parameter of interest from Equation 2 is γ2. This parameter measures the change in
teacher turnover in the reform years in the dierence between turnover for lower secondary school teachers and primary school teachers inside and outside the reform district. Ts is a
dummy that equals one if schoolsis situated in the reform district and zero if situated outside
of the reform district.
There might still be concerns with the DDD-approach. If the reform led to strategic moving by parents, large changes in moving patterns could have led to changed student composition in schools, which again could aect teacher mobility. Fiva and Kirkebøen (2011) nd an increase in housing prices near high-quality schools in Oslo as a consequence of the second part of the reform, indicating strategic movings. However, the eect was short-lived, and thus could not have led to large changes in the student composition. That our eect is driven by compositional changes due to the second part of the reform is therefore unlikely.
In general, there are indications of student composition inuencing teachers' mobility deci-sions (e.g., Lankford et al., 2002; Hanushek et al., 1999; Falch and Strøm, 2005). We therefore perform robustness tests to test whether changes in school characteristics over time drive our
results by excluding small schools and schools with a high immigrant share.
The labor market for teachers could be systematically dierent in large cities and more rural areas. We test whether the results are robust to only including large cities in the comparison group. Another concern is that the treated school district is a dierent labor market district from also the other large cities. However, the surrounding municipalities share the same labor market, so we include municipalities surrounding the treated school district as a comparison group in another robustness test.
Changes in the accountability regime could lead to sorting within the school sector, i.e., that teachers move to schools with higher performance or outside the treated school district. To nd out whether changes in the turnover is a result of within-sector sorting, we estimate Equation 2 with the outcome of leaving the teaching sector.
There could be heterogeneous responses to the accountability reform, which can induce teacher sorting eects. We estimate Equation 2 separately for teachers with academic achieve-ment above and below mean separately. We also estimate Equation 2 separately according to gender, educational background, age and experience.
The main underlying assumption in a DD- and DDD-approach is the existence of a common trend before the reform. We check whether such an assumption holds both by graphical examination and a placebo test.
3.2 Teacher sorting
The overall eect on teacher composition depends not only on who leave, but also on the teachers replacing the ones who leave. To nd out if there is a sorting eect of the nested
school accountability reform, we estimate the eect on the mean academic achievement of the teacher stock in schools. Systematic dierences in teacher composition between primary and lower secondary education might be a larger concern when studying outcomes at the school level. We therefore use a similar empirical approach as in Equation 2, but with mean academic achievement within the school as the outcome:
yst =βo+β1Ts+β2Es+dt+dtEs+dtTs+γ1(TsEs) +γ2(TsEsdTt) +β3Xst+εst (3)
The outcome yst measures mean academic achievement of the teacher stock at time t for
school s. All explanatory variables have the same interpretation as in Equation 2, with the
exception ofXst, which now denotes a vector of control variables at the school level, including
mean age, mean educational level, mean years experience, and male share. Our variable of interest is still γ2.
Several authors provide evidence of a positive inuence of teachers' academic achievement on student achievement and hence that teachers' own grades from higher education is a proxy for teacher quality (e.g., Hanushek et al., 2014; Hanushek and Rivkin, 2006; Clotfelter et al., 2006 and 2007). Teachers with strong academic records are not always the same as those who actually boost student achievement, but when analyzing teacher mobility, teachers' own academic achievement is a good indicator for teachers' outside options as teachers own grades signals ability to future employers. We also check how composition in terms of male share, experience, age and teacher educational background is aected by the reform.
4 Data and Descriptive Statistics
We use rich register data on public school teachers from Statistics Norway to study teacher turnover and sorting in Norway in the period between 2000 and 2006. Employment data on teachers includes information on gender, age, education, employment code, and experience (measured as years spent at the school). The employment data does not only cover a yearly reference week, but every 4 weeks during the year. The data source contains school identiers and personal identication codes for each teacher. Since teacher mobility can be inuenced by local labor market conditions we add yearly data on local unemployment by education level.
The sample is restricted to teachers eligible for permanent appointments. Non-certied teachers are not eligible for permanent positions, and are subject to involuntary moves. We therefore restrict the sample to teachers who either have a teacher education, or a teacher employment code. We also restrict the sample to those who work more than 50 percent of full-time. The pension age in Norway is 62 for most teachers, and we do not want to include those who leave the profession due to age. Therefore, only teachers between the ages of 20 and 60 are included in the sample for each year. Moreover, some schools in Norway are combined primary and lower secondary schools. We are not able to identify whether teachers at combined schools work in primary or lower secondary education, and combined schools are therefore excluded. Schools that were closed down during the period are also excluded from our sample, which is only relevant in the comparison group in the estimation period.
We add micro data on teacher academic achievement. To construct an ability index, we use teachers' own grades from higher education institutions (HEI), that is, all universities and university colleges in Norway. A range of dierent grading scales is used for grades included
in the sample.10 We normalize every grade within each grading scale and year, and calculate
the mean grade for each person, using all grades except for pass/fail.11 The ability index
is adjusted for institution- and eld-specic eects. Even if it is a strength that HEI use external examiners from other institutions, grading practices can still vary across HEI and study elds. Also other teacher characteristics may contribute to student achievement, e.g., teacher eort, personal traits, and teaching practices. Nevertheless, our ability index is a good indicator for teachers' outside options as teachers' own grades signals ability to future employers. To control for teachers' academic achievement, we include a dummy for having academic achievement above average.
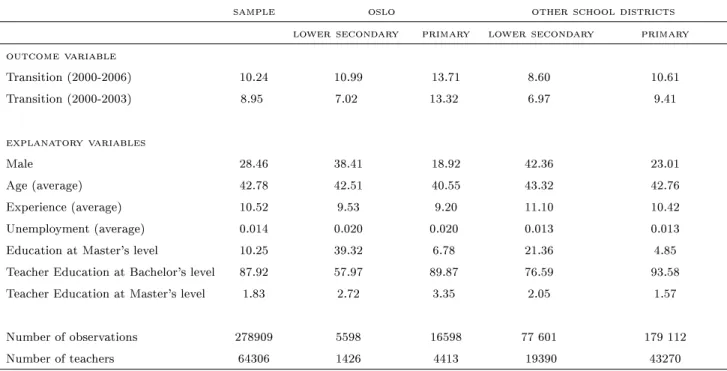
The sample includes 22 196 observations in Oslo, and 278 909 observations in total for 64 306 teachers for the years 2000-2006. Table A.1 in the Appendix gives a descriptive overview of the main variables used in the analysis, for the total sample and for the treatment and comparison groups separately. As regards data on teachers' performance in higher education, we have information about at least one grade for 48 792 teachers in the sample.
The outcome variable in the mobility analysis is to leave the school, which is dened as not being registered as employed in the same school during the next calendar year. Persons who have an end to their employment spell in a specic school during a year will not be registered as employed in the next year, and are thus making a transition. The exception is if they quit the job, but return to the school so that they are registered as employed in the school the next year. In that case, they will not be registered as making a transition by our denition. Most teacher mobility takes place during summer. For teachers who are employed at several
10A national grading system in HEI was rst implemented in 2003.
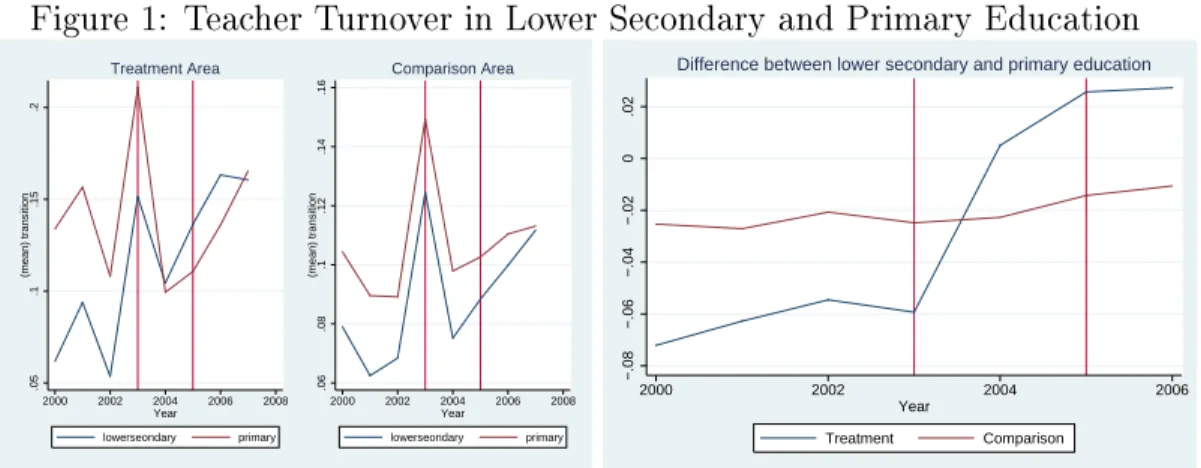
Figure 1: Teacher Turnover in Lower Secondary and Primary Education .05 .1 .15 .2 (mean) transition 2000 2002 2004 2006 2008 Year lowerseondary primary Treatment Area .06 .08 .1 .12 .14 .16 (mean) transition 2000 2002 2004 2006 2008 Year lowerseondary primary Comparison Area −.08 −.06 −.04 −.02 0 .02 2000 2002 2004 2006 Year Treatment Comparison
Difference between lower secondary and primary education
schools at the same time, we chose what we dene as the main employer (highest number of working hours and highest seniority). To leave the school thus includes changing jobs to other teaching jobs both inside and outside the treatment area, or leaving the sector entirely. Making schools accountable for student achievement to the school district authority in 2003, and publicly distributing new information about school quality in November 2005, are most likely to inuence teacher turnover from 2004 and 2006, respectively.12
The critical assumption for both the DD- and DDD-approach is that in the absence of the nested reform, the dierence between lower secondary and primary school teachers follow a similar trend. The rst part in Figure 1 indicates a common pre-treatment trend in Oslo, the treatment area. The third part in Figure 1, which shows the dierence in mobility responses between lower secondary and primary education teachers in the treatment and comparison areas, suggests that there is also a common trend in the dierence between lower secondary and primary school teachers before the reform. In the pre-treatment period, teacher turnover in primary education is higher than teacher turnover in lower secondary education. That changes, however, in the treatment period. For the comparison group (see second part in 12Teachers were not informed long before the implementation of each reform, i.e., teachers could not adjust
Figure 1), there is no such shift. These gures thus provide the rst indication that the nested school accountability reform impacts lower secondary and primary teachers in the reform district dierently.
As suggested in Section 3.1, there are no parallel pre-trend when comparing lower secondary school teachers' mobility in Oslo to the rest of the country (see part one and two in Figure 1). This, however, is not a threat to our DD- and DDD-estimators as we exploit the dierences between lower secondary and primary school teachers.
There is a spike in teacher mobility in 2003 for both teacher groups in both areas, as seen in Figure 1, indicating that national events aected both the treatment and comparison groups. Such events could be the surprisingly low performance on the PISA-test or business cycle conditions.13 Teacher unemployment reached a peak in 2003, which is coherent with the
peak we nd in our data. Tighter budget constraints at the school district level are the main reason for the high teacher unemployment in 2003. Neither of these events should inuence our DD- and DDD-estimates, since it is unlikely that they would inuence the dierence between teacher mobility in lower secondary schools and primary schools in Oslo, and unlikely that they would inuence the same dierence in other parts of the country.
Our main analysis ends in 2006 when the accountability regime in our comparison group changes. As a part of the robustness tests, long-term eects are also analyzed by adding data to 2008. With higher accountability intensity in primary education in Oslo, and the introduction of accountability regimes in the rest of the country, an increase in mobility in all parts of our comparison group could be expected after 2006.
13During the period studied, Norway participated in PISA in 2000, 2003, and 2006. Norway performed
The data used in the sorting analysis are aggregated to school level. We calculate mean academic achievement of teachers within schools, which is our primary outcome variable in the sorting analysis. Positive sorting in terms of mean teacher ability implies that schools are able to attract and/or replace their high-ability teachers. For this analysis, we have 13 495 observations from 2360 schools.
We use data on student achievement to discuss sorting and incentive eects on student achievement in Section 6. In Norway, data on teachers' evaluations and central exam scores for 10th grade have been collected from 2002. Included are student grades in all subjects for the last year of lower secondary education.14 In total, we have information on grades and
social background variables for 278 223 students for the years 2002-2008.
5 Results
5.1 Teacher mobility
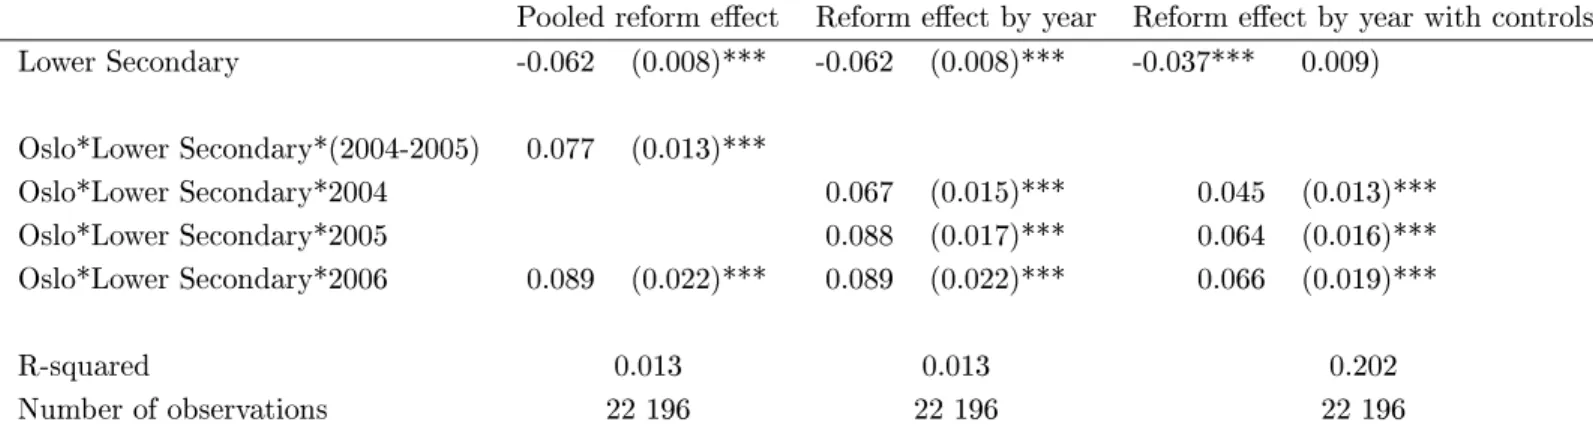
Table 1 shows the results from the DD-analysis based on Equation 1. Column 1 shows the average eect pooled over reform years while column 2 and 3 show year specic eects. In column 3, control variables for teacher background are added.
Column 1 reveals a substantial eect of the reform on teacher mobility. We estimate a 7.7 percentage points increase in teacher mobility after the rst part of the reform and a 8.9 percentage points increase after the second part, from a pre-reform level of around 10 percent (see Table A.1). Column 2 shows that the reform eect is the smallest in the rst year, with an estimate of 6.7 percentage points, before it increases with about 2 percentage points
Table 1: The Eect of Accountability on Teacher Mobility, DD-specication
Pooled reform eect Reform eect by year Reform eect by year with controls Lower Secondary -0.062 (0.008)*** -0.062 (0.008)*** -0.037*** 0.009) Oslo*Lower Secondary*(2004-2005) 0.077 (0.013)*** Oslo*Lower Secondary*2004 0.067 (0.015)*** 0.045 (0.013)*** Oslo*Lower Secondary*2005 0.088 (0.017)*** 0.064 (0.016)*** Oslo*Lower Secondary*2006 0.089 (0.022)*** 0.089 (0.022)*** 0.066 (0.019)*** R-squared 0.013 0.013 0.202 Number of observations 22 196 22 196 22 196 Note: All specications are estimated by OLS and include a constant term, year dummies (ref. 2000), and the interaction terms(Es∗dt). Standard errors are clustered on school level. */**/*** statistically signicant at
the 10/5/1 percent level.
from 2005. The external reform element added in 2005 does not lead to a further increase in the 2006-eect. Publicly disclosing school performance seems therefore, on average, not to alter the mobility response of lower secondary school teachers relative to the response already emanating from the internal part of the reform. Adding controls for teacher background decreases the magnitude of the eect, although the pattern is similar. Column 3 reveals a reform eect of 4.5 percentage points the rst year, before it increases to about 6.5 percentage points in the subsequent years.
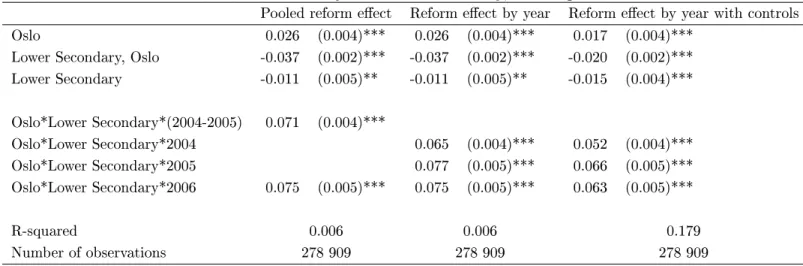
As lower secondary school teachers have dierent characteristics, and thus may be exposed to dierent shocks, we add a third dierence; between the school district of Oslo and other school districts. Column 1 in Table 2 reports estimated results based on Equation 2, whereas Columns 2 and 3 report year specic eects. Control variables for teacher background are added in Column 3.
Column 1 shows an average treatment eect of 7 percentage points after the internal part of the reform, and the same eect is found for the external part of the reform. Decomposing the average treatment eect of the 2003 reform (calculated for the period 2004-2005) into
Table 2: The Eect of Accountability on Teacher Mobility, DDD-specication
Pooled reform eect Reform eect by year Reform eect by year with controls Oslo 0.026 (0.004)*** 0.026 (0.004)*** 0.017 (0.004)***
Lower Secondary, Oslo -0.037 (0.002)*** -0.037 (0.002)*** -0.020 (0.002)*** Lower Secondary -0.011 (0.005)** -0.011 (0.005)** -0.015 (0.004)*** Oslo*Lower Secondary*(2004-2005) 0.071 (0.004)*** Oslo*Lower Secondary*2004 0.065 (0.004)*** 0.052 (0.004)*** Oslo*Lower Secondary*2005 0.077 (0.005)*** 0.066 (0.005)*** Oslo*Lower Secondary*2006 0.075 (0.005)*** 0.075 (0.005)*** 0.063 (0.005)*** R-squared 0.006 0.006 0.179 Number of observations 278 909 278 909 278 909 Note: All specications are estimated by OLS and include a constant term, year dummies (ref. 2000), and the interaction terms (Ts∗dt)and (Es∗dt). The third specication is used in all subsequent tables. Standard
errors are clustered on school level. */**/*** statistically signicant at the 10/5/1 percent level.
year-specic eects in Column 2 and 3 reveal the same picture as before: The reform eect is the smallest in the rst year, then increases in 2005, and remains the same in 2006.
The results in Table 1 and 2 are quantitatively the same. The estimates are somewhat higher in column 1 and 2 in the DDD-analysis than for the DD-analysis, but when adding controls for teachers' educational background in column 3, the results from the two models are aligned. The similarity of the results in the two models leads to the conclusion that primary and lower secondary school teachers are not exposed to dierent shocks. However, there are compositional eects that lead the results in column 2 and 3 to be dierent in the DD-analysis. The DDD-analysis are less sensitive to such a concern. In the following analysis, we thus keep the DDD-framework and the third specication with teacher controls.
Individuals may respond dierently to incentives (e.g., Leuven et al., 2010; Bettinger, 2010; Angrist et al., 2009; Angrist and Lavy, 2009). Heterogeneity in terms of mobility may also have implications for teacher sorting, i.e., the net impact of teacher outow and inow. We therefore compliment the analysis by studying heterogeneous mobility eects, see Table
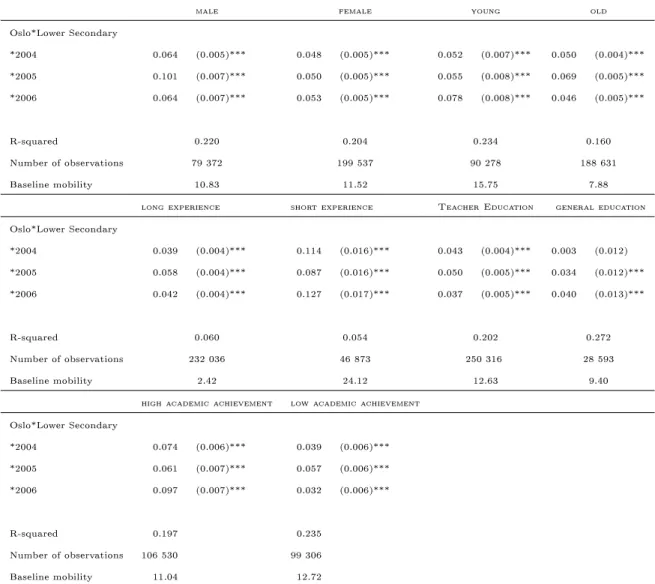
3. We nd that high-ability teachers are more responsive to the reform than low-ability teachers. More precisely, teachers with strong academic records react stronger than those with academic achievement below average in 2004 and 2006. In 2005, there is no signicant dierence in the mobility response for the two groups.15 The dierence in the 2006-eect is
substantial considering that the baseline mobility is similar for high- and low-ability teachers. Regarding the stronger reaction in the high-ability group, an important reason may be that those with higher academic achievements also have better labor market prospects as academic achievement serves as a signal of ability. The sample is reduced when estimating the eect by ability group as we do not have information on academic achievement for all teachers. However, the reduction of the sample does not change the results when estimating Equation 2. Other studies have also found that teachers with high academic achievements more often leave the teaching profession than teachers with lower scores, although not as a consequence of school accountability (Murnane and Olsen, 1990; Henke et al., 2000; Podgusrsky et al., 2004; Boyd et al., 2011).16
For other subgroups, the heterogeneous eects are as follows: Teachers with relatively short experience (less than 4 years at the same school) react stronger to the reform than their more experienced colleges. Younger teachers (below 40) respond more strongly to public exposure than their older counterparts as younger teachers change jobs to a signicantly greater extent than older teachers after the external part of the reform. Mobility response is somewhat higher for men than women, although the dierence between male and female teachers' responses is 15To check whether the dierences between the subgroup pairs' DDD-estimates are statistically signicant
we test the linear combination of two estimates.
16We also analyze the eect of new information concerning school performance on teacher mobility. We
compare the ranking of schools based on the adjusted and the non-adjusted performance indicator related to the external part of the reform. We nd reduced mobility among low-ability teachers in schools receiving a negative information shock, while for high-ability teachers in the same schools the mobility increases.
Table 3: Heterogeneous Treatment Eects, Teacher Mobility
male female young old
Oslo*Lower Secondary *2004 0.064 (0.005)*** 0.048 (0.005)*** 0.052 (0.007)*** 0.050 (0.004)*** *2005 0.101 (0.007)*** 0.050 (0.005)*** 0.055 (0.008)*** 0.069 (0.005)*** *2006 0.064 (0.007)*** 0.053 (0.005)*** 0.078 (0.008)*** 0.046 (0.005)*** R-squared 0.220 0.204 0.234 0.160 Number of observations 79 372 199 537 90 278 188 631 Baseline mobility 10.83 11.52 15.75 7.88
long experience short experience Teacher Education general education Oslo*Lower Secondary *2004 0.039 (0.004)*** 0.114 (0.016)*** 0.043 (0.004)*** 0.003 (0.012) *2005 0.058 (0.004)*** 0.087 (0.016)*** 0.050 (0.005)*** 0.034 (0.012)*** *2006 0.042 (0.004)*** 0.127 (0.017)*** 0.037 (0.005)*** 0.040 (0.013)*** R-squared 0.060 0.054 0.202 0.272 Number of observations 232 036 46 873 250 316 28 593 Baseline mobility 2.42 24.12 12.63 9.40
high academic achievement low academic achievement Oslo*Lower Secondary *2004 0.074 (0.006)*** 0.039 (0.006)*** *2005 0.061 (0.007)*** 0.057 (0.006)*** *2006 0.097 (0.007)*** 0.032 (0.006)*** R-squared 0.197 0.235 Number of observations 106 530 99 306 Baseline mobility 11.04 12.72 Note: See Table 2
only signicant in 2005. Teachers with a designated teaching degree have a stronger mobility response than teachers with a general education in 2004.
5.1.1 Out of sector mobility
So far, we have studied whether lower secondary school teachers change workplaces or not. An alternative outcome is the extent to which lower secondary school teachers leave the sector entirely. That is, do lower secondary school teachers move into other teaching jobs, and strategically move in or out of the treatment group, or do they leave the school sector entirely? Table A.2 shows that most of those who change jobs actually leave the teaching profession.17 The same mobility eects (results not shown) are found for out of sector mobility
as for the main outcome variable, change in workplace. In contrast to previous studies, we do not nd that those who leave the teaching profession often leave employment altogether (Stinebrickner, 2002; Fritjers et al., 2004). Few go to better paid jobs, which is coherent with non-wage attributes driving teacher mobility as discussed in Section 2.1.
5.2 Robustness checks
5.2.1 Placebo and alternative comparison groups
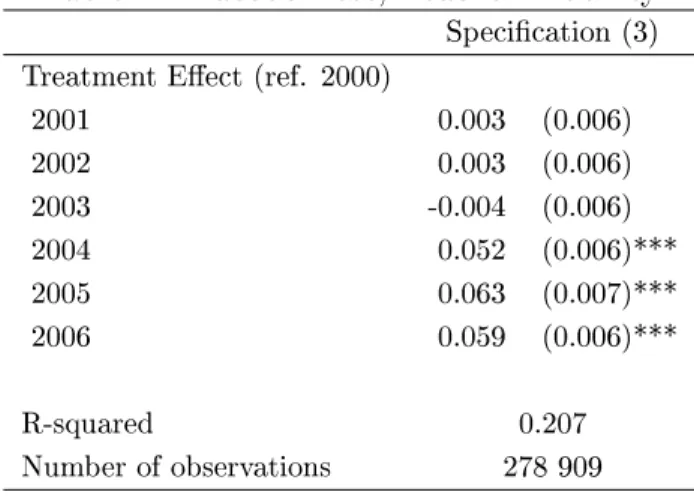
We conduct several robustness checks to investigate the sensitivity of our ndings. First, we perform a placebo test. Based on Equation 2, we test for plausible reform eects in the years before the nested accountability reform. Reform eects should not be found before the implementation of the nested accountability reform if there exist a common trend. Table 4 shows the year-specic eects for lower secondary education in Oslo before, during and
after the implementation of the nested accountability reform. The DDD-estimates are indeed insignicant in the pre-treatment years 2001, 2002 and 2003. The dierence between lower secondary and primary education teachers in Oslo and the rest of the country thus have a common trend before the implementation of the reform.
Table 4: Placebo Test, Teacher Mobility
Specication (3) Treatment Eect (ref. 2000)
2001 0.003 (0.006) 2002 0.003 (0.006) 2003 -0.004 (0.006) 2004 0.052 (0.006)*** 2005 0.063 (0.007)*** 2006 0.059 (0.006)*** R-squared 0.207 Number of observations 278 909 Note: See Table 2
To investigate further whether the results are sensitive to the choice of comparison group, we rst exclude small schools (less than 20 persons in full-time positions per school) as a robustness check as there are few small schools in the treatment group. This does not change our DDD-estimates. Neither does excluding schools with high immigrant share, which are concentrated in the treatment area.
It might still be a concern that the labor market for teachers in lower secondary education is dierent than for teachers in primary education, and that there are dierences in labor market conditions in Oslo compared to the rest of the country. We therefore change the comparison group to rst only include school districts around Oslo, which are part of the same labor market region, and then to only include the main cities in Norway, which might have similar and, on average, better pools of applicants. None of these changes in the comparison group
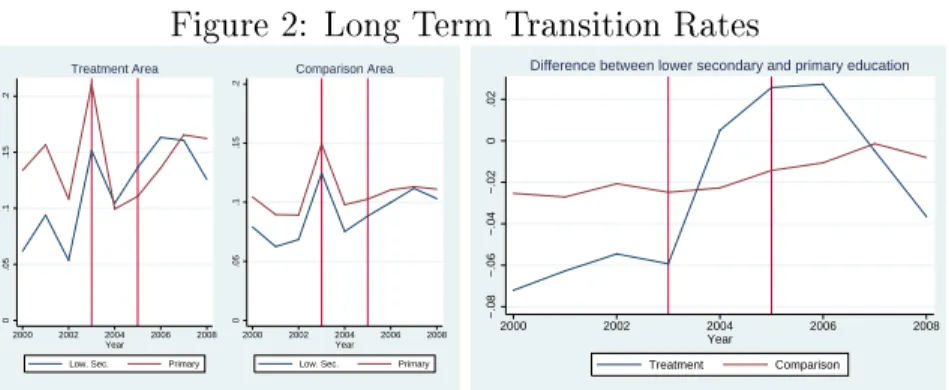
Figure 2: Long Term Transition Rates 0 .05 .1 .15 .2 2000 2002 2004 2006 2008 Year Low. Sec. Primary
Treatment Area 0 .05 .1 .15 .2 2000 2002 2004 2006 2008 Year Low. Sec. Primary
Comparison Area −.08 −.06 −.04 −.02 0 .02 2000 2002 2004 2006 2008 Year Treatment Comparison
Difference between lower secondary and primary education
inuence our DDD-estimates (results not shown). 5.2.2 Long-term eects
No long-term eects (for the years 2007-2008) on teacher mobility of the nested accountability reform are found in lower secondary education in Oslo. The eect fades out in 2007 and is non-existent in 2008 (results not shown). Figure 2 shows that the transition rate for teachers in lower secondary education in the reform district decreases after 2006, while it rises for teachers in primary education in the reform district. Written performance assessments were introduced for primary schools in Oslo in 2006, thus increasing accountability intensity for these teachers. An increase in transition rates is also observed in the comparison area post 2006, which could be expected as a consequence of the national 2006 school reform. From 2006, there is an alignment of accountability systems across the country, which is coherent with the pattern for teacher turnover. In this case, the lack of long-term eects strengthens our argument that school accountability does in fact increase teacher mobility.
5.3 Teacher sorting
Which types of teachers sort into schools under school accountability? The previous analysis were concerned with the outow of teachers, and notably teacher turnover among high-ability teachers. We now study changes in the ability distribution of the stock of teachers at the school level. By estimating the DDD-eect using Equation 3, we disclose if there are any sorting eects.
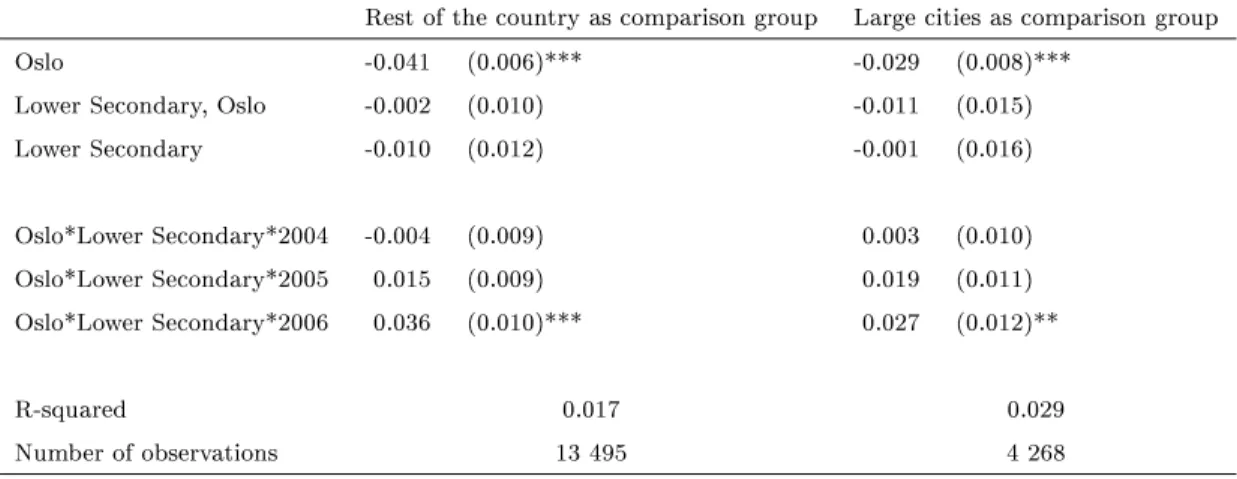
The mean teacher ability increases in the reform schools in 2005 (not statistically sig-nicant) and 2006 (statistically sigsig-nicant), as seen in Table 5. The positive 2006-eect on mean teacher ability amounts to 3.6 percent of a standard deviation within a school. This means that even though the nested school accountability reform does not encourage the right pattern of retention as seen in Section 5.1, lower secondary schools in Oslo are able to attract high-ability teachers.
Large cities face a dierent pool of potential applicants for available teacher positions than the rest of the country. Sorting may thus be dierent in the large cities than in the rest of the country, so we repeat the analysis only with the main cities including areas around these cities as comparison group. Reassuringly, we nd similar results as when using the rest of the country as comparison group. When performing placebo tests, no signicant eects are found for the pre-reform years (results not shown).
Also schools performing below average are able to attract high-quality teachers. Other studies nd adverse eects on teacher turnover in low-performing schools (e.g., Clotfelter et al., 2004) and adverse eects on school principal mobility in low-performing schools (e.g., Li, 2012). Dizon-Ross (2014), on the other hand, nds that a lower accountability grade among
Table 5: The Eect of Accountability on Teacher Sorting, DDD-specication
Rest of the country as comparison group Large cities as comparison group
Oslo -0.041 (0.006)*** -0.029 (0.008)***
Lower Secondary, Oslo -0.002 (0.010) -0.011 (0.015)
Lower Secondary -0.010 (0.012) -0.001 (0.016) Oslo*Lower Secondary*2004 -0.004 (0.009) 0.003 (0.010) Oslo*Lower Secondary*2005 0.015 (0.009) 0.019 (0.011) Oslo*Lower Secondary*2006 0.036 (0.010)*** 0.027 (0.012)** R-squared 0.017 0.029 Number of observations 13 495 4 268
Note: See Table 2
schools at the bottom end of the school grade distribution decreases teacher turnover among high-quality teachers and increases joining teachers' quality.
Even if we identify a positive sorting eect, it is not certain that the same result applies to all parts of the country. School districts facing diculties with recruitment in the rst place are constrained in recruiting high ability teachers, and negative sorting may thus be a concern. In Oslo, we nd that the positive sorting eect is smaller for schools with the highest turnover in the reform period. Schools that need to hire a high number of new teachers struggle to attract enough teachers with high academic achievements.
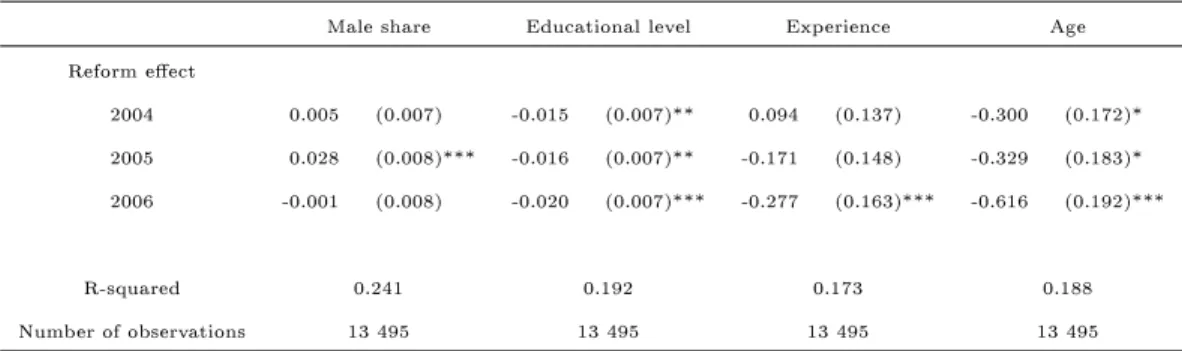
Table 6 shows the compositional eects concerning other teacher characteristics than abil-ity. Column 1 shows how the male share in the schools are aected by the reform. There are positive eects on the male share in 2005, but such a nding disappears in 2006. For all other characteristics (educational level, experience and age), the compositional eect is growing with exposure time to the reform: We nd a slight negative eect on the share with a designated teacher degree, a decrease in experience as a teacher, and reduced mean age at the schools. In 2006, i.e., the third year after implementation, the mean experience is on
Table 6: Other Compositional Eects, DDD-specication
Male share Educational level Experience Age Reform eect 2004 0.005 (0.007) -0.015 (0.007)** 0.094 (0.137) -0.300 (0.172)* 2005 0.028 (0.008)*** -0.016 (0.007)** -0.171 (0.148) -0.329 (0.183)* 2006 -0.001 (0.008) -0.020 (0.007)*** -0.277 (0.163)*** -0.616 (0.192)*** R-squared 0.241 0.192 0.173 0.188 Number of observations 13 495 13 495 13 495 13 495
Note: See Table 2
average reduced by a third of a year. Table A.1 shows that mean experience in the sample is 10 years. This could explain why we do not nd even larger compositional eects for age and experience.
The sorting eects are more subtle than the mobility eects. If estimating a similar model as Equation 3 only with number of teachers quitting as the outcome variable, on average between 2 and 2,5 more teachers quit in each school per year following the reform. The teacher workforce in each school consists of on average 30 persons. It thus takes time before there are any substantial compositional changes in the teacher workforce. Teacher composition eects, in contrast to teacher turnover, are not immediate responses, but are accumulated over time. That is, a sorting eect in yeart does not only depend on changes in the teacher
ability-composition in year t, but also the years in advance. We therefore cannot attribute a 2006
sorting eect only to the external part of the reform.
6 What about student achievement?
Ideally, we would like to measure the impact of school accountability on student achievement, and furthermore decompose a potential net eect into sorting and incentive eects. However,
we are not able to identify a causal eect on student achievement. No measure of student per-formance is available for primary education, thus we cannot use the same empirical approach as for the mobility and sorting analysis. A common trend assumption across school districts is a strong assumption when each school district is responsible for its own policies. In addi-tion, the treated school district is dierent from other school districts in terms of teacher and student composition: Oslo has a higher share of immigrant students, more dispersed social background of the student body, and more teachers with a master's degree compared to the rest of the country.
There are only two years of observations pre-reform. We therefore do not compose a synthetic control group. For decomposing any eects on student achievement into incentive and sorting eects, it would be necessary to link teachers and students for a measure of teacher value added. Such data are not available to us.
Even though we cannot make causal inference with our DD-framework, comparing student achievement in Oslo to the rest of the country, it is interesting to check if there are any patterns in the data following the nested school accountability reform. To measure the inuences on student achievement, we construct an index based on 10th grade performance. It includes grades obtained in Math, English and Norwegian, in addition to central exam scores, and corresponds to the unadjusted school quality indicator calculated for all schools in Oslo in 2005. The test scores are normalized with mean 0 and standard deviation 1.
We nd a negative estimate of being in a lower secondary school in the reform district in both 2004 (signicant) and 2005 (not signicant). In 2006, it shifts to a small, but signicantly positive estimate, which amounts to about 3 percent of a standard deviation.
there-fore more manipulable than central exam scores. We nd, however, no indication of teachers in Oslo inating their students' grades as they do not seem to increase more relative to central exam scores. The use of student grades and exams scores as a performance indicator, that are high stakes for the students, and excluding sanctions and rewards may have facilitated a non-gaming behavior. The choice of performance indicator and the lack of gaming may also explain the low increase in student achievement that we nd in Oslo relative to other studies. We nd a signicantly positive placebo eect in 2003. We are thus not able to conrm a common trend before the reform.18 Although not causal, our results on student achievement
are coherent with the ndings on teacher sorting, with a positive sorting eect in terms of teacher ability in 2006. Positive sorting accumulated over time may lead to improved student performance in 2006.
There are other compositional changes due to the reform. Teacher experience, which is considered relevant for student achievement (e.g., Wiswall, 2013), is slightly reduced. Posi-tive sorting in terms of teacher ability and decreased experience level could pull in dierent directions, and impede the inuence of positive sorting.
Teacher turnover may in itself have a negative eect on student achievement (e.g., Ronfeldt et. al., 2013), and could be linked to the decreased student achievement that we nd in the rst years of the reform.
We cannot rule out that the market element added in 2005 contributed to increasing student achievement through an incentive eect. Furthermore, there might be an additional incentive eect through teacher sorting: Joining teachers of high quality may work as an incen-18We also construct a comparison group based on propensity score matching; matched on characteristics for
parental education, migration characteristics (migration age and migration area), and teacher characteristics (gender and education). Using such a comparison group does not alter our results.
tive for incumbent teachers to increase their eort and performance (Jackson and Bruegmann, 2009).
When checking the eects on student achievement for the schools with the highest turnover in the treatment period, the eects on student achievement is smaller than the results from the whole sample. Schools with turnover above the mean also have smaller positive eects on teacher sorting, indicating that positive sorting could contribute positively to student achievement.
7 Concluding remarks
It is essential to understand teacher mobility and teacher sorting if we want to design adequate incentives for teachers and comprehend school performance. In this paper, we have studied two accountability regimes, one internal and one external, and evaluated their causal eects on teacher mobility and sorting. We have also discussed teacher sorting as a mechanism for increased student achievement under school accountability.
We nd signicantly increased teacher mobility in the years after the internal part of the reform. When using a DDD-estimator, we nd that teacher mobility increases with about 6 percentage points after the reform from a baseline of 10 percent. The external part does not trigger teacher turnover to a higher extent than the internal part. The majority of teachers who change jobs leave the public school sector entirely.
Although the turnover rate increases substantially, the increase in the number of teachers leaving their job is still not dramatic. On average between 2 and 2,5 more teachers quit in each school per year following the reform, from an average teacher stock of 30 persons.
We nd that high-ability teachers respond more strongly in terms of teacher mobility than low-ability teachers. Nonetheless, high-ability teachers are largely replaced by high-ability teachers: Despite adverse turnover eects, treated schools experience a positive sorting eect after the external reform, as measured in terms of teachers' own grades from higher education. In contrast to teacher turnover, teacher sorting eects are not likely to be immediate responses, but are accumulated over time. We therefore cannot attribute the positive sorting eect only to the external part of the reform.
In accordance with the ndings for teacher sorting, we nd a small positive relationship between student achievement and school accountability after the external part of the reform. With more suitable data, the causal impact on student achievement could be studied, and sorting and incentive eects could be better disentangled by linking teachers and students. Furthermore, comparing a value added measure to an indicator of teachers' own grades could be interesting in order to see how strongly these two measures of teacher quality are correlated.
References
[1] Angrist, J. and Lavy, V. (2009). The Eects of High Stakes School Achievement Awards: Evidence from a Randomized Trial. American Economic Review 99, 301331.
[2] Angrist, J., Lang, D., and Oreopoulos, P. (2009). Incentives and Services for College Achievement: Evidence from a Randomized Trial. American Economic Journal: Applied Economics 1, 1, 1-28.
[3] Angrist, J. and Pischke, J.-S. (2009). Mostly Harmless Econometrics: An Empiricist's Companion Joshua D. Princeton University Press
[4] Barlevy G. and Neal D. (2012). Pay for Percentile. American Economic Review 102, 1805-1831.
[5] Barth, E. and Moene, K.O. (2000). Er lønnforskjellene for små? NOU No. 21, Oslo, Ministry of Finance.
[6] Bettinger, E.P. (2012). Paying to learn: The eect of nancial incentives on elementary school test scores. Review of Economics and Statistics 94, 686-698.
[7] Bishop, J. H., Mane, F., Bishop M., and Moriarty, J. (2001). The Role of End-of-Course Exams and Minimal Competency Exams in Standards-Based Reforms. In Brookings Pa-pers in Education Policy, edited by Diane Ravitch, 267-329.
[8] Boyd, D., Lankford, H., Loeb, S., Ronfeldt, M. and Wycko, J. (2011). The Role of Teacher Quality in Retention and Hiring: Using application-to-transfer to uncover prefer-ences of teachers and schools. Journal of Policy Analysis and Management 30, 1, 88110.
[9] Burgess, S., Wilson, D., and Worth J. (2013). A Natural Experiment in School Account-ability: the impact of school performance information on pupil progress and sorting. Journal of Public Economics 106, 57-67.
[10] Carnoy, M. and Loeb, S. (2002). Does External Accountability Aect Student Outcomes? A Cross-State Analysis. Educational Evaluation and Policy Analysis 24, 4, 305-331. [11] Chingos, M. and West, M. (2012). Do More Eective Teachers Earn More Outside the
Classroom? Education Finance and Policy 7, 1, 8-43.
[12] Clotfelter, C.T., Ladd, H.F., Vigdor, J.L., and Diaz, R.A. (2004). Do School Account-ability Systems Make it more dicult for Low-Performing Schools to Attract and Retain High-Quality Teachers? Journal of Policy Analysis and Management 23, 2, 251-271. [13] Clotfelter, C.T., Ladd, H.F., and Vigdor, J.L. (2006). Teacher-Student Matching and the
Assessment of Teacher Eectiveness. Journal of Human Resources 41, 4, 778820. [14] Clotfelter, C.T., Ladd, H.F., and Vigdor, J.L. (2007). How and Why Do Teacher
Creden-tials Matter for Student Achievement? Economics of Education Review, 26, 6, 673-682. [15] Deci, E. L. and Ryan, R. M. (1985). Intrinsic motivation and self-determination in human
behavior. New York: Plenum.
[16] Dewatripont M., Jewitt, I., and Tirol, J. (1999). The Economics of Career Concerns, Part II: Applications to Missions and Accountability of Government Agencies. Review of Economic Studies 66, 199-217.
[17] Dizon-Ross, R. (2014). How Do School Accountability Reforms Aect Teachers? Evidence from New York City. Working Paper.
[18] Dixit, A. (2002). Incentives and Organizations in the Public Sector: An Interpretative Review. Journal of Human Resources 37, 4, 696-727.
[19] Dohmen, T. and Falk, A. (2010). You get what you pay for: Incentives and Selection in the Education System. Economic Journal 120, 256-271.
[20] Dolton, P. and van der Klaauw, W. (1995). Leaving teaching in the UK: A duration analysis. Economic Journal 105, 429, 431-44.
[21] Dolton, P. and van der Klaauw, W. (1999). The turnover of teachers: A competing risks explanation. Review of Economics and Statistics 81, 3, 543-52.
[22] Falch, T. and Strøm, B. (2005). Teacher turnover and non-pecuniary factors. Economics of Education Review 24, 611-631.
[23] Feng, L., Figlio, D., and Sass, T. (2011). School Accountability and Teacher Mobility. Published in E. Hanushek, S. Machin, and L. Woessmann, eds., Handbook of Economics of Education , volume 3, Elsevier.
[24] Fehr, E. and Falk, A. (2002). Psychological foundations of incentives. European Economic Review 46, 687-724.
[25] Fiva, J.H. and Kirkebøen, L.J. (2011). Information Shocks and the Dynamics of the Housing Market. Scandinavian Journal of Economics 113, 3, 525-552.
[26] Figlio, D. (2006). Testing, Crime and Punishment. Journal of Public Economics 90, 4-5, 837-851.
[27] Figlio, D. and Getzler, L. S. (2006). Accountability, Ability and Disability: Gaming the System. Published in Gronberg, T. (ed.) Advances in Microeconomics. Elsevier.
[28] Figlio, D. and Loeb, S. (2011). School Accountability. Handbook in Economics of Edu-cation, Volume 3, Amsterdam: North Holland, 383-421.
[29] Fritjers P., Shields, M., and Price, S.W. (2004). To teach or not to teach? Panel data evidence on the quitting decision. IZA DP No. 1164.
[30] Hanushek, E., Piopiunik M., and Wiederhold, S. (2014). The Value of Smarter Teachers: International Evidence on Teacher Cognitive Skills and Student Performance. NBER Working paper 20727.
[31] Hanushek, E., Kain, J.F, and Rivkin S. (1999). Do Higher Salaries Buy Better Teachers? NBER Working paper 7082.
[32] Hanushek E. and Raymond, M. (2004). Does School Accountability Lead to Improved Student Performance? Journal of Policy Analysis and Management 24, 2, 297-327. [33] Hanushek E. and Rivkin, S.G. (2006). Teacher Quality. Handbook of the Economics of
Education, Volume 2, Amsterdam: North Holland, 1052-1078.
[34] Harri, D. and Herrington, C. (2006). La régulation par les résultats contribue-t-elle à l'amélioration des écoles? Améliorer l'école (15), D. Meuret et G. Chapelle (eds.), Presses universitaires de France, 204-213.
[35] Henke, R. R., Chen, X., Geis, S., and Knepper P. (2000). Progress through the teacher pipeline: 1992-93 college graduation and elementary/secondary school teaching as of 1997. NCES 152, Washington DC, US Department of Education.
[36] Holmstrom, B. (1982). Managerial Incentives - a Dynamic Perspective. in Essays in Honor of Lars Wahlbeck, Helsinki: Swedish School of Economic.
[37] Hoxby, C.M. and Leigh, A. (2004). Pulled Away or Pushed Out? Explaining the Decline of Teacher Aptitude in the United States. American Economic Review 94, 2, 236-240. [38] Hægeland, T., Kirkebøen, L., Raaum, O., and Salvanes K.G. (2004). Marks across Lower
Secondary Schools in Norway: What can be explained by the Composition of Pupils and School Resources? Report No. 11, Statistics Norway.
[39] Jackson, C. K. (2009). Student demographics, teacher sorting, and teacher quality: Evi-dence from the end of school desegregation. Journal of Labor Economics 27, 2, 213-56. [40] Jackson, C. K. and Bruegmann, E. (2009). Teaching Students and Teaching Each Other:
The Importance of Peer Learning for Teachers. American Economic Journal: Applied Economics, 1, 4, 85108.
[41] Jacob, B. and Levitt, S. (2003). Rotten apples: An investigation of the prevalence and predictors of teacher cheating. Quarterly Journal of Economics 118, 843-877.
[42] Jacob, B. (2005). Accountability, Incentives and Behavior: Evidence from School Reform in Chicago. Journal of Public Economics 89, 5-6, 761-796.