NBER WORKING PAPER SERIES
EXPLAINING CHARTER SCHOOL EFFECTIVENESS
Joshua D. Angrist
Parag A. Pathak
Christopher R. Walters
Working Paper 17332
http://www.nber.org/papers/w17332
NATIONAL BUREAU OF ECONOMIC RESEARCH
1050 Massachusetts Avenue
Cambridge, MA 02138
August 2011
Special thanks go to Carrie Conoway, Sarah Cohodes, Jon Fullerton, Harvard's Center for Education
Policy Research, and the Massachusetts Department of Education for assistance and data, and to our
charter team collaborators, Sue Dynarski and Tom Kane for their valuable input. Seminar participants
at Boston College, Columbia, HEC Montreal, and the August 2011 Impact Evaluation Network meeting
in Buenos Aires provided extensive helpful comments. We thank the Massachusetts Department of
Elementary and Secondary Education for financial support. Pathak also gratefully acknowledges support
from the NSF. The views expressed herein are those of the authors and do not necessarily reflect the
views of the National Bureau of Economic Research.
NBER working papers are circulated for discussion and comment purposes. They have not been
peer-reviewed or been subject to the review by the NBER Board of Directors that accompanies official
NBER publications.
© 2011 by Joshua D. Angrist, Parag A. Pathak, and Christopher R. Walters. All rights reserved. Short
sections of text, not to exceed two paragraphs, may be quoted without explicit permission provided
Explaining Charter School Effectiveness
Joshua D. Angrist, Parag A. Pathak, and Christopher R. Walters
NBER Working Paper No. 17332
August 2011, Revised Agusut 2011
JEL No. H75,I21,I22,I28,J24
ABSTRACT
Estimates using admissions lotteries suggest that urban charter schools boost student achievement,
while charter schools in other settings do not. We explore student-level and school-level explanations
for these differences using a large sample of Massachusetts charter schools. Our results show that
urban charter schools boost achievement well beyond ambient non-charter levels (that is, the average
achievement level for urban non-charter students), and beyond non-urban achievement in math. Student
demographics explain some of these gains since urban charters are most effective for non-whites and
low-baseline achievers. At the same time, non-urban charter schools are uniformly ineffective. Our
estimates also reveal important school-level heterogeneity in the urban charter sample. A non-lottery
analysis suggests that urban schools with binding, well-documented admissions lotteries generate larger
score gains than under-subscribed urban charter schools with poor lottery records. We link the magnitude
of charter impacts to distinctive pedagogical features of urban charters such as the length of the school
day and school philosophy. The relative effectiveness of urban lottery-sample charters is accounted
for by over-subscribed urban schools' embrace of the No Excuses approach to education.
Joshua D. Angrist
Department of Economics
MIT, E52-353
50 Memorial Drive
Cambridge, MA 02142-1347
and NBER
[email protected]
Parag A. Pathak
MIT Department of Economics
50 Memorial Drive
E52-391C
Cambridge, MA 02142
and NBER
[email protected]
Christopher R. Walters
MIT Economics
50 Memorial Drive
Cambridge, MA 02142
[email protected]
I
Introduction
A growing body of evidence suggests that urban charter schools have the potential to generate impressive achievement gains, especially for minority students living in high-poverty areas. In a series of studies using admissions lotteries to identify causal effects, we looked at the impact of charter attendance in Boston and at a KIPP school in Lynn, Massachusetts (Abdulkadiro˘glu et al., 2009, 2011; Angrist et al., 2010a, 2010b). Boston and Lynn charter middle schools increase student achievement by about 0.2 standard deviations (σ) per year in English Language Arts (ELA) and about 0.4σ per year in math, relative to traditional public schools. Among high school students, attendance at a Boston charter school increases student achievement by about 0.2σ per year in ELA and 0.3σ per year in math. Outside of Massachusetts, lottery studies of charter schools in the Harlem Children’s Zone (Dobbie and Fryer, 2011) and a Washington DC charter boarding school (Curto and Fryer, 2011) document similarly large gains. Studies of Chicago and New York charter schools also report positive effects (Hoxby and Rockoff, 2004; Hoxby, Murarka and Kang, 2009).
While these results are encouraging, they come from schools operating in traditional (for charters) urban settings. Although interest in charter schools is growing in school districts outside central cities (see, e.g., the discussion of New York area charters in Hu, 2011), results for more diverse sets of charter schools are also more mixed. In a recent report evaluating roughly two dozen Massachusetts charter schools from around the state, we find little evidence of achievement gains at schools outside of high-poverty urban areas (Angrist et al., 2011). Some of the estimates for non-urban Massachusetts charters show significant negative effects. These results echo findings from a multi-state study of 36 charter middle schools using admissions lotteries (Gleason et al., 2010). Here too, charter schools outside of urban areas seem to do little for achievement, though, as in our earlier work, urban schools with high-minority, high-poverty enrollment generate some gains. Other studies using statistical controls rather than entrance lotteries also document heterogeneity in the effects of charter schools. Hoxby (2004) and Zimmer et al. (2009) find that newly opened schools are less effective than older schools. Imberman (2011) reports that among charter schools in a large urban school district in the Southwest, schools that began as charters have large effects on discipline and attendance, while converted schools do not.
Our analysis focuses on heterogeneity in the effects of charter schools across demographic groups and between urban and non-urban areas. This breakdown is motivated by our earlier findings for Massachusetts, and by research showing similarly heterogeneous effects for other education alternatives. Using data on cohorts of students graduating in the early 1980s, Evans and Schwab (1995) and Neal (1997) show that Catholic school attendance leads to increases
in high school graduation and college attendance. Both studies find larger benefits for black students and for students in urban settings. Grogger et al. (2000) and Altonji et al. (2005) report similar results on Catholic schooling for more recent cohorts. For example, Grogger et al. report that Catholic high school attendance increases the probability of graduation by 18 to 24 percentage points for urban minority students; estimates for other groups are less than 10 percentage points and mostly insignificant.
The analysis here reveals similar heterogeneity for charter schools in Massachusetts and develops a framework for interpreting this heterogeneity using both student- and school-level explanatory variables. We begin with a semiparametric analysis of heterogeneous potential outcomes that assigns a role to variation in no-treatment counterfactuals and to charter ap-plicants’ demographic characteristics and baseline scores. This investigation also includes a Oaxaca-Blinder (1973) style decomposition of the urban charter advantage.
We then turn to an analysis that attempts to isolate school-level characteristics that might explain differences in charter school effectiveness. Our school-level investigation of charter effect heterogeneity is built on a set of observational (i.e., non-lottery) estimates that rely on statistical controls to eliminate selection bias. We show that in the sample of schools for which lotteries can be used to capture causal effects, the observational analysis does a good job of replicating lottery-based findings. At the same time, the observational analysis suggests that the sample of urban schools for which a lottery-based analysis is feasible, that is, over-subscribed schools with good historical lottery records, boost scores more than other urban charter schools. Our school-level analysis explains the difference in effectiveness between lottery and non-lottery schools as well as the urban charter advantage.
The next section details school participation, describes the data, and outlines our empirical strategy for the lottery analysis. Section III presents the findings that motivate our investi-gation of charter effect heterogeneity. Section IV outlines the econometric framework used to investigate this heterogeneity and reports the results of our investigation. These results show that students at urban charters in the lottery sample are typical of the urban student popula-tion, and that urban charter attendance boosts achievement well beyond ambient non-charter levels. Student demographics and baseline scores play a role in this – urban schools work best for minority students and students with low baseline scores – but non-urban charters are largely ineffective. Section V compares observational and lottery-based estimates in the subsample for which a lottery-based analysis is possible and discusses a school-level analysis of the observa-tional estimates. Urban and lottery-sample charter effectiveness can be explained by adherence to a No Excuses approach to urban education that emphasizes instruction time, comportment, and focuses on traditional math and reading skills. Conditional on No Excuses status, factors such as time in school and teacher characteristics have little predictive value for school-specific
effects. Finally, consistent with theNo Excuses explanation of the urban charter advantage, we show that urban charter attendance boosts the likelihood that charter applicants are subject to disciplinary action, while non-urban charter attendance has no effect on this outcome.
II
Lottery Analysis: Data and Empirical Strategy
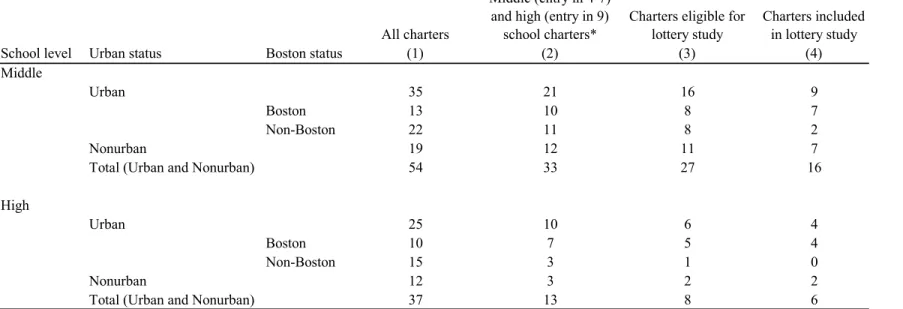
We attempted to collect lottery data for the set of Massachusetts charter schools serving middle and high school grades and meeting a set of pre-specified eligibility criteria.1 The school selection process is detailed in Table 1. To be eligible for our analysis, schools had to accept students in the relevant entry grades (4th-7th grade for middle school and 9th grade for high school). We excluded closed schools and alternative schools serving non-traditional populations (usually students at risk of dropping out). We also excluded schools that opened after the 2009-2010 school year. The resulting set of eligible schools includes 27 of the 54 charters serving middle school grades and eight of 37 schools serving high school grades.2 Three eligible schools serve both middle and high school grades, so there are 32 eligible campuses.3 Some eligible schools are not included in the lottery analysis; some were under-subscribed, while others failed to keep sufficient lottery records. The final sample of over-subscribed schools with usable records includes 16 middle schools and six high schools. These schools are listed in Table A1. Nine of the lottery-study participating middle schools are in urban areas, with seven of these in Boston, one inside Interstate Highway 495, and one near the Rhode Island border. The other seven are in non-urban areas, three in the center of the state, one on Cape Cod, two inside I-495, and one near the New Hampshire border. Four participating high schools are in Boston. One non-urban high school in the lottery sample is on Cape Cod, and the other is near Springfield.
Much of our analysis focuses on differences between charter schools in urban and non-urban areas. This distinction is motivated by the evidence, reported here and elsewhere, that charter schools serving heavily minority, high-poverty student populations in urban areas are more likely to boost achievement than are other sorts of charter schools, and by similar findings for Catholic schools (Gleason et al., 2010; Grogger et al., 2000).4 To document differences in charter school
1
We focus on middle and high schools because data for elementary school lotteries are much less widely available. Moreover, pre-lottery test scores – a key component of the observational analysis – are unavailable for elementary school applicants.
2Many charters extend through the high school grades but do not have entrance lotteries for high school. 3
Schools are classified as both middle and high if they have entrance lotteries at both levels, or if lottery records at the middle school level were available early enough for participants to be observed in high school. Our universe includes 69 unique schools.
4
We define urban areas to be those in which the local district superintendent participates in the Massachusetts Urban Superintendents Network. In our sample, the distinction between urban and non-urban charter schools is essentially identical to splits based on fraction eligible for free lunch or fraction minority.
practices across areas, we surveyed the full set of eligible charter schools, regardless of the quality of their lottery records. Among 32 eligible schools, 28 school administrators completed this survey; we received a total of 30 responses since two surveyed schools are eligible at both the middle and high school levels.
Our survey revealed important differences between urban and non-urban charter schools. Table 2 summarizes the survey responses. Urban schools are younger than non-urban schools; in Spring 2010, the average urban school had been open for 8.2 years, while the average non-urban school had been open for 11.4 years. Urban charter schools also run a longer school day and year than do non-urban schools. The average urban charter year lasts 189 days and has a school day of 464 minutes, compared to 183 days and 422 minutes at non-urban schools. The additional time appears to go to increased math and reading instruction; urban schools spend 35 extra minutes per day on math and 40 extra minutes per day on reading. Urban charter schools are also 38 percent more likely to have Saturday school.
Our survey also covers aspects of school philosophy and organization. Urban charter schools are more likely than non-urban charters to require parents to sign a contract (82 percent com-pared to 46 percent), to require students to sign a contract (71 percent comcom-pared to 55 percent), and to use uniforms (88 percent compared to 73 percent). Urban charter schools are also much more likely to use a formal reward and punishment system to shape student behavior; 65 per-cent of urban schools use such a system, while only 18 perper-cent of non-urban schools do so. The survey results reveal a sharp division between urban and non-urban charters with respect to the No Excuses approach to education. As discussed by Thernstrom and Thernstrom (2003) and Carter (2000),No Excuses principles include a strict disciplinary environment, an emphasis on student behavior and comportment, extended time in school, and an intensive focus on tra-ditional reading and math skills. Seventy-one percent of urban charter administrators identify somewhat or fully withNo Excuses, while no non-urban charter identifies with this approach.
The bottom rows of Table 2 compare the inputs and resources used by urban and non-urban charter schools. Urban schools are more likely to be eligible for Title I status and have somewhat higher per-pupil expenditures than non-urban charter schools ($14,095 compared to $11,090). On the other hand, student/teacher ratios at urban and non-urban charters are similar. Urban schools have younger teachers as measured by proportions under age 32 and over age 49, and are more likely to hire paid tutors to work with their students. Teacher departures, requirements to take student calls after hours, and the use of unpaid tutors and volunteers are similar across the two types of schools.
Student Data
The student-level data used in our analysis comes from an administrative record-keeping sys-tem with complete coverage of the students enrolled in Massachusetts’ public schools.5 Our coverage period runs from the 2001-2002 school year through the 2009-2010 school year. The administrative records include information on student race/ethnicity, gender, special education status, limited English proficiency status, free/reduced-price lunch status, town of residence, and school(s) of attendance, as well as raw and scaled scores on Massachusetts Comprehen-sive Assessment System (MCAS) exams. The MCAS is a set of high-stakes standardized tests given to students in Massachusetts’ public schools in grades 3 through 8 and 10. The primary outcomes analyzed in our study are MCAS scores in math and English Language Arts (ELA). Outcomes are post-lottery test scores in grades 4 through 8 for middle school and 10 for high school. The data appendix provides details on the availability of outcomes for each applicant cohort. For the purposes of this project, raw MCAS scores were standardized to have mean zero and standard deviation one by subject, grade level, and year.
Our data processing protocol assigns students to a single school for every year they appear in the data, even if they attended more than one school in a given year. Typically, students appearing on the roster of more than one school were assigned to the school they attended longest, though students with any time in a charter school in a given year are coded as having been a charter student for the year. If a student attended more than one charter, the student was assigned to the charter he or she attended the longest.
The analysis sample for the lottery study was constructed by matching applicant records from the 16 participating middle schools and six participating high schools to administrative records using applicants’ name, year, and grade. Where available, information on date of birth, town of residence, race/ethnicity, and gender was used to break ties. Ninety-two percent of applicants were matched. Applicants were excluded from the lottery analysis if they were disqualified from the lottery they entered (this mostly affected applicants to the wrong grade level). We also dropped siblings of current students, late applicants, and out-of-area applicants.6 Students missing baseline demographic information in the state database were dropped as well.
5
This is known as the Student Information Management System, or SIMS. See the data appendix for details.
6
Charter schools typically give priority to sibling applicants, as well as to students in the local school district (or sometimes region) in which they are located. Our applicant risk sets (discussed in the next section) distinguish between in-area and out-of-area applicants for schools that take substantial numbers of both. At schools with fewer than five out-of-area applicants, those out-of-area were dropped.
Descriptive Statistics
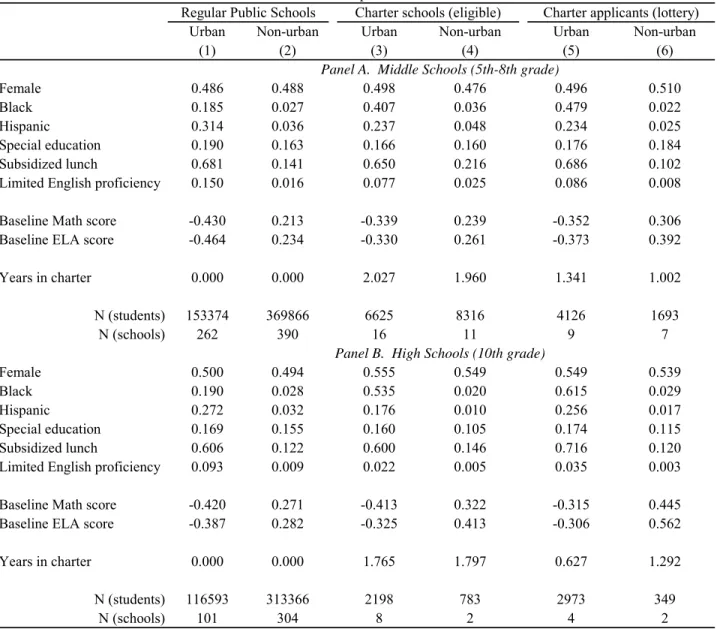
We begin with a statistical picture of the Massachusetts student population in traditional public and charter schools. Table 3 shows descriptive statistics for students enrolled in traditional public schools, students enrolled in eligible charter schools, and the sample of students who applied to oversubscribed charters participating in the lottery study, separately for urban and non-urban areas. Traditional schools are defined as those that are not charters, alternative, special education, exam, or magnet schools. For the six groups described in the table, we report average demographic characteristics, program participation rates, and average baseline test scores. Baseline scores are from 4th grade for middle school and 8th grade for high school. Traditional urban students look very different from traditional students in the rest of the state. Specifically, urban students are more likely to be black or Hispanic, to be English language learners (or of limited English proficiency, LEP), to participate in special education, and to receive a subsidized lunch. Urban students also have much lower baseline test scores than other public school students: urban students score 0.43σ and 0.46σ below the state average on math and ELA tests at the middle school level, respectively, and they score 0.42σ and 0.39σbelow the average at the high school level. In contrast, non-urban students score 0.21σ and 0.23σ above the average at the middle school level; the corresponding non-urban advantages in high school are 0.27σ and 0.28σ.
Eligible charter school students who live in urban and non-urban areas are more similar to their peers in regular public schools than to one another. There are, however, important differences by charter status as well. Urban charter schools serve a much higher fraction of black students than do urban public schools. Urban charter students are also less likely to be limited English proficient, to participate in special education, or to qualify for subsidized lunch. Charter school students in both urban and non-urban areas have slightly higher baseline test scores than their public school counterparts. Applicants to charter schools with observed entrance lotteries are similar to the population of enrolled charter students in both urban and non-urban areas. Empirical Strategy
The lottery-based identification strategy captures causal effects for applicants to over-subscribed charters with high quality lottery records. The second-stage equation in this context is
yigt =α2t+β2g+
X
j
δjdij+Xi0θ+τ sigt+igt, (1)
where yigt is a test score for student i in grade g in year t, α2t and β2g are year and grade
English proficiency, subsidized lunch status, and a female-minority interaction), and igt
repre-sents random fluctuations in test scores. The set of dij includes a separate dummy variable for
every combination of observed charter school lotteries (indexed byj) entered by students in the lottery sample. In what follows, we refer to these as “risk sets.” The variable of interest, sigt,
measures years spent in charter schools between application and test dates.7 The parameterτ captures the causal effect of charter school attendance.
OLS estimates of equation (1) may be biased because students do not choose to attend charter schools randomly. We therefore use a dummy variable, Zi, indicating lottery offers as
an instrument for time spent in charter school. The first stage for our 2SLS procedure is sigt=α1t+β1g+
X
j
κjdij+Xi0µ+πZi+ηigt, (2)
where π is the effect of a lottery offer on charter attendance. As in the second stage equation, the first stage includes risk set controls and baseline demographic characteristics, as well as year and grade effects. Over-identified models introduce risk-set-specific first-stage effects (πj∗dijZi).
Because lottery offers are randomly assigned within risk sets, they are likely to be indepen-dent of family background, stuindepen-dent ability or motivation, and any other unobserved charac-teristics of charter applicants. The appendix presents evidence in support of our lottery-based identification strategy. Specifically, Table A2 shows that conditional on risk set, winning the lottery is uncorrelated with student characteristics, which suggests that randomization was suc-cessful. Table A3 shows that we find followup scores for 91 percent of middle school applicants and 78 percent of high school applicants. In middle school, we are one percent more likely to find followup scores for lottery winners, but this imbalance is unlikely to explain the treatment effects discussed below.
Equations (1) and (2) describe a just-identified system with one endogenous variable and one instrument. The 2SLS estimate of τ can be obtained by taking the ratio of the reduced form effect of Zi onyigt and the first stage effect ofZi on sigt. The reduced form has the same
data structure and regressors as equation (2), replacing sigt with yigt on the left-hand side. In
an effort to increase the precision of our estimates, we also estimate overidentified models that allow the first stage effect to vary by risk set. In regressions for high school, only 10th grade test scores are included, and we cluster standard errors at the school-grade-year level. In regressions for middle school, we include the full set of non-repeat post-lottery test scores through 8th grade and add a second layer of clustering at the student level.
7Our definition of s
igt includes years spent at any charter school, including those without available lottery records. This specification is based on a simple benchmark with homogeneous treatment effects across charter schools. We investigate school-level heterogeneity in Section V.
Differences in effectiveness between urban and non-urban charter schools are a primary focus of our analysis, so we also generate separate estimates for these two groups. These estimates are produced using equations of the form
yigt =α2t+β2g+
X
j
δjdij +Xi0θ+τusuigt+τnsnigt+igt, (3)
wheresuigt and snigt are years in urban and non-urban charter schools. The first stage for urban attendance can be written
suigt=α1t+β1g+
X
j
κjdij +Xi0µ+πuZiu+πnZin+ηigt, (4)
whereZiuandZinindicate offers from urban and non-urban lotteries, with a similar specification for non-urban attendance.
III
Lottery Estimates
Charter school lottery offers increase the average duration of charter school attendance sharply. The first stage estimates reported in column (1) of Table 4 show that among applicants to charter middle schools, students who win a charter school lottery spend about 1 more year in a charter before being tested than do students not offered a seat. Applicants who win high school lotteries spend about half a year more attending a charter school than applicants who lose the lottery before taking MCAS tests. These first stage estimates are similar to those reported in Abdulkadiro˘glu et al. (2011) for a smaller sample of charter schools in Boston.
Middle school lottery winners outscore lottery losers by 0.06σ in ELA and 0.21σ in math. These reduced form estimates can be seen in column (2) of Table 4. High school lottery winners outperform lottery losers by about 0.11σin ELA, 0.16σ in math, 0.16σ in Writing Composition, and 0.14σ in Writing Topic Development. These estimates, like the middle school results, are precisely estimated and significantly different from zero.
Because the middle school first stage is close to one, middle school 2SLS estimates differ little from the corresponding reduced form estimates. The estimates shown in column (3) of Table 4 imply that a year of attendance at a lottery sample charter middle school increases ELA scores by 0.07σ and math scores by 0.21σ. Column (4) reports 2SLS estimates from overidentified models that include a full set of risk set and offer interactions as instruments. The results here are close to the just-identified estimates in column (3), though estimates from the overidentified models are slightly more precise.
The high school 2SLS estimates imply larger causal effects than those found for middle schools. The score gains generated by time spent in charter high schools are on the order of
0.22σ per year for ELA and 0.32σ per year for math. Writing gains also are estimated to be substantial; a year of charter attendance increases Writing Topic scores by 0.30σ and Writing Composition scores by 0.27σ. As in middle school, the high school results from overidentified models are close to the corresponding just identified estimates.
Estimates for the pooled state sample mask considerable heterogeneity by school type, a pattern documented in Table 5. Although first stage effects at urban and non-urban middle schools are similar, second stage middle school estimates differ sharply. The 2SLS estimates for urban middle schools, reported in column (3) of Table 5, suggest these schools generate gains of about 0.14σ in ELA and 0.34σ in math per year. By contrast, the estimates for non-urban charter middle schools are negative. In particular, as can be seen in column (6), charter students at non-urban middle schools are estimated to lose ground relative to their public school peers at a rate of 0.16σ per year in both ELA and math. Not surprisingly, the high school lottery results for urban schools are similar to the statewide results (since only two of the high schools in the state sample are non-urban). The 2SLS estimates for non-urban charter high schools are uniformly negative, but too imprecise to be conclusive.
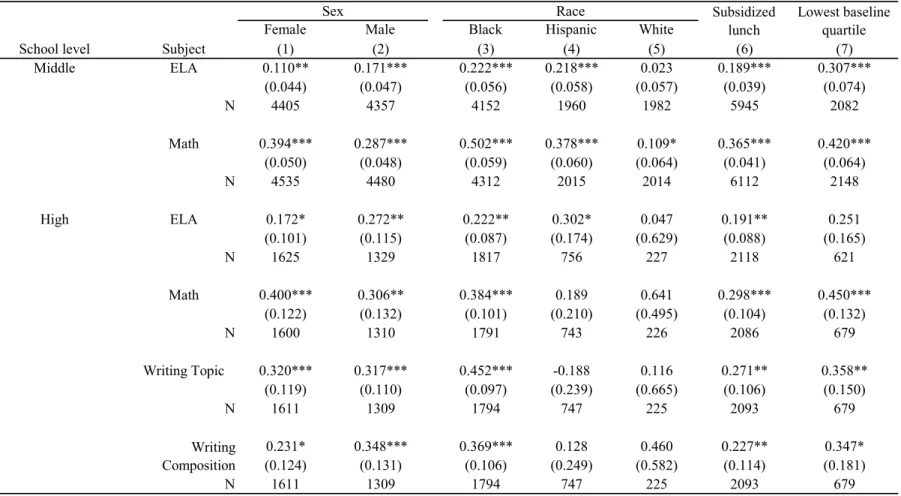
Subgroup variation in charter effects is documented in Tables 6 and 7, separately for urban and non-urban schools. These tables report the results of estimating equation (3) by 2SLS in various subsamples of students. Urban charter schools boost scores for most subgroups, though not uniformly. Girls realize larger gains in math, while boys see larger ELA gains. Black and Hispanic students benefit considerably from urban charter attendance in middle school, but the estimated math gains for whites are smaller and there is no increase in whites’ ELA scores. Urban charter middle schools appear to produce especially large achievement gains for students eligible for a subsidized lunch and for those with low baseline scores. Attendance at urban charter high schools increases math scores in every group and raises reading scores for everyone except whites, though positive high school effects on reading are not always significantly different from zero.
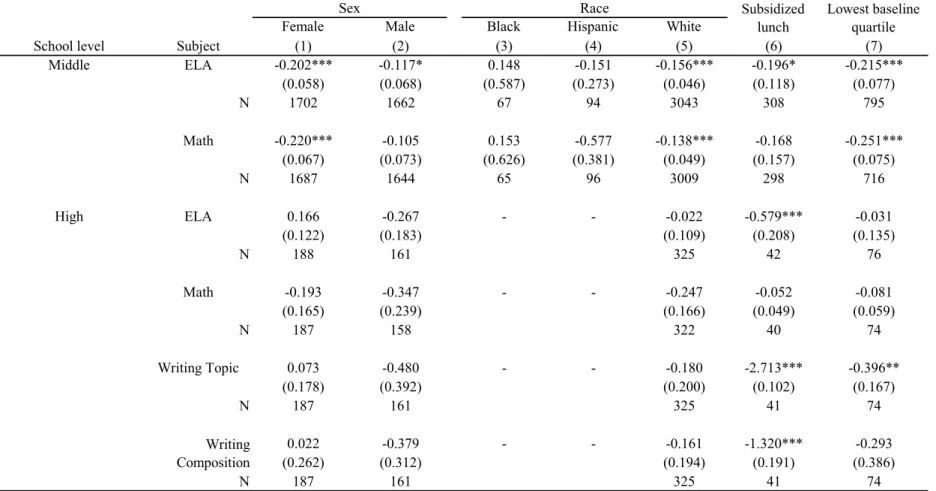
Non-urban charter attendance fails to raise scores for any of the subgroups examined in Table 7, apparently reducing achievement for girls, whites, and students with low baseline scores. Estimates for black and Hispanic students are not significantly different from zero. A year of non-urban charter middle school reduces free-lunch students’ ELA scores by 0.20σ, and reduces math scores in this group by 0.17σ, though the latter estimate is not statistically significant. Most of the estimates for non-urban high school charters are negative, though effects here are imprecise (estimates for black and Hispanic students are omitted due to small samples sizes in these non-urban groups).
IV
Differences in Students
We investigate student- and school-level explanations for the striking difference in causal effects at urban and non-urban charter schools. The student-level analysis is cast in a semiparamet-ric framework with heterogeneous potential outcomes, indexed against a Bernoulli treatment, Di∈ {0,1}, to indicate charter attendance. The Bernoulli setup focuses on heterogeneity while
abstracting from nonlinearities that seem second-order in this context (since the first stage effects of lottery offers are similar in the two settings for middle school, yet the effects there differ most dramatically). Let Y1i and Y0i denote potential test scores for student i in and out of charter
schools, and let Ui ∈ {u, n} indicate residence in an urban or non-urban area. The observed
outcome for studentiis
Yi =Y0i+ (Y1i−Y0i)Di.
In other words, we observe Y0i for applicants who don’t go to charter school and Y1i for those
who do.
Although our empirical work uses data from many lotteries, the analysis of heterogeneity is explained with reference to a single lottery. Offers in this lottery are indicated byZi, as before.
Potential treatment assignments, denoted D1i and D0i, tell us whether student i attends a
charter school if he wins or loses the lottery. Offers are randomly assigned and assumed to affect test scores only through charter attendance, so the potential outcome vector (Y1i, Y0i, D1i, D0i)
is independent of Zi. We also assume that winning an entrance lottery can only make charter
attendance more likely, so thatD1i ≥D0i ∀i, with strict inequality for some students.
Under these assumptions, instrumental variables estimation usingZi as an instrument forDi
in the sample of lottery applicants produces a local average treatment effect (LATE; Imbens and Angrist, 1994). Here, LATE is the effect of charter attendance for students induced to enroll in a charter school by winning an admissions lottery (the compliers, who haveD1i > D0i). When
computed separately for urban and non-urban students, IV estimates identify τl≡
El[Yi|Zi = 1]−El[Yi|Zi = 0]
El[Di|Zi = 1]−El[Di|Zi = 0]
=El[Y1i−Y0i|D1i > D0i], l∈ {u, n};
wherelindexes location andEldenotes an expectation over students in locationl. This is LATE
in each setting.
We analyze three sources of student-level heterogeneity that might account for the difference between τu and τn. The first is the urban/non-urban difference in treated and non-treated
counterfactuals (that is, distinct differences in average Y1i and Y0i). This investigation tells us
outcomes, or both. The second is variation in Y0i across charter and non-charter students
within each area. This tells us whether lottery compliers are unusual in either setting. Finally, we decompose the difference in charter effectiveness across urban and non-urban areas into a component due to differences in student populations and a component due to differences in effectiveness conditional on characteristics.
The Urban Gap in Treatment and No-Treatment Counterfactuals
The urban charter advantage can be broken down into two parts, the first capturing differences in potential outcomes in the treated state (differences inY1i) and the second capturing differences
in potential outcomes in the non-treated state (differences in Y0i). Specifically, we have
τu−τn=Eu[Y1i|D1i> D0i]−En[Y1i|D1i > D0i] | {z } γ1 (5) −(Eu[Y0i|D1i> D0i]−En[Y0i|D1i> D0i]) | {z } γ0 .
Here, γ1 measures the difference in treated outcomes for compliers at urban and non-urban charter schools, while γ0 measures the difference in non-treated outcomes between these two groups.
Pooling urban and non-urban charter applicants, we estimate γ0 using Yi(1−Di) =ψ(1−Di) +γ0(1−Di)·1{Ui=u}+
X
j
δjdij+i, (6)
with first stage
1−Di = X j κjdij+ X j πjdijZi+ηi. (7)
The first stage equation for the interaction between 1−Di and urban status uses the same
specification as equation (7).8 For a model without covariates, Abadie (2003) shows that 2SLS estimation of this type of system produces estimates of marginal mean counterfactuals for com-pliers; in this case, the 2SLS estimate is the mean of Y0i for compliers. (We estimate γ1 using a model that replaces (1−Di) withDi in equations (6) and (7).) Our parameterization differs
from Abadie’s in two ways. First, we are interested in thedifferencein marginal mean outcomes between urban and non-urban compliers: ψ equals the average of Y0i for lottery compliers in
non-urban areas, while ψ+γ0 is the average of Y0i for compliers in urban areas. Second, our
estimating equation includes a saturated model for risk sets. In this case, the 2SLS estimands are weighted averages of mean Y0i for compliers across risk sets, with weights proportional to
8Since applicants to urban and non-urban charter schools are disjoint sets, the main effect for urban status is
the variance of the first-stage fitted values in the risk set (this is a consequence of Theorem 3 in Angrist and Imbens 1995).9
Our analysis of counterfactuals is limited to middle schools since the sample of non-urban high school charter students is too small to produce useful estimates ofγ1 andγ0. Columns (1) and (2) of Table 8 show 2SLS estimates of urban and non-urban charter effects using scores one year after application. Column (3), which reports τu−τn, shows that the difference in charter
effects by urban status is 0.37σ in ELA and 0.72σ in math. Columns (4) and (5) show that differences in non-charter fallback can account for the full urban charter advantage in math and most of the advantage in ELA. The estimates of γ0 imply that in public schools, non-urban compliers outscore urban compliers by 0.71σ in ELA and 0.63σ in math. In charter schools, non-urban compliers outscore urban compliers by only 0.33σ in ELA, and urban compliers score 0.09σ higher in math (though this estimate is not statistically significant).
Figure 1 presents a schematic representation of the results in Table 8. Urban charter middle schools serve populations with very low non-charter achievement, well below that of students in non-urban charters. The charter treatment pulls these students up to a level close to that of non-urban students (beyond these students in math, below them in ELA). Thus, it seems fair to see urban gains as recovery from a low base, though as we show next, this level is typical of all urban students in the state. By contrast, while non-urban charter students start out well ahead of their urban counterparts, the non-urban charter treatment pulls them back.
Non-treated Gaps in Urban and Non-urban Areas
Instead of comparing the no-treatment outcomes of urban compliers to the corresponding out-comes of non-urban compliers, we can benchmark achievement in each area using the local non-charter mean. This tells us whether the urban charter advantage is driven by unusually low no-treatment outcomes for compliers, or whether urban lottery compliers are, in fact, typical of their milieu. Figure 2 illustrates the alternative scenarios we have in mind: the left panel describes a situation in which the achievement of untreated urban students is comparable to ambient non-charter achievement, while the right panel describes a situation in which the urban fallback is unusually low.
The econometric analysis of within-area counterfactuals begins with a decomposition of urban
9
For example, the probability limit of the 2SLS estimate ofψin equation (6) is
ψ= X j∈N U Nj·π2j·V ar(Zi|dij=1) P kNk·π2k·V ar(Zi|dik=1) E[Y0i|D1i> D0i, dij= 1] whereN U is the set of non-urban lotteries andNjis the number of students in risk setj.
and non-urban LATE as follows: τl=El[Y1i|D1i > D0i]−El[Y0i|Di = 0] | {z } λl 1 (8) −(El[Y0i|D1i > D0i]−El[Y0i|Di = 0]) | {z } λl 0 , l∈ {u, n}.
The termλl0is the difference in averageY0ibetween lottery compliers and the general population
of non-charter students in the relevant area. The termλl1 is the difference between the treated outcomes of compliers and ambient non-charter achievement. In urban schools, for example, largeλu1 and smallλu0 mean that urban charters push their students beyond typical non-charter achievement in cities.
The decomposition in (8) is estimated using equations of the form Yi(1−Di) = ∆(1−Di) +
X
j
δjdij+i, (9)
estimated separately for urban and non-urban students, with the same first stage specification as equation (7). Here, the 2SLS estimand is a weighted average of Y0i for lottery compliers across
risk sets. To estimate E[Y0i|Di = 0, Ui = l], we omit risk set controls and estimate equation
(9) by OLS in a sample of students that includes both applicants and non-applicants. The OLS estimand is thus a simple average of Yi for non-charter students in location l. Assuming that
mean Y0i is constant across risk sets for compliers, λl0 is the difference between the 2SLS and OLS estimates of ∆. λl1 is estimated by replacing (1−Di) withDi in equation (9).10
Estimates of equation (9) for urban middle and high schools appear in Table 9. Columns (2)-(4) show results from regressions that include non-applicants. Specifically, column (2) reports the average Y0i for non-charter students, while column (3) shows λu0, the difference in average outcomes for compliers and non-charter students. Estimates of λu1, the difference between the treated outcomes of urban compliers and the ambient level of urban achievement, appear in column 4.11 The estimates of λu
0 suggest that urban lottery compliers are positively selected from the urban middle school population, but the estimated gaps are small, and marginally
10
Standard errors for the difference between the 2SLS and OLS estimates were constructed using a stacked data set that includes two copies of each observation. Let h ∈ {1,2} index halves of the data, and define Eihk= 1{h=k}fork∈ {1,2}. We estimate
Yih(1−Dih) = ∆2SLS·(1−Dih)·Eih1+ ∆OLS·(1−Dih)·Eih2+δ·Eih2+
X
j
δj·dij·Eih1+ih, instrumenting ((1−Dih)·Eih1) with (Zih·Eih1), and clustering standard errors byias well as school-grade-year.
11
Middle school scores are from the year after the lottery for applicants and 6th grade for non-applicants; high school scores are from 10th grade as always.
significant only for middle school ELA (λu0 for high school is virtually zero in both subjects). Because urban charter compliers have non-charter achievement levels that are fairly typical of students in urban areas, the large score gains generated by urban charter schools can be attributed to high scores in the treated state.
The last three columns of Table 9 compare the scores of urban compliers with a non-charter benchmark computed excluding students who do not apply to charter schools. The resulting estimates ofλu
0, reported in column (6), are even smaller than those in column (3). Thus, among applicants to charter schools, the non-charter achievement levels of compliers and non-attenders are virtually identical. Urban charter schools therefore push the scores of compliers well beyond the average non-charter achievement levels of all of their applicants.
Table 10 reports estimates of λn0 and λn1 for students at non-urban middle schools. As in urban areas, the non-charter achievement level of non-urban compliers is slightly higher than that of students in the surrounding public schools. The ELA scores of non-urban compliers in public schools exceed the ambient non-urban achievement level by a statistically significant 0.12σ, while the estimate ofλn1 for ELA is a precisely estimated−0.08σ. This implies that non-urban charter middle schools move their students from atypically high ELA achievement levels down to levels that are slightly below those of non-charter non-urban students. Non-charter math achievement of non-urban compliers is statistically indistinguishable from the ambient non-charter level, while non-urban charter attendance pulls compliers 0.19σ below the non-charter mean. As with urban applicants, the average level ofY0i for non-urban compliers is very
close to that of applicants who do not attend charter schools; both estimates of λn0 reported in column (6) are statistically insignificant and small. Since positive selection on Y0i is reduced
when non-applicants are excluded, the estimates ofλn1 in column 7 show sharper declines than the corresponding estimates including non-applicants in column 4.
Combined with the estimates ofγ0 andγ1 in Table 8, these results paint a consistent picture of the urban charter advantage. Urban middle school charters push the scores of their students from a typically low level up to a level much closer to the average level of achievement among non-urban charter students (the scenario sketched in the left panel of Figure 2). Non-urban charter middle schools reduce the scores of their students, in some cases markedly so. The non-urban high school sample is too small for precise comparisons of the outcomes of urban and non-urban compliers, but the results for urban charter high schools look broadly similar to those for middle schools: charter high schools raise the scores of urban students by pushing them beyond the level of high school achievement typical of urban areas.
Accounting for Student Demographics
We explore the role of student demographics in generating the urban charter advantage with the help of a decomposition in the spirit of Blinder (1973) and Oaxaca (1973). The first step uses the methods of Abadie (2003) to identify a linear local average response function for lottery compliers conditional on a vector of observable demographic variables,Xi. Specifically, we have
El[Yi|D1i > D0i, Di, Xi, dij] =Xi0θl+ωlDi+DiXi0ρl+
X
j
δjdij, l∈ {u, n}. (10)
This equation has a causal interpretation because conditional on being a complier, treatment (charter enrollment) is ignorable. Abadie (2003) shows that 2SLS using Bernoulli instruments for a Bernoulli treatment consistently estimates this sort of linear model for local average causal response.
Equation (10) generates the following parameterization of the urban/non-urban difference in charter school attendance effects:
τu−τn= (ωu−ωn) + ¯Xn0(ρu−ρn) + ( ¯Xu0 −X¯n0)ρu, (11)
where
¯
Xl≡El[Xi|D1i > D0i].
The last term in equation (11) captures the part of the urban charter advantage explained by differences in demographics. In particular, this term tells us how much smaller the effects of urban charter schools would be if they served the same mix of students as do non-urban schools. The first two terms capture the component of the urban advantage attributable to differences in effects within demographic groups.
Here, as always, Blinder-Oaxaca decompositions can be presented in two ways. In this case, the urban/non-urban difference in charter school effects can be decomposed with differences in means weighted by non-urban charter impacts instead of urban. Specifically, we can write
τu−τn= (ωu−ωn) + ¯Xu0(ρu−ρn) + ( ¯Xu0 −X¯n0)ρn. (12)
Like equation (11), this expression includes components associated with differences in demo-graphics and differences in effectiveness conditional on demodemo-graphics. The last term measures how much more effective non-urban charter schools would be if their students were demograph-ically similar to the urban charter population.
We construct these decompositions by estimating Yi =Xi0θl+ωlDi+DiXi0ρl+
X
j
by 2SLS, separately for urban and non-urban applicants, with first stage Di=Xi0µl+πlZi+ZiXi0ζl+
X
j
κjdij +ηi (13)
for Di and similar first stages for interaction terms involving Di. The covariate vector, Xi,
includes sex, race, special education status, limited English proficiency status, free lunch status, and dummies for performance at the advanced, proficient, or needs improvement level on baseline math and ELA tests.12 Complier means for each component ofXiare estimated using the
kappa-weighting procedure described in Abadie (2003).
Blinder-Oaxaca decompositions suggest that favorable demographics enhance urban charter effectiveness, but differences in student populations do not fully account for the urban charter advantage. This can be seen in Table 11, which reports the components of equations (11) and (12) for middle schools. (The non-urban high school samples are too small to admit meaningful investigations of effect heterogeneity using this approach.) Column (1) shows the difference in charter middle school treatment effects by urban status.13 Columns (2) and (3) report the com-ponents of decomposition (11), which multiplies the urban/non-urban difference in demographics by treatment effects for urban schools. Column (2) shows how urban effectiveness might change if urban schools were to serve the non-urban population. These results suggest that 63 percent of the urban advantage in ELA (0.25/0.40) can be explained by student demographics. The corresponding estimate for math is 49 percent. Urban schools are especially effective for poor and minority students, and they serve more of these students than do non-urban schools. On the other hand, column (3) shows that even with the same student mix as non-urban charter schools, urban charters would be more effective than non-urban charters, especially in math. The urban charter advantage can therefore be attributed to a combination of student demographics and larger treatment effects within demographic groups.
At the same time, columns (4) and (5), which report the results of estimating decomposition (12) using non-urban treatment effects to load covariate differences, show that the urban char-ter advantage would shrink little if non-urban schools served an urban demographic: student characteristics account for only 14 percent (0.06/0.40) and 37 percent (0.25/0.68) of the urban advantages in ELA and math, respectively. The results here are much less precise than those based on decomposition (11), reflecting the fact thatρnis estimated less precisely thanρu. Still,
this juxtaposition provides a useful summary of the underlying finding that non-urban charter schools are largely ineffective across subgroups.
12These score categories are used to determine whether schools in Massachusetts meet the Adequate Yearly
Progress (AYP) standard under No Child Left Behind (NCLB).
13These differences differ slightly from those reported in Table 8 because equation (13) imposes first stage
V
Differences in Schools
Our exploration of school-level heterogeneity in achievement effects is founded on observational estimates. Specifically, controlling for observable student characteristics, we estimate nonexper-imental treatment effects for every eligible charter school in the state (that is, for middle and high schools serving traditional students, open during the relevant time period, and meeting the entry grade restrictions described in Section II). This observational identification strategy is first validated by comparing observational and lottery-based estimates in the lottery sample. The validated observational analysis serves two purposes. First, an observational identifica-tion strategy allows us to compare effects for eligible charter schools with and without lottery records. If oversubscribed schools with usable lottery records differ systematically from other schools, then our lottery analysis may give an incomplete picture of charter effectiveness. Second, since the observational analysis includes schools and cohorts without available lottery informa-tion, we can use this approach to generate more precise school-specific estimates.
Observational Framework
Our observational estimates use a combination of matching and regression to control for observed differences between students attending different types of schools. Specifically, students attending lottery-eligible charters are matched to a control sample with the same baseline school, baseline year, sex, race, limited English proficiency status, special education status, and subsidized lunch status. Charter students are matched if they fall into a cell that includes at least one regular public school student; likewise, regular public school students are matched if they fall into in a cell that includes at least one student in an eligible charter school. Therefore, every charter student in the matched sample is compared to at least one demographically similar student from the same cohort and sending school. This procedure yields matches for 77 percent of students in eligible charter schools.
Within the matched sample, causal effects (denoted τo) are estimated using the following
model for studenti from cellc, observed in gradeg in year t: yigtc=αt+βg+ιc+b0iθ+S
0
igtsτo+igts (14)
Sigtc is a vector of years spent in schools of various types (eligible charter schools, ineligible
charter schools, alternative schools, and exam schools in urban and non-urban areas) for student ifrom baseline through yeart, andbiis a vector of studenti’s baseline scores on math, ELA, and
(in high school) Writing Topic and Writing Composition tests. Importantly, these models also include fixed effects for the cells constructed in the matching procedure (represented by ιc), so
students from the same sending schools and cohorts who later spend different amounts of time in charter schools. The middle school analysis looks at effects on test scores in grades 5 through 8, while the high school analysis looks at 10th grade scores. Standard errors are clustered as in the lottery analysis.
The comparison of observational and lottery-based estimates is encouraging. Table 12 re-ports estimates of a version of equation (14) that distinguish between eligible charter schools with and without usable lottery records. As shown in columns (1) and (2), observational esti-mates for schools in the urban lottery sample are strikingly similar to the lottery results. For example, the observational regressions suggest that a year in an urban lottery school increases middle school scores by 0.17σ and 0.28σ in ELA and math; the corresponding lottery-based estimates are 0.14σ and 0.34σ. The observational and lottery estimates for urban charter high schools are also close. These results suggest that the combination of matching and regression accounts for much of the selection into charter attendance in urban areas, an important find-ing in its own right. Interestfind-ingly, estimates for non-lottery urban schools are smaller than the corresponding estimates for lottery schools; for middle school, the estimates for non-lottery schools are negative and statistically significant. This is further evidence of the importance of school-level heterogeneity in charter attendance effects.
Among estimates of attendance effects at eligible non-urban charter schools, the match be-tween lottery estimates and observational results for schools with lottery records is not as good as for urban schools, though the two research designs generate qualitatively similar conclusions. For middle schools, estimated effects are negative using both lottery-based and observational techniques, but the observational estimates are considerably smaller. Observational estimates for high schools suggest small positive effects of non-urban charter attendance, while the lot-tery estimates are negative (though imprecise). Observational estimates for non-urban middle schools are reasonably similar across the lottery and non-lottery samples. Since both of the eli-gible non-urban high schools are part of the lottery sample, estimates for non-urban non-lottery high schools are not reported.
Explaining School-Specific Effects
Lottery and observational identification strategies generate broadly similar estimates in the sample of schools where they can be compared. This finding motivates an analysis of school-specific treatment effects estimated with observational techniques. The school-school-specific estimates come from a version of equation (14) that includes separate variables measuring years spent in each eligible charter school. These estimates are then linked to school policies and characteristics
using the following school-level regression: ˆ
τs=φ0+φ1Us+φ2Ls+φ3Hs+Ps0φ4+us, (15)
where ˆτs is an observational estimate of the effect of charter school s, Us is an urban dummy,
Ls is a lottery sample dummy,Hs is a high school dummy, and Ps is a vector of school policies
and characteristics measured in our survey. The estimates of this equation are weighted by the reciprocal of the standard error of the estimated treatment effect. Standard errors are clustered at the school level to account for the fact that some schools contribute both middle and high-school estimates to the sample.
Not surprisingly given our earlier findings, estimates of equation (14) show substantially larger treatment efffects at urban and lottery sample schools. These effects are reported in columns (1) and (5) of Table 13, which show estimates of equation (15) including only Us,
Ls, and Hs on the right-hand side. Eligible urban schools produce achievement gains that are
0.20σ and 0.12σ larger than the effects of non-urban schools in math and ELA; lottery-sample schools generate gains that are 0.15σ and 0.10σ larger than the effects of non-lottery schools. Columns (2) and (4) add instruction time (minutes per day and in the relevant subject) and per-pupil expenditures to the model. Increased time in the classroom is increasingly promoted as a means of increasing student achievement; in 2006, the Massachusetts state legislature approved a program to extend the school day by two hours in a small set of schools, motivated in part by the long days at successful charter schools (Pennington, 2007). The achievement effects of per-pupil expenditures are of longstanding interest to researchers and policy-makers; increasing per-pupil expenditures in regular public schools is often seen as an alternative to more structural reforms (Hanushek, 1997). School-environment variables can indeed account for a substantial fraction of the larger treatment effects produced by urban and lottery sample charter schools: urban and lottery coefficients fall substantially for both subjects, though the urban ELA and lottery math coefficients remain statistically significant. On the other hand, only the total time variable generates a marginally significant effect, while the expenditure coefficient is essentially zero.
Extended learning time is one of a number of features of the No Excuses approach. The estimates in columns (3) and (7) of Table 13 come from models that swap a dummy for schools that subscribe to No Excuses for the school environment variables used to construct the esti-mates reported in columns (2) and (6).14 No Excuses status fully accounts for the urban and lottery advantages in both math and ELA, without controlling for other features of the school environment. No Excuses charter schools generate math and ELA gains that are 0.31σ and
14
TheNo Excusesvariable used for this exercise is coded as one for schools described by survey respondents as
0.17σ larger than the effects of other charters. As shown in columns (4) and (8), the addition of school environment variables pulls the No Excuses effects down somewhat, but their inclusion does not change the basic story, and these variables do not themselves generate statistically significant effects conditional on No Excuses status.
Discipline
Comportment and discipline are often said to be defining features ofNo Excuses charter schools; if urban charter effectiveness is due to theNo Excuses approach, we might therefore expect to see a marked impact on disciplinary outcomes. Table 14 reports 2SLS estimates of equation (1) for suspensions and truancy in the year following applicant lotteries. The results for urban schools, reported in columns (1) through (3), are striking. Urban charter attendance is estimated to increase suspensions by 0.88 days in middle school and more than a full day in high school. These treatment effects exceed mean suspension rates in the lottery sample (0.62 days for middle school and 0.44 days for high school). The estimates for both middle and high school show significant increases in out-of-school suspensions, and smaller (though still substantial) increases in in-school suspensions. Though less precise, the results for truancy suggest that attendance at an urban charter high school reduces days of unauthorized absence – the truancy effect is statistically significant in models that include baseline test score controls. The truancy estimates for middle school are not significantly different from zero.
In contrast with the estimated effects of urban charter attendance on discipline, the estimates for non-urban charter schools show little effect. Non-urban estimates, reported in columns (4) through (6) of Table 14, are small, and none are significantly different from zero. These results sharpen the distinction between urban and non-urban charters. Attendance at urbanNo Excuses charter schools produces large effects on discipline as well as achievement; attendance at other charter schools has little effect in either domain.15
VI
Conclusions
Massachusetts’ urban charter schools generate large achievement gains, while non-urban char-ters appear to be largely ineffective and appear to reduce achievement for some. Candidate explanations for this constellation of findings include the fact that urban charter schools serve larger shares of minority students in districts where the surrounding achievement level is
gen-15
Observational estimates of effects on discipline closely match the lottery estimates for schools in the lottery sample. Observational estimates in the sample of all eligible schools suggest that urban non-lottery schools have much smaller effects on suspensions than do urban lottery schools, though discipline effects at non-lottery schools are also positive.
erally low, keep their students in school longer, spend more money per-pupil, and are much more likely to identify with the No Excuses instructional approach than are non-urban schools. Our analysis examines the contribution of these student- and school-level factors to the urban charter advantage.
Massachusetts’ urban charter schools, including the over-subscribed schools at the heart of our lottery analysis, serve a typical urban population with non-charter achievement below the average in non-urban areas. On average, urban charters push their students well beyond ambient non-charter achievement in central cities, while non-urban charter schools leave their students’ achievement essentially unchanged or diminished from a higher starting point. Urban charter schools are most effective for minorities, poor students, and low baseline achievers, so part of the urban charter advantage can be explained by student demographics. On the other hand, non-urban charter schools fail to boost achievement for any group.
Our analysis also reveals important heterogeneity within the set of urban schools. The over-subscribed schools with well-documented admissions processes that make up our lottery sample appear to be more effective than other urban charters. An analysis of school-specific treatment effects suggests that adherence to theNo Excuses paradigm can account for both the urban and lottery-sample charter advantages. Learning time and per-pupil expenditures are not strongly correlated with school-specific impacts and do not explain differences in effectiveness after accounting forNo Excuses status. Consistent with aNo Excuses explanation of the urban charter advantage, the large achievement gains generated by urban charter schools are mirrored by substantial effects on disciplinary outcomes in the urban sample.
The large negative estimates of non-urban charter impacts reported here raise the question of why, despite their unimpressive achievement effects, many of these schools are over-subscribed. One possibility is that parents misjudge the consequences of non-urban charter attendance. In a related setting involving school choice, Rothstein (2006) argues that parental choice is driven primarily by peer characteristics rather than school effectiveness. Of course, it’s also possible that non-urban charter schools generate gains that non-urban families value more than the skills measured by the MCAS, especially in view of the fact that most non-urban students do reasonably well in any case. Still, it seems unlikely that non-urban parents would see a deterioration in basic skills as desirable. In ongoing work, we’re looking at a variety of post-secondary outcomes in an effort to determine whether the heterogeneous findings for achievement reported here have longer-term consequences. We also hope to investigate the effectiveness of No Excuses education for non-urban students by drawing new samples of students and schools from other states.
ELA:
Math:
Figure 1: Gaps in Treatment and No-Treatment Counterfactuals, Urban vs. Non
u 1 n (non-urban treatment) u (urban treatment) o u (urban treatment) o n (non-urban treatment) 1
Figure 2:
Treatment Effects
in Urban Areas
Treatment effect Treatment effect High Y1 Low Y0All charters
Middle (entry in 4-7) and high (entry in 9)
school charters* Charters eligible for lottery study Charters included in lottery study
School level Urban status Boston status (1) (2) (3) (4)
Middle
Urban 35 21 16 9
Boston 13 10 8 7
Non-Boston 22 11 8 2
Nonurban 19 12 11 7
Total (Urban and Nonurban) 54 33 27 16
High
Urban 25 10 6 4
Boston 10 7 5 4
Non-Boston 15 3 1 0
Nonurban 12 3 2 2
Total (Urban and Nonurban) 37 13 8 6
**Here we also exclude one school that opened in 2009, but has a 4th grade entry so did not reach our observational outcome grades (5-8) by Fall 2009.
* There is an exception to the 9th grade entry criteria for high school. Two schools with lotteries at the middle school entry point which also enroll students in the high school grades are included in the lottery analysis of 10th grade outcomes.
Table 1: School Participation
Notes: This table reports the number of middle and high charter schools in Massachusetts and their participation in the observational and lottery studies. The numbered notes below describe the schools included in each column. Columns (2)-(4) exclude middle schools that have their main admissions lottery in elementary school (e.g., K-8 schools) and high schools that hold their main admissions lotteries in elementary or middle school (e.g.,K-12 or 6-12 schools). MATCH Charter Public School, Boston Collegiate Charter School, and Four Rivers Charter Public School are counted twice: once as a middle school and once as a high school (lotteries from each level participate in the lottery study). Edward Brooke Charter School is counted as a middle school (it became K-8 in 2006, only lotteries from the middle grades participate in the lottery study). "Urban" towns are defined by the Massachusetts Department of Elementary and Secondary Education as the towns where the district superintendents participate in the Massachusetts Urban Superintendents Network. These towns include: Boston, Brockton, Cambridge, Chelsea, Chicopee, Everett, Fall River, Fitchburg, Framingham, Haverhill, Holyoke, Lawrence, Leominster, Lowell, Lynn, Malden, New Bedford, Pittsfield, Quincy, Revere, Somerville, Springfield, Taunton, and Worcester.
1. Middle and high charter schools in Massachusetts, including schools opened in 2010 (which is too recent to have MCAS outcomes), alternative charter schools, 2. Middle and high charter schools in Massachusetts with the designated entry grades (in 4-7 and 9)*, including schools opened in 2010, alternative schools, and 3. Middle and high charter schools in Massachusetts with the designated entry grades (in 4-7 and 9)*, excluding closed schools, alternative schools, and schools 4. Middle and high charter schools that are included in column (3), excluding schools that are undersubscribed or have insufficient lottery records.
Statewide Urban Non-urban
Characteristic (1) (2) (3)
Years open 9.43 8.18 11.36
Days per year 186.18 188.53 182.55
Average minutes per day 447.86 464.35 422.36
Have Saturday school 0.321 0.471 0.091
Avg. math instruction (min) 80.93 94.56 59.86
Avg. reading instruction (min) 84.00 99.62 59.86
CMO or Network Affiliation 0.357 0.294 0.455
Fully or somewhat "No excuses" 0.429 0.706 0.000
Parent contract 0.679 0.824 0.455
Student contract 0.643 0.706 0.545
Uniforms 0.821 0.882 0.727
Reward and punishment system 0.464 0.647 0.182
Avg. per-pupil expenditure 12824.19 14095.53 11090.55
Title I eligible 0.857 1.000 0.636
Number of teachers 25.736 22.735 30.373
Student/teacher ratio 11.614 11.565 11.691
Licensed teachers 51.146 51.853 50.055
Proportion 32 and younger 0.577 0.709 0.384
Proportion 49 and older 0.129 0.058 0.233
Left voluntarily 2.278 1.969 2.727
Left involuntarily 1.296 1.500 1.000
Require staff to take calls after hours 0.071 0.059 0.091
Unpaid tutors/volunteers 0.786 0.706 0.909
Paid tutors 0.143 0.235 0.000
N (schools) 28 17 11
Table 2: Characteristics of Charter Schools
Notes: This table reports results from a survey of Massachusetts charter schools with entry in middle (4th-7th) or high school (9th) grades. The survey sample excludes schools closed prior to 2010, schools that were not open before Fall 2010, and schools serving non-traditional student populations. Twenty-eight of 32 eligible schools responded to the survey.
Urban Non-urban Urban Non-urban Urban Non-urban (1) (2) (3) (4) (5) (6) Female 0.486 0.488 0.498 0.476 0.496 0.510 Black 0.185 0.027 0.407 0.036 0.479 0.022 Hispanic 0.314 0.036 0.237 0.048 0.234 0.025 Special education 0.190 0.163 0.166 0.160 0.176 0.184 Subsidized lunch 0.681 0.141 0.650 0.216 0.686 0.102
Limited English proficiency 0.150 0.016 0.077 0.025 0.086 0.008
Baseline Math score -0.430 0.213 -0.339 0.239 -0.352 0.306
Baseline ELA score -0.464 0.234 -0.330 0.261 -0.373 0.392
Years in charter 0.000 0.000 2.027 1.960 1.341 1.002 N (students) 153374 369866 6625 8316 4126 1693 N (schools) 262 390 16 11 9 7 Female 0.500 0.494 0.555 0.549 0.549 0.539 Black 0.190 0.028 0.535 0.020 0.615 0.029 Hispanic 0.272 0.032 0.176 0.010 0.256 0.017 Special education 0.169 0.155 0.160 0.105 0.174 0.115 Subsidized lunch 0.606 0.122 0.600 0.146 0.716 0.120
Limited English proficiency 0.093 0.009 0.022 0.005 0.035 0.003
Baseline Math score -0.420 0.271 -0.413 0.322 -0.315 0.445
Baseline ELA score -0.387 0.282 -0.325 0.413 -0.306 0.562
Years in charter 0.000 0.000 1.765 1.797 0.627 1.292
N (students) 116593 313366 2198 783 2973 349
N (schools) 101 304 8 2 4 2
Notes: This table reports descriptive statistics for the sample of public school students (columns 1 and 2), the sample of students in eligible charter schools (columns 3 and 4), and the sample of charter applicants (columns 5 and 6) from 2002-2010. The sample is restricted to students in Massachusetts public schools at baseline with at least one followup test score. The number of schools in columns (1) and (2) is counted in 6th grade for middle school and 10th grade for high school. Years in charter school is measured through 8th grade for middle school and 10th grade for high school.
Table 3: Descriptive Statistics
Regular Public Schools Charter schools (eligible) Charter applicants (lottery)
Panel B. High Schools (10th grade) Panel A. Middle Schools (5th-8th grade)
First Stage Reduced Form Just identified Overidentified
School level Subject (1) (2) (3) (4)
Middle ELA 0.987*** 0.065** 0.066** 0.062** (0.043) (0.029) (0.029) (0.028) N 12126 Math 0.984*** 0.211*** 0.214*** 0.175*** (0.043) (0.034) (0.033) (0.031) N 12346 High ELA 0.509*** 0.113** 0.221*** 0.190** (0.101) (0.050) (0.076) (0.074) N 3303 Math 0.510*** 0.164** 0.322*** 0.269*** (0.101) (0.064) (0.090) (0.093) N 3255 Writing Topic 0.514*** 0.156*** 0.303*** 0.290*** (0.101) (0.057) (0.087) (0.080) N 3268 Writing Composition 0.514*** 0.140** 0.271*** 0.227*** (0.101) (0.058) (0.092) (0.085) N 3268
*significant at 10%; **significant at 5%; ***significant at 1%
Table 4: Lottery Results for Massachusetts Charter Schools
Notes: This table reports estimates of the effects of years in charter schools on test scores. The sample is restricted to students with baseline demographic characteristics who attended a Massachusetts public school when tested, and excludes students with sibling priority and late applicants. Columns (1)-(3) are produced by a 2SLS procedure using a lottery offer dummy as an instrument for years spent in charter schools. Column (4) uses risk set and offer interactions as instruments. All models control for race, sex, special education, limited English proficiency, subsidized lunch status, and a female by minority dummy. Year of birth, year of test, and risk set dummies are also included. Middle school regressions pool post-lottery outcomes from 4th through 8th grade and cluster by student identifier as well as school-grade-year. High school regressions include only scores for 10th grade and cluster by school-grade-year.
First Stage Reduced Form 2SLS First Stage Reduced Form 2SLS
School level Subject (1) (2) (3) (4) (5) (6)
Middle ELA 1.001*** 0.141*** 0.140*** 0.978*** -0.155*** -0.156*** (0.055) (0.035) (0.033) (0.081) (0.045) (0.045) N 8762 3364 Math 0.990*** 0.333*** 0.336*** 0.996*** -0.159*** -0.155*** (0.054) (0.038) (0.036) (0.081) (0.050) (0.051) N 9015 3331 High ELA 0.494*** 0.117** 0.236*** 1.082*** -0.014 -0.009 (0.105) (0.051) (0.079) (0.153) (0.116) (0.105) N 2954 349 Math 0.495*** 0.178*** 0.359*** 1.088*** -0.274* -0.246* (0.105) (0.066) (0.092) (0.158) (0.162) (0.148) N 2910 345 Writing Topic 0.500*** 0.166*** 0.332*** 1.082*** -0.157 -0.139 (0.105) (0.058) (0.090) (0.153) (0.222) (0.204) N 2920 348 Writing Composition 0.500*** 0.149** 0.298*** 1.082*** -0.155 -0.137 (0.105) (0.060) (0.096) (0.153) (0.213) (0.196) N 2920 348
*significant at 10%; **significant at 5%; ***significant at 1%
Table 5: Lottery Results for Urban and Non-urban Charter Schools
Notes: This table reports estimates of the effects of years in urban and non-urban charter schools on test scores. The sample is restricted to students with baseline demographic characteristics who attended a Massachusetts public school when tested, and excludes students with sibling priority and late applicants. Estimates are produced by a 2SLS procedure using urban and non-urban lottery offers as instruments for attendance at urban and non-urban charter schools. All models control for race, sex, special education, limited English proficiency, subsidized lunch status, and a female by minority dummy. Year of birth, year of test, and risk set dummies are also included. Middle school regressions pool post-lottery outcomes from 4th through 8th grade and cluster by student identifier as well as grade-year. High school regressions include only scores for 10th grade, and cluster by school-grade-year.
Non-urban Urban