HORTSCIENCE52(6):896–904. 2017. doi: 10.21273/HORTSCI11354-16
Growing Food with Garbage: Effects
of Six Waste Amendments on Soil
and Vegetable Crops
Rebecca J. Long and Rebecca N. Brown
1Department of Plant Sciences and Entomology, University of Rhode Island,
Kingston, RI 02881
Jos
e A. Amador
Department of Natural Resource Science, University of Rhode Island,
Kingston, RI 02881
Additional index words.paper fiber, food waste, compost, biosolids, gelatin, potatoes, sweet corn, butternut squash
Abstract. Using organic wastes as agricultural amendments is a productive alternative to disposal in landfills, providing nutrients for plant growth and carbon to build soil organic matter. Despite these benefits, a large fraction of organic waste is sent to landfills. Obstacles to the adoption of wastes as sources of plant nutrients include questions about harmful effects to crops or soils and the wastes’ ability to produce satisfactory yields. We compared six organic waste amendments with a mineral fertilizer control (CN) to determine effects on soil quality, soil fertility, crop quality, and crop yield in 2013 and 2014. Waste amendments were applied at a rate sufficient to supply 10,000 kg organic C/ha over two seasons, and mineral fertilizer was applied to control plots to provide 112 kg-N/ha/yr. The experiment was laid out in a randomized block design with four replicates and three crops: sweet corn (Zea mays L. cv. Applause, Brocade, and Montauk), butternut squash (Cucurbita moschataDuchesne cv. JWS 6823), and potatoes (Solanum tuberosumL. cv. Eva). Amendment with biosolids/yard waste cocompost (BS), dehydrated restaurant food waste (FW), gelatin manufacturing waste (GW), multisource compost (MS), paper fiber/chicken manure blend (PF), and yard waste compost (YW) did not have a negative impact on soil moisture, bulk density, electrical conductivity (EC), or the concentration of heavy metals in soil or plant tissue. Our results indicate potential uses for waste amendments including significantly raising soil pH (MS) and increasing soil organic matter [OM (YW and BS)]. The carbon-to-nitrogen ratio (C:N) of waste amendments was not a reliable predictor of soil inorganic N levels, and only some wastes increased potentially mineralizable nitrogen (PMN) levels relative to the control. Plots amended with BS, FW, and GW produced yields of sweet corn, butternut squash, and potatoes comparable with the control, whereas plots amended with YW, PF, and MS produced lower yields of sweet corn, squash, or both, although yields for potatoes were comparable with the control. In addition, the marketability of potatoes from PF plots was significantly better than that of the control in 2014. None of the wastes evaluated in this study had negative impacts on soil properties, some provided benefits to soil quality, and all produced comparable yields for at least one crop. Our results suggest that all six wastes have potential to be used as sources of plant nutrients.
Conventional farming relies heavily on mineral fertilizers for plant nutrients neces-sary for intensive production. Although the release of nutrients from mineral fertilizers is predictable, reliable, and can be balanced to meet crops’ needs, synthetic sources of
nitrogen (fixed by the Haber–Bosch process) are energy intensive to produce, prohibited by agencies that certify organic practices, and do not provide a source of carbon to build soil OM (Crews and Peoples, 2004). The use of composts and manures as sources of nutrients for agriculture predates the use of syntheti-cally fixed nitrogen, and more recently, novel types of organic wastes, from industrial and municipal sources, are being considered for their potential as fertilizer replacements (Parr and Hornick, 1992).
Organic wastes provide both plant nutri-ents and carbon to build soil OM, and many are locally available, reducing the expense and environmental impacts of transportation. Land application would prevent the need to landfill or incinerate wastes, recycle nutrients that would otherwise be lost, and potentially sequester carbon in the soil. Finally, unlike
synthetic sources of nitrogen, these wastes have the potential to be approved for use in USDA-certified organic agriculture (U.S. Department of Agriculture, 2015).
Many organic waste streams are underused despite the advantages of their use in agricul-ture. A total of 34.2 million tons of yard waste (leaves and grass) and 37.1 million tons of food scraps were generated in the United States in 2013, of which only 20.6 and 1.8 million tons, respectively, were recovered for ben-eficial use (U.S. Environmental Protection Agency, 2015). With many states moving away from landfilling and incinerating yard waste and moving toward aerobic compost-ing, the amount of yard waste compost available for land application is likely to increase (Arsova et al., 2008).
For farmers to effectively and sustainably incorporate organic wastes as sources of plant nutrients they need to know not only if the wastes are safe but also whether wastes can produce equivalent yields to mineral fertilizers and the application rates necessary to achieve these yields. Although there is a great deal of information on the safety and effects on soil fertility of some organic wastes, such as biosolids, more novel prod-ucts, such as gelatin, paper, and dehydrated food waste, remain relatively unstudied (Elliot et al., 2005; Gilmour et al., 2003; Sidhu and Toze, 2009).
The results of previous studies of waste amendment application for crop production have shown variable effects on soil proper-ties, fertility, and crop yield. Although stud-ies of amendment with paper mill sludge have shown no significant increases in soil concentrations of heavy metals, a review of municipal solid waste (MSW) compost found that it increased soil heavy metals and EC and, in some cases, inhibited plant growth (Aitken et al., 1998; Douglas et al., 2003; Hargreaves et al., 2008). Soil amendment with paper mill sludge as well as repeated application of MSW compost and biosolids or BS have been shown to increase soil C and OM levels and lower bulk density (Douglas et al., 2003; Foley and Cooperband, 2002; Gagnon et al., 2001; Hargreaves et al., 2008; Ozores-Hampton et al., 2011; Zibilske et al., 2000).
Although some studies showed that the application of MSW compost increased soil N levels, others found it to be a less effec-tive source of plant-available N than mineral fertilizers (Hargreaves et al., 2008). Chellemi and Rosskopf (2004) reported that incorpo-ration of yard waste lowered soil nitrate-N, whereas Casado-Vela et al. (2007) found increasing soil levels of total Kjeldahl nitro-gen and nitrate with increasing application rates of composted sewage sludge. Applica-tion of paper sludge has been associated with N immobilization in the soil (Aitken et al., 1998; Simard et al., 1998).
Reported waste amendment effects on vegetable yield and quality are variable. Maynard and Hill (2000) reported increased yield and decreased incidence of soft rot disease for onions (Allium cepa L.) grown
Received for publication 12 Sept. 2016. Accepted for publication 14 Mar. 2017.
This article is a portion of the Masters of Science thesis of the first author. We thank the students and staff of the University of Rhode Island Gardiner Crop Science farm and the Soil Ecology and Microbiology lab for all their assistance. Funding was provided by project HI-675 of the Rhode Island Agricultural Experiment Station and a Uni-versity of Rhode Island Enhancement of Graduate Research Award.
1Corresponding author. E-mail: Brownreb@URI.
with leaf compost. Ozores-Hampton and Peach (2002), in a review of studies of biosolids and biosolid cocomposts, found that whereas bio-solids alone often increased vegetable yields, combining biosolids and mineral fertilizers was generally more effective than biosolids alone. Several studies of commercial cereal crops have reported negative or neutral yield re-sponses to application of paper sludge (Aitken et al., 1998; Douglas et al., 2003; Simard et al., 1998). Although Foley and Cooperband (2002) reported no effect on potato yields after paper mill sludge application, yields of potatoes, sweet corn, and squash (Cucurbita maxima L.) were lower in soil treated with MSW compost compared with fertilizer-treated soils (Hargreaves et al., 2008).
The main goal of this study was to address some of the gaps in knowledge regarding the use of organic waste amendments to grow vegetables. Six types of waste amendments— BS, FW, MS, GW, PF, and YW—were applied to provide a consistent rate of C, and effects on soil properties and crop yield were compared with a mineral fertilizer control.
Materials and Methods
Site description.The study was conducted from 2013 to 2014 at the University of Rhode Island’s Greene H. Gardiner Crop Science Field Laboratory in Kingston, RI. The exper-iment site has a mixture of Bridgehampton silt loam and Enfield silt loam, 0% to 3% slope, a mean annual precipitation of 114– 127 cm, and a mean annual air temperature of 10C (Soil Survey Staff, 2013). There were 2548 growing degree days in 2013 and 2605 in 2014 (1 May–1 Oct.; base 10C) (Weather Channel, 2014). Before our study, the field was used for vegetable production and then planted with trees (Acer rubrumL., Lirioden-dron tulipifera L., Quercus alba L., Q. montanaWilld.,Q. phellosL., andQ. rubra L.) intersown with creeping red fescue (Fes-tuca rubra L.) from 2006 until the fall of 2012, when the trees were pulled out and the field planted to a cover crop of winter rye (Secale cereale L.) and hairy vetch (Vicia villosaRoth) until the experiment began in Apr. 2013. A cover crop of winter rye and hairy vetch was also planted between the first and second season of the experiment.
The experiment was laid out with 28 plots, measuring 4.6 m · 13.8 m, arranged in a randomized block design with four repli-cates of the seven treatments (six wastes and mineral fertilizer control). Plots were divided into three subplots, measuring 4.6 m·4.6 m, for the three crops. All samples, measure-ments, and yield data were taken from the 3 m·3 m center of each subplot. Crops were seeded by hand the last 2 weeks of May 2013 and between the last week of May and the second week of June 2014. All crops were planted in six rows per subplot, 76 cm between rows. Sweet corn (cv. Applause and Brocade in 2013; Applause and Montauk in 2014) and potatoes (cv. Eva) were planted at 30 cm in-row spacing, and butternut squash (cv. JWS 6823) was planted at 61 cm. Sweet
corn cultivars were planted in alternating rows. Brocade was not used in 2014 because of difficulty locating seed.
Management followed typical practices for local production and extension recom-mendations. Crops were irrigated with an overhead sprinkler when rainfall was insuffi-cient, and weeds were managed by tractor cultivation and by hand. Potatoes were hilled several times and mowed once senescence began. Corn ear worm (Helicoverpa zea Boddie) was managed with foliar sprays of Dipel (Bacillus thuringiensis Berliner) (Valant BioSciences Co., Libertyville, IL) in 2013 and 2014. Ears were also treated directly with injections of Bt in 2013, but this method was not used in 2014 because it was only minimally effective and caused a higher incidence of unfilled ear tips. Pyganic (MGK Co., Minneapolis, MN), a pyrethrin spray, was used for control of cucumber beetles (Acalymma vittatumF.) on squash and Col-orado potato beetles (Leptinotarsa decemli-neata Say) on potatoes in both 2013 and 2014. In addition, a spinosad spray, Entrust (Dow AgroSciences, Indianapolis, IN), was used for Colorado potato beetles in 2014. Although most practices adhered to the stan-dards of Rhode Island’s Organic certification, it was necessary to use Sevin (Tessenderlo Kerley, Inc., Phoenix, AZ), a carbaryl insec-ticide not approved for organic production, in 2014 to control cucumber beetles on squash.
Waste amendments. Six organic waste amendment treatments were compared with a mineral fertilizer control (CN):
1) Biosolids/yard waste cocompost (BS) 2) Dehydrated restaurant food waste (FW) 3) Gelatin manufacturing waste (GW) 4) Multisource compost (MS)
5) Paper fiber/chicken manure blend (7:1) (PF)
6) Yard waste compost (YW)
Waste amendments were delivered to the farm or picked up in the spring of 2013 and 2014. The BS, from Rhode Island, was pro-duced by in-vessel horizontal agitated bin composting of ground leaves, brush, and
municipal biosolids, and meets U.S. EPA Class A, Exceptional Quality compost stan-dards (U.S. Environmental Protection Agency, 1994). The YW and MS were both produced in Rhode Island using active windrows of grass clippings, leaves, and brush. In addition, the MS contained wood chips, farm and zoo animal manure and bedding, fish scraps, sea-shells, seaweed, coffee grounds, wood ash, and food scraps. The FW was from a New York restaurant and was ground, dehydrated, and aerobically incubated for 18 h to reduce bulk. The gelatin waste was from a Massachusetts facility and consisted of a ‘‘filter cake’’ pro-duced during the manufacture of gelatin. Finally, the paper fiber, provided by a resource management company in New Hampshire, was dewatered primary sludge from a mill that processes recycled paper. Owing to its high C:N ratio (>57:1), the paper fiber was blended with a composted chicken manure fertilizer (C:N = 8:1) at a rate of 7 parts paper to 1 part chicken manure.
Amendments were stored in piles under tarps until application by hand in late Apr. 2013 and late May 2014 and incorporated15 cm deep by disc harrow. Amendments were ap-plied as delivered except for the gelatin waste, which required breaking up the large filter cakes by hand before application.
Waste amendments were applied at a rate sufficient to supply 10,000 kg organic C/ha over two seasons (Table 1). Waste application rates were chosen to supply a consistent amount of C, the primary component of soil OM, over the course of the study to compare effects on soil OM. This rate ensured all amendments would supply nutrients at greater than the recom-mended rate required by the crops; for sweet corn, winter squash, and potatoes, require-ments range from 112 to 135 kg-N/ha, 15 to 20 kg-P/ha, and 28 to 93 kg-K/ha, respectively (Hazzard and Howell, 2014). The exception was plots amended with GW which, because of the low amount of K compared with N and P, received only 8 kg-K/ha in 2013. Gelatin waste was not reapplied in 2014 because the target rate of C was reached with a single application. All other wastes were applied both years.
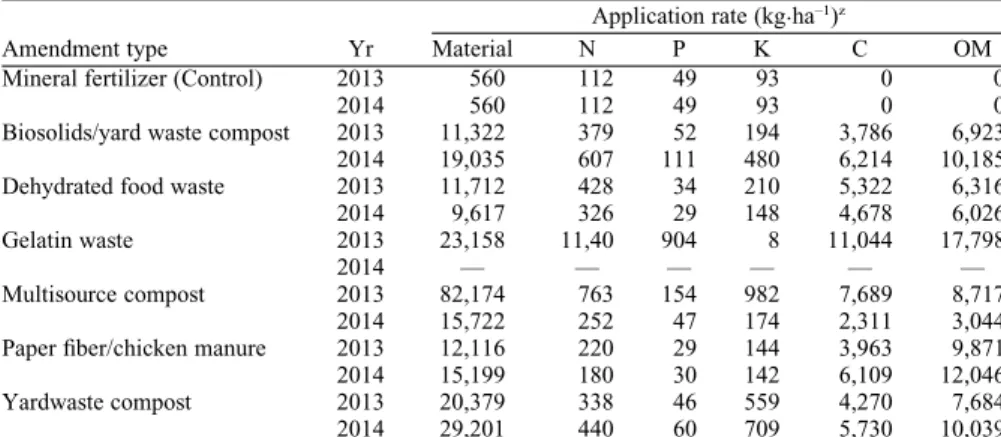
Table 1. Application rate of amendments and of total N, P, K, C, and organic matter (OM). Values are based on dry weight. Gelatin waste was not applied in 2014.
Amendment type Yr
Application rate (kg·ha–1)z
Material N P K C OM
Mineral fertilizer (Control) 2013 560 112 49 93 0 0
2014 560 112 49 93 0 0
Biosolids/yard waste compost 2013 11,322 379 52 194 3,786 6,923
2014 19,035 607 111 480 6,214 10,185
Dehydrated food waste 2013 11,712 428 34 210 5,322 6,316
2014 9,617 326 29 148 4,678 6,026
Gelatin waste 2013 23,158 11,40 904 8 11,044 17,798
2014 — — — — — —
Multisource compost 2013 82,174 763 154 982 7,689 8,717
2014 15,722 252 47 174 2,311 3,044
Paper fiber/chicken manure 2013 12,116 220 29 144 3,963 9,871
2014 15,199 180 30 142 6,109 12,046
Yardwaste compost 2013 20,379 338 46 559 4,270 7,684
2014 29,201 440 60 709 5,730 10,039
zRecommended application rates for sweet corn, winter squash, and potatoes range from 112 to 135 kg-N/ha, 15 to 20 kg-P/ha, and 28–93 kg-K/ha, respectively (Hazzard and Howell, 2014).
Mineral fertilizer (20N–8.7P–16.6K) was applied to control plots to provide 112 kg-N/ha, 49 kg-P/ha, and 93 kg-K/ha, per year (Table 1). The fertilizer was 3.5% ammonium-N, 5.5% nitrate-N, and 11% urea-N. Although the N application rate from mineral fertilizer in control plots, 112 kg·ha–1, was at the low end
of the recommended rate, additional N was expected to become available from winter cover crop containing vetch as well as soil OM, which provides 22 to 45 kg·ha–1of N for
every 1% OM in the surface 15 to 18 cm of soil (Hazzard and Howell, 2014). Based on the lowest soil OM levels during the study (3.5% on 18 May 2013), soil OM was expected to provide at least an additional 77–158 kg·ha–1of
N/yr. Therefore, no additional N was applied as sidedressing because soil OM and cover crop residue were anticipated to provide a slowly released source of N. Application rates of P and K were at or above recommendations.
Sampling. After delivery in 2013 and 2014, three subsamples of each amendment were combined and analyzed for physical and chemical properties. Wastes were applied in late Apr. 2013, and soil samples were col-lected on 18 May, 24 June, 14 Aug., and 30 Sept.; in 2014, wastes were reapplied in late May, and soil samples were collected on 14 May (before amendment application), 2 June, 30 June, 4 Aug., 29 Aug., and 6 Oct. One composite sample—made up of a mini-mum of five subsamples taken to a depth of 20 cm, using a 2-cm diameter core—was analyzed per subplot.
Soil and plant analysis.Amendment and soil EC and pH were measured with a Denver Instrument Ultrabasic UB-10 pH meter (Den-ver Instrument, Bohemia, NY) and a Fisher Scientific Model 06-662-61 Conductivity Me-ter (Thermo Fisher Scientific Inc., Waltham, MA). A 1:6 amendment-to-water ratio and 1:2 soil-to-water ratio were used to measure EC and pH, with the exception of the fertilizer EC, which was measured using a 1:36 fertilizer-to-water ratio because of high salt content (Gartley, 2011; Hendershot et al., 1993). Amendment and fertilizer EC results were multiplied by three and 18, respectively, to be comparable with soil EC values.
The total heavy-metal concentration of amendments, soil, and sweet corn was mea-sured by X-ray fluorescence with a Niton XL3r600 XRF Analyzer (Thermo Fisher Scientific Inc.). Before analysis, samples were dried at 105C for 24 h, ground, and passed through a 0.25-mm mesh sieve. In 2014, the heavy-metal level in sweet corn ears was determined for a composite of five ‘Montauk’ ears (including husk and cob) per plot.
The total C and N contents of amend-ments were measured by solid phase analysis with a Carlo Erba NC2100 Elemental Ana-lyzer (2013) and an EA1108 CHN AnaAna-lyzer (2014) (CE Instruments, Inc., Wigan, Ire-land). Total P was measured by the dry ash method and HCl digestion with a Thermo Scientific iCAP 6000 ICP-OES (Thermo Fisher Scientific Inc.) by the Maine Soil Testing Service (University of Maine, Orono
ME) (Chapman and Pratt, 1961; Kalra and Maynard, 1991). Total K was measured by X-ray fluorescence.
To determine how seashells affected the C content of amendments, samples of FW and MS (2014) were treated with 6N HCl, dried at 105C for 24 h, ground, and analyzed for total C by solid phase analysis as described previously. The total C content of the acid-treated samples was subtracted from the C content of the untreated samples to determine the amount of C lost as CO2 from the dissolution of CaCO3.
To determine soil bulk density, one sam-ple per sweet corn plot, taken with a 5·10 cm corer, was collected after the first growing season (Apr. 2014) and dried at 105 C for 24 h (Culley, 1993). Bulk density was sampled after the first growing season only.
Soil gravimetric water content was deter-mined by drying samples at 105C for 24 h (Topp, 1993). Soil OM content was measured by loss-on-ignition at 550C for 5 h (Gugino et al., 2009). To compensate for an existing gradient of OM at the experiment site, data points from additional plots that had not re-ceived waste amendments (sampled 14 May 2014) were used to estimate the slope of the OM gradient. This value was used to calculate the background level of OM for each plot, based on distance from the west edge of the field, which was subtracted from the recorded data to eliminate the variation due to field position. The resulting value represented the change in soil OM during the study because of the application of treatments.
The levels of ammonium (NH4) and ni-trate (NO3) in amendment samples were de-termined after extraction using a 1:10 ratio (wt:vol) of amendment-to-extractant (1 N KCl) using inductively-coupled plasma spec-trometry (Gugino et al., 2009). For soil samples, NH4and NO3were extracted from fresh-sieved soil using a 1:5 ratio (wt:vol) of soil to 2.0M KCl and analyzed colorimetrically (Doane and Horwath, 2003; Weatherburn, 1967) using a BioTek PowerWave 340 Micro-plate Spectrophotometer (BioTek Instruments Inc., Winooski, VT). To determine PMN, soil samples were incubated anaerobically at 30C for 7 d, and the difference in NH4 concentra-tion between day 7 and 0 was determined (Gugino et al., 2009).
Leaf tissue samples were dried, ground, and analyzed for N, P, K, Ca, Mg, Al, B, Cu, Fe, Mn, Mo, Na, Pb, and Zn by the dry ash method and HCl extraction with a Spectro Ciros-OES ICP (SPECTRO Analytical In-struments, Kleve, Germany) by the Soil Nutrient Analysis Laboratory (University of Connecticut, Storrs, CT) (Miller, 1998). Sweet corn tissue samples were collected from the Applause cultivar only. The most recent mature leaf was sampled for potato and squash, and sweet corn samples were taken from the fifth leaf down (per University of Connecticut instructions).
Crop yield.Data on emergence, collected in 2014, were calculated based on the frac-tion of seeds that emerged per plot for sweet corn, squash, and potatoes. Early growth was
assessed by measuring average plant height (from soil level) for both potatoes and sweet corn in 2013 and 2014. Squash height was not measured because of its horizontal growth habit.
After harvest, potatoes were sorted into three categories of quality: firsts (market-able), seconds (potentially usable for second-ary market-like processing), and culls based on the level of mechanical damage, disease, or insect damage. The percentage of total yield in each category of quality was calcu-lated. The total yield of potatoes (all three categories combined) and butternut squash (marketable plus culls) was calculated on a per hectare basis. Marketable sweet corn was harvested by hand as it ripened, and ears were weighted and counted. Because of varying plant density between cultivars, sweet corn yields were calculated as the weight of ears harvested per plant and con-verted to kg·ha–1based on a plant density of
47,361 plants/ha.
Statistical analyses.SASÒV. 9.2 (Statis-tical Analysis System Inst., Cary, NC) was used to perform one-way analysis of variance for treatment effects for each crop and date sampled. For tests that passed the F-test for significance, Fisher’s least significant differ-ence test was used to perform pairwise comparisons of means to identify which treatments varied significantly. Significance was evaluated atP< 0.05. Crops and sam-pling dates were analyzed separately.
Results and Discussion
Waste amendment qualities. Although waste amendment qualities varied between wastes and year-to-year for the same waste, they were generally favorable for land appli-cation. All waste EC values were around or below 10 dS·m–1, substantially lower than
the CN (345 dS·m–1), and were fairly
consis-tent between years (Table 2). However, all wastes, with the exception of YW in 2014, exceeded the recommended level of 3 dS·m–1
(Soumare et al., 2003). Waste amendment pH ranged from 4.9 (GW in 2013) to 7.9 (BS in 2014) and varied among amendments, as well as year-to-year for the same amendment (Table 2).
Both FW and MS contained seashells, which accounted for 15.5% and 47.4% of total C, respectively. Because C from CaCO3, an inorganic C compound, is unavailable to microorganisms, MS is expected to contrib-ute almost 50% less C to microbial processes than the total C values indicated. Without shells, the C:N ratio of MS decreases from 9:1 to 5:1, which could result in higher inorganic N availability than expected. These results highlight the importance of distin-guishing between organic and inorganic sour-ces of C when interpreting amendment test results.
Waste amendments were tested for their heavy metal content, including Mo, Pb, Se, As, Hg, Zn, Cu, Ni, Cr, and Cd. None of the amendments exceeded the ceiling limits for heavy metal concentrations outlined by the
U.S. Environmental Protection Agency (1994) for land application of biosolids (data not presented). Arsenic levels of 44 mg·kg–1in
YW in 2014 slightly exceeded the more restrictive levels established for exceptional quality biosolids (U.S. Environmental Protec-tion Agency, 1994).
Of all the waste amendments, GW had the highest N concentration (49 g·kg–1),
exceed-ing even the commercially available chicken manure product (45 g·kg–1) used in the PF
blend (Table 2). The other waste amendments all contained <40 g N/kg. Although some wastes had a low N content, all had C:N ratios favorable for the release of inorganic N (<25:1) (Brady and Weil, 2008), with the exception of PF, which had C:N ratios of 66:1 (2013) and 51:1 (2014) after blending with chicken manure. All of the waste amendments contained >95% organic N (data not presented).
The waste amendments contained <6 g P/kg with the exception of GW, which had a P content approaching its N content (39 g P/kg) (Table 2). Because plants remove less P from the soil per unit of N removed, the N:P ratio of GW can lead to the over application of P if it is applied to meet crop N needs. Unlike mineral fertilizers, not all of the P in waste amend-ments is plant-available. For example, the plant availability of P from biosolids ranges from nearly 0% to 100%, depending on how the wastewater was treated (Elliot et al., 2005). Although all waste application rates provided greater than the recommended amount of P (Table 1), further testing would be necessary to determine if low first-year availability of P could potentially limit crop growth. Waste amendment K content was generally low and ranged from 0.3 g K/kg (GW in 2013) to 27.4 g K/kg (YW in 2013).
Soil properties. Amendment with wastes did not negatively impact soil EC. Despite most waste EC levels being above the recom-mended level of 3 dS·m–1 (Soumare et al.,
2003), soil EC did not exceed 0.6 dS·m–1(data
not presented) and was consistently below the level (1 dS·m–1) at which sensitive crops are
expected to suffer yield losses (Maas, 1984). This is supported by Casado-Vela et al. (2007) who reported that addition of composted sewage sludge with EC values exceeding the recommended level did not lead to excessive soil EC.
Soil samples taken from sweet corn plots after amendment application in 2013 and 2014, as well as ‘Montauk’ corn ears har-vested in 2014, were tested for heavy metals (Mo, Pb, Se, As, Hg, Zn, Cu, Ni, Cr, and Cd). There was no significant difference among treatments for any heavy metal in either soil or sweet corn ears (data not presented). In addition, levels of Pb in sweet corn ears as well as sweet corn, squash, and potato leaf tissues samples were below detection. The lack of significant differences indicates that short-term application of these wastes is unlikely to significantly raise heavy-metal levels in comparison with a mineral fertilizer. However, because heavy metals are retained in the soil by binding to OM or by
reacting with carbonates, oxides of iron and manganese, or sulfides (McBride, 1995; Shober et al., 2003), long-term application of wastes could lead to accumulation in the soil.
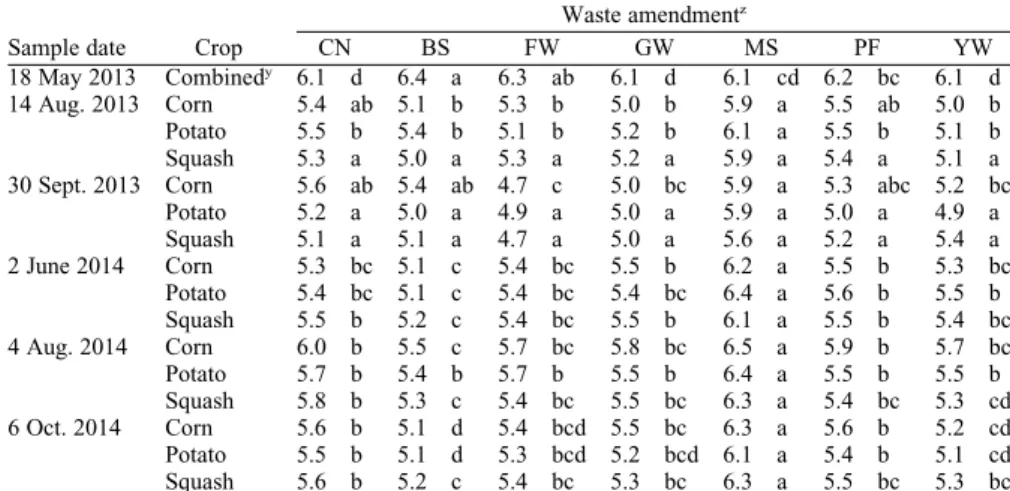
Over the length of the study, the only waste amendment to have a consistent effect on pH compared with the control was MS (Table 3). The soil pH of plots amended with MS was the numerically highest of all treat-ments for all months in 2013 (except May) and significantly higher than all other treat-ments in 2014. The increased pH in plots amended with MS, between 5.6 and 6.5 vs. 5.1 to 6.1 in control plots, was likely due to the large amount of seashells present in MS. Seashells consist primarily of CaCO3, which neutralizes acidity. Crushed oyster shells and clam processing wastes have previously been shown to increase soil pH (Lee et al., 2008; Owen et al., 2008) and are commonly used in New England as liming agents.
In 2014, the pH of plots treated with YW and BS was often significantly lower than that of the control (Table 3). Of the nine sampling events for pH in 2014 (three crops sampled on three dates), plots treated with YW had significantly lower pH than that of
the control for three of the nine, and plots amended with BS were lower for six of the nine. It is unlikely that this was due to the pH of the amendments alone because in 2014 YW had a pH of 6.7 and BS had a pH of 7.9, the highest of all the amendments. The de-crease in pH could be related to microbial processes that produce acidity, such as de-composition of OM and oxidation of reduced N and S compounds (Bolan and Hedley, 2003).
Despite large additions of OM to waste-amended plots and no addition of OM to control plots, there were no statistically significant differences in the percent OM in sweet corn, potato, or squash plots for any of the dates sampled because of a large gradient in OM across the field (Table 4). Once the data were corrected for this, changes in OM levels that were different from the control were not apparent until Oct. 2014 and were only observed in sweet corn (1.36% point change for BS vs. 0.57 for CN) and squash (1.87% point change for YW vs. 0.10 for CN). The increases in soil OM in plots amended with BS and YW may be due to the type of organic compounds
Table 2. Electrical conductivity (EC), pH, organic matter (OM), C, N, P, and K content, and C:N ratio of waste amendments. Values are g·kg–1dry matter except for pH, C:N, and EC (dS
·m–1).
Amendment type Yr
Property
EC pH OM C N C:N P K
n= 1 n= 1 n= 1 n= 2 n= 2 n= 2 n= 1 n= 2–3
Mineral fertilizer (Control) 2014 345 4.6 — — 200 — 87 166.0
Biosolids/yard waste compost 2013 7.3 5.1 612 334 33 10 4.6 17.1
2014 7.0 7.9 535 326 32 10 5.8 25.2
Dehydrated food waste 2013 10.2 5.5 539 454 37 12 2.9 18.0
2014 10.1 5.5 627 486 34 14 3.0 15.4
Gelatin waste 2013 5.5 4.9 769 477 49 10 39.0 0.3
Multisource compost 2013 3.9 6.7 106 94 9 10 1.9 11.9
2014 5.3 7.1 194 147 16 9 3.0 11.1
Paper fiber/chicken manure 2013 7.3 — 815 327 9 66 2.4 11.9
2014 9.5 — 793 402 12 51 2.0 9.3
Yardwaste compost 2013 4.0 6.5 377 210 17 13 2.3 27.4
2014 1.8 6.7 344 196 15 13 2.1 24.3
Table 3. Mean soil pH for sweet corn, potatoes, and butternut squash in 2013 and 2014 (3–4 replicates). Soil amendments were applied before first sampling date in 2013 and reapplied on 20 May 2014. Means separation by Fisher’s least significant difference. Treatments within a row with the same letter were not significantly different (P< 0.05). All crops and sampling dates were analyzed separately.
Sample date Crop
Waste amendmentz CN BS FW GW MS PF YW 18 May 2013 Combinedy 6.1 d 6.4 a 6.3 ab 6.1 d 6.1 cd 6.2 bc 6.1 d 14 Aug. 2013 Corn 5.4 ab 5.1 b 5.3 b 5.0 b 5.9 a 5.5 ab 5.0 b Potato 5.5 b 5.4 b 5.1 b 5.2 b 6.1 a 5.5 b 5.1 b Squash 5.3 a 5.0 a 5.3 a 5.2 a 5.9 a 5.4 a 5.1 a
30 Sept. 2013 Corn 5.6 ab 5.4 ab 4.7 c 5.0 bc 5.9 a 5.3 abc 5.2 bc
Potato 5.2 a 5.0 a 4.9 a 5.0 a 5.9 a 5.0 a 4.9 a Squash 5.1 a 5.1 a 4.7 a 5.0 a 5.6 a 5.2 a 5.4 a 2 June 2014 Corn 5.3 bc 5.1 c 5.4 bc 5.5 b 6.2 a 5.5 b 5.3 bc Potato 5.4 bc 5.1 c 5.4 bc 5.4 bc 6.4 a 5.6 b 5.5 b Squash 5.5 b 5.2 c 5.4 bc 5.5 b 6.1 a 5.5 b 5.4 bc 4 Aug. 2014 Corn 6.0 b 5.5 c 5.7 bc 5.8 bc 6.5 a 5.9 b 5.7 bc Potato 5.7 b 5.4 b 5.7 b 5.5 b 6.4 a 5.5 b 5.5 b Squash 5.8 b 5.3 c 5.4 bc 5.5 bc 6.3 a 5.4 bc 5.3 cd 6 Oct. 2014 Corn 5.6 b 5.1 d 5.4 bcd 5.5 bc 6.3 a 5.6 b 5.2 cd Potato 5.5 b 5.1 d 5.3 bcd 5.2 bcd 6.1 a 5.4 b 5.1 cd Squash 5.6 b 5.2 c 5.4 bc 5.3 bc 6.3 a 5.5 bc 5.3 bc z
CN = mineral fertilizer control; BS = biosolids/yard waste cocompost; FW = dehydrated food waste; GW = gelatin waste; MS = multisource compost; PF = paper fiber/chicken manure; YW = yard waste compost. y
they contained. Both BS and the YW were composted, a process which leaves behind the organic compounds most resistant to breakdown (Bernal et al., 1998; De Neve et al., 2003). Higher concentrations of re-sistant organic compounds could explain why BS and YW had a significant effect on OM levels, whereas noncomposted wastes (PF, GW, and FW) did not. Although MS was also composted, almost 50% of its C was from an
inorganic source (seashells) and therefore less likely to contribute to soil OM. Although varying amounts of organic residue returned to the soil from 2013 crop production could have affected 2014 OM levels, no significant differences in the change in soil OM were seen in early 2014. Amendment with organic wastes did not impact soil moisture during the study, with no significant differences in gravimetric water content observed for any
month or crops in 2013 or 2014 (data not presented).
Soil bulk density, measured for sweet corn plots in the spring of 2014 after the first growing season, was significantly lower in plots amended with FW (1.08 g·cm–3)
com-pared with the control plots (1.18 g·cm–3).
Bulk density in other waste-amended plots was not significantly different from the con-trol (data not presented). Low bulk density is desirable because it allows plant roots to more easily penetrate the soil and increases pore space, which allows movement of gases and water (Brady and Weil, 2008).
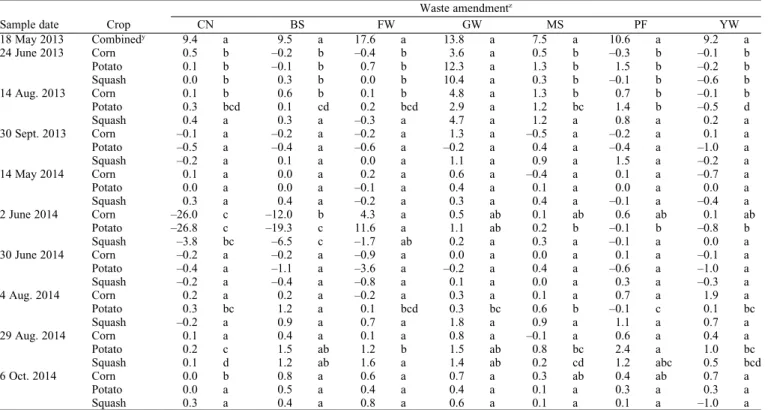
Soil fertility. At the 18 May 2013 and 2 June 2014 sampling dates (directly following amendment addition), control plot inorganic N (NO3+ NH4) levels were significantly higher than most waste-amended plots (Table 5) de-spite higher application rates of total N for all waste amendments compared with the control. This supports findings of low initial inorganic N availability from waste amendments; reported first-year N availability levels range from 5% to 15% of total N for YW (Amlinger et al., 2003), 10% to 21% for MWS compost (Hargreaves et al., 2008), and 37% for fresh biosolids (Gilmour et al., 2003).
In 2013, inorganic N levels were highest at the 4 Aug. sampling event, including in the control plots, whereas in 2014 both the 2 June and 30 June sampling events had moderately high levels for all plots includ-ing the control. The difference in timinclud-ing between the highest levels of inorganic N in 2013 and 2014 could be due to variation in
Table 4. Mean values of the soil organic matter for sweet corn, potato, and butternut squash plots in 2013 and 2014 (four replicates). Soil amendments were applied on 20 May 2014; therefore, 14 May 2014 data represent preamendment levels. Amendments were applied before first sampling date in 2013. There were no significant differences for any crop or date sampled (P< 0.05). All crops and sampling dates were analyzed separately.
Sample date Crop
Waste amendmentz CN BS FW GW MS PF YW 18 May 2013 Combinedy 5.84 5.56 5.28 5.58 5.66 5.34 5.60 30 Sept. 2013 Corn 6.63 6.81 5.77 6.29 6.61 6.53 6.57 Potato 6.25 5.85 5.61 6.17 6.25 6.38 6.23 Squash 6.27 6.20 5.78 6.15 6.57 6.48 6.27 14 May 2014 Corn 6.67 6.20 5.68 6.01 6.17 6.48 6.41 Potato 6.42 5.66 5.70 5.80 6.10 6.17 6.06 Squash 6.31 6.33 5.66 5.69 6.17 6.33 6.06 2 June 2014 Corn 6.64 6.84 5.87 6.29 6.38 6.66 6.73 Potato 6.54 6.77 5.97 6.00 6.40 6.53 6.91 Squash 6.21 6.13 5.86 5.86 6.04 6.13 6.18 4 Aug. 2014 Corn 6.95 7.07 6.32 6.54 6.63 6.98 7.22 Potato 6.68 6.77 6.11 6.28 6.66 6.71 6.38 Squash 6.80 6.96 6.16 6.19 6.68 6.74 6.74 6 Oct. 2014 Corn 6.99 7.33 6.27 6.43 6.79 7.05 7.13 Potato 6.62 6.73 6.05 6.32 6.70 6.87 6.85 Squash 6.53 7.06 5.90 6.42 6.36 6.86 7.88 z
CN = mineral fertilizer control; BS = biosolids/yard waste cocompost; FW = dehydrated food waste; GW = gelatin waste; MS = multisource compost; PF = paper fiber/chicken manure; YW = yard waste compost. yComposite samples taken on 18 May 2013 for all three crops.
Table 5. Mean soil inorganic N (mg N/g dry soil) (ammonium + nitrate) levels for sweet corn, potato, and butternut squash plots in 2013 and 2014 (four replicates). Soil amendments were applied before first sampling date in 2013 and reapplied on 20 May 2014. Means separation by Fisher’s least significant difference. Treatments within a row with the same letter were not significantly different (P< 0.05). All crops and sampling dates were analyzed separately.
Sample date Crop
Waste amendmentz CN BS FW GW MS PF YW 18 May 2013 Combinedy 22.5 ab 26.8 a 4.4 c 17.3 b 23.3 ab 8.1 c 7.6 c 24 June 2013 Corn 6.4 c 6.5 c 11.6 ab 15.2 a 8.0 bc 6.4 c 5.1 c Potato 2.6 b 1.9 b 3.8 b 15.1 a 3.8 b 3.6 b 3.5 b Squash 5.4 c 5.6 c 13.7 b 30.4 a 6.8 c 6.4 c 5.1 c 14 Aug. 2013 Corn 56.9 b 83.1 b 51.9 b 930.9 a 205.7 b 193.4 b 38.4 b Potato 26.9 b 45.3 b 42.0 b 624.1 a 234.2 b 162.1 b 146.6 b Squash 32.5 a 67.4 a 55.7 a 1,269.8 a 237.4 a 170.5 a 33.1 a 30 Sept. 2013 Corn 3.4 b 2.9 b 3.8 b 9.1 a 7.5 a 3.9 b 2.6 b Potato 10.7 c 12.0 bc 13.7 bc 28.6 a 16.6 b 13.6 bc 12.4 bc Squash 7.7 c 10.3 bc 13.4 b 21.6 a 8.7 bc 6.2 c 5.0 c 14 May 2014 Corn 4.0 bc 2.5 c 3.9 bc 4.5 ab 6.1 a 4.0 bc 3.8 bc Potato 3.3 ab 2.3 b 3.8 ab 2.9 b 5.0 a 3.7 ab 2.1 b Squash 3.4 a 3.4 a 5.0 a 4.9 a 6.2 a 3.4 a 3.3 a 2 June 2014 Corn 80.8 a 43.0 b 18.5 c 17.3 c 22.7 bc 10.7 c 13.0 c Potato 124.5 a 73.1 b 19.3 d 22.1 cd 39.8 c 16.6 d 23.6 cd Squash 34.5 a 28.7 a 16.6 bc 12.4 cd 20.4 b 8.8 d 10.7 cd 30 June 2014 Corn 55.1 a 46.7 ab 55.7 a 33.2 bc 31.1 c 12.8 d 20.6 cd Potato 87.1 a 72.2 ab 71.6 ab 30.7 c 39.2 bc 13.5 c 20.2 c Squash 67.8 a 80.7 a 56.8 a 36.0 a 40.0 a 14.0 a 25.3 a 4 Aug. 2014 Corn 9.1 b 15.0 b 28.0 a 8.0 b 13.8 b 7.1 b 4.5 b Potato 4.1 abc 3.1 bc 5.6 a 3.3 bc 4.9 ab 3.0 bc 2.3 c Squash 7.8 a 6.2 a 19.0 a 6.4 a 9.6 a 3.6 a 3.3 a 29 Aug. 2014 Corn 10.0 b 6.4 b 25.1 a 7.6 b 10.8 b 3.8 b 2.9 b Potato 4.5 b 3.5 b 17.9 a 5.9 b 4.8 b 4.4 b 4.4 b Squash 5.2 bc 6.3 ab 9.2 a 4.4 bc 6.8 ab 4.3 bc 2.8 c 6 Oct. 2014 Corn 5.0 b 4.2 b 8.5 a 3.6 b 8.1 a 4.1 b 2.8 b Potato 6.5 a 6.6 a 13.0 a 8.2 a 7.5 a 7.0 a 4.8 a Squash 7.0 b 8.3 b 18.6 a 8.8 b 8.9 b 8.3 b 6.7 b z
CN = mineral fertilizer control; BS = biosolids/yard waste cocompost; FW = dehydrated food waste; GW = gelatin waste; MS = multisource compost; PF = paper fiber/chicken manure; YW = yard waste compost.
y
climate and soil conditions. Inorganic N levels are influenced by the amount of N being mineralized by biological activity: controlled by many factors including soil moisture and temperature and by the amount of nitrate lost to leaching (Hazzard and Howell, 2014). For example, increased leaching loss of NO3 in early 2013 could explain the later peak in inorganic N levels: in June 2013, two precipitation events over 40 mm were recorded at a nearby weather station, whereas there were no precipita-tion events over 40 mm in June of 2014 (data not presented). The elevated inorganic N levels in control plots could be potentially explained by the mineralization of existing organic N from soil OM and previous crops (including winter cover crop).
For sampling dates beginning 24 June 2013 and 4 Aug. 2014, plots amended with FW, MS, and GW (2013 only) had signifi-cantly higher inorganic N levels compared with the control for at least some sampling dates and crops (Table 5). Plots amended with MS did not have significantly higher inorganic N levels, compared with the con-trol plots, until 30 Sept. 2013 and 6 Oct. 2014 sampling events, later than GW (2013 only) and FW. Whereas these results in-dicate that FW, MS, and GW have potential for high first-year N availability, MS may provide a slower release of inorganic N than GW and FW. A possible explanation for the earlier release of inorganic N from FW and GW could be that, unlike BS, MS, and YW,
these wastes had not undergone composting, which leaves behind organic compounds more resistant to breakdown and therefore were more easily and quickly broken down by soil microorganisms (Bernal et al., 1998; De Neve et al., 2003).
Conversely, inorganic N levels in plots amended with BS, PF, and YW were never significantly higher than the control, despite higher N application rates, indicating partic-ularly low levels of N availability for these wastes. Furthermore, inorganic N levels in plots amended with PF were never signifi-cantly different from YW (Table 5). This was despite a higher N application rate in YW plots compared with PF plots (Table 1) and a C:N ratio for YW (13:1) vs. PF (51 to 66:1) that is more conducive to N mineralization, which suggests that C:N ratio alone is not a reliable indicator of N availability from these wastes.
Whereas C:N ratio has often been relied on as an indicator of potential N availability, N mineralization is also related to factors not represented by this ratio, such as the type of carbon compounds, alkyl-C content, water-soluble organic N, and uric acid content of a material (Cabrera et al., 2005). Although pH and salinity can affect N mineralization, YW did not have an exceptional pH (6.5– 6.7) or high salinity (1.8–4.0 dS·m–1)
(Ta-ble 2). Slightly higher heavy-metal levels, particularly Pb and As, were present in YW compared with the other wastes, and heavy metals have been shown to both increase and
decrease N mineralization (Cabrera et al., 2005).
Potentially mineralizable nitrogen is a measure of the organic N that is mineralized to NH4during a 7-d incubation of saturated soil and takes into account immobilization caused by excess C (Gugino et al., 2009). In 2013, significant differences in PMN values between control and waste-amended plots were rare (Table 6). Only plots amended with GW had significantly higher PMN values than control plots, likely due to the high rate of N application in GW amended plots (Table 1). In 2014, there were no significant differences in PMN between any treatments for 11 of the 18 sampling events. When there were significant differences, some or all of the waste-amended plots had significantly higher PMN values than the control plots.
Because PMN represents mineralizable or-ganic N, it was expected that waste-amended plots, which received organic N, would have higher soil PMN than control plots, which did not receive organic N. However, we did not see evidence of this for most wastes (except GW) until the second season of the study and even then results were inconsis-tent. Our results show that organic waste amendments can increase PMN values in comparison with a mineral fertilizer control, although high organic N application rates and more than one season of application may be necessary to achieve this.
Because PMN is the difference in soil levels of NH4between the beginning and end of a 7-d
Table 6. Mean values of potentially mineralizable nitrogen (PMN) for sweet corn, potato, and butternut squash plots in 2013 and 2014 (four replicates). Soil amendments were applied before first sampling date in 2013 and reapplied on 20 May 2014. Means separation by Fisher’s least significant difference. Treatments within a row with the same letter were not significantly different (P< 0.05). All crops and sampling dates were analyzed separately.
Sample date Crop
Waste amendmentz CN BS FW GW MS PF YW 18 May 2013 Combinedy 9.4 a 9.5 a 17.6 a 13.8 a 7.5 a 10.6 a 9.2 a 24 June 2013 Corn 0.5 b –0.2 b –0.4 b 3.6 a 0.5 b –0.3 b –0.1 b Potato 0.1 b –0.1 b 0.7 b 12.3 a 1.3 b 1.5 b –0.2 b Squash 0.0 b 0.3 b 0.0 b 10.4 a 0.3 b –0.1 b –0.6 b 14 Aug. 2013 Corn 0.1 b 0.6 b 0.1 b 4.8 a 1.3 b 0.7 b –0.1 b Potato 0.3 bcd 0.1 cd 0.2 bcd 2.9 a 1.2 bc 1.4 b –0.5 d Squash 0.4 a 0.3 a –0.3 a 4.7 a 1.2 a 0.8 a 0.2 a 30 Sept. 2013 Corn –0.1 a –0.2 a –0.2 a 1.3 a –0.5 a –0.2 a 0.1 a Potato –0.5 a –0.4 a –0.6 a –0.2 a 0.4 a –0.4 a –1.0 a Squash –0.2 a 0.1 a 0.0 a 1.1 a 0.9 a 1.5 a –0.2 a 14 May 2014 Corn 0.1 a 0.0 a 0.2 a 0.6 a –0.4 a 0.1 a –0.7 a Potato 0.0 a 0.0 a –0.1 a 0.4 a 0.1 a 0.0 a 0.0 a Squash 0.3 a 0.4 a –0.2 a 0.3 a 0.4 a –0.1 a –0.4 a 2 June 2014 Corn –26.0 c –12.0 b 4.3 a 0.5 ab 0.1 ab 0.6 ab 0.1 ab Potato –26.8 c –19.3 c 11.6 a 1.1 ab 0.2 b –0.1 b –0.8 b Squash –3.8 bc –6.5 c –1.7 ab 0.2 a 0.3 a –0.1 a 0.0 a 30 June 2014 Corn –0.2 a –0.2 a –0.9 a 0.0 a 0.0 a 0.1 a –0.1 a Potato –0.4 a –1.1 a –3.6 a –0.2 a 0.4 a –0.6 a –1.0 a Squash –0.2 a –0.4 a –0.8 a 0.1 a 0.0 a 0.3 a –0.3 a 4 Aug. 2014 Corn 0.2 a 0.2 a –0.2 a 0.3 a 0.1 a 0.7 a 1.9 a Potato 0.3 bc 1.2 a 0.1 bcd 0.3 bc 0.6 b –0.1 c 0.1 bc Squash –0.2 a 0.9 a 0.7 a 1.8 a 0.9 a 1.1 a 0.7 a 29 Aug. 2014 Corn 0.1 a 0.4 a 0.1 a 0.8 a –0.1 a 0.6 a 0.4 a Potato 0.2 c 1.5 ab 1.2 b 1.5 ab 0.8 bc 2.4 a 1.0 bc Squash 0.1 d 1.2 ab 1.6 a 1.4 ab 0.2 cd 1.2 abc 0.5 bcd 6 Oct. 2014 Corn 0.0 b 0.8 a 0.6 a 0.7 a 0.3 ab 0.4 ab 0.7 a Potato 0.0 a 0.5 a 0.4 a 0.4 a 0.1 a 0.3 a 0.3 a Squash 0.3 a 0.4 a 0.8 a 0.6 a 0.1 a 0.1 a –1.0 a z
CN = mineral fertilizer control; BS = biosolids/yard waste cocompost; FW = dehydrated food waste; GW = gelatin waste; MS = multisource compost; PF = paper fiber/chicken manure; YW = yard waste compost.
y
incubation, it is possible to have negative PMN values if less NH4is present in the soil at the end of the incubation. Negative PMN values were observed for all waste amendments and the control at some point during the study. The lowest PMN values were observed in June of 2014 in corn and potato control plots (–26.0 and –26.8mg N/g soil) and BS amended plots (–12.0 and –19.3mg N/g soil).
Negative PMN values could be due to higher gross rates of immobilization than mineralization of inorganic N during incuba-tion. This would be expected for control plots because no organic N was added, and recent tillage likely accelerated decomposition by breaking down plant residue in the soil and increasing microbial access to oxygen, caus-ing soil microbes to immobilize some of the inorganic N present. One possible cause of
negative PMN values in plots amended with BS could have been the maturity of the compost, if it had not finished actively composting at the time of application. Bernal et al. (1998) found that the initial mixture of raw sewage sludge and cotton waste caused the most immobilization when added to soil; once the materials had reached the end of the active phase of composting, the period of immobilization was shorter (2 d), and mature compost did not cause any immobilization.
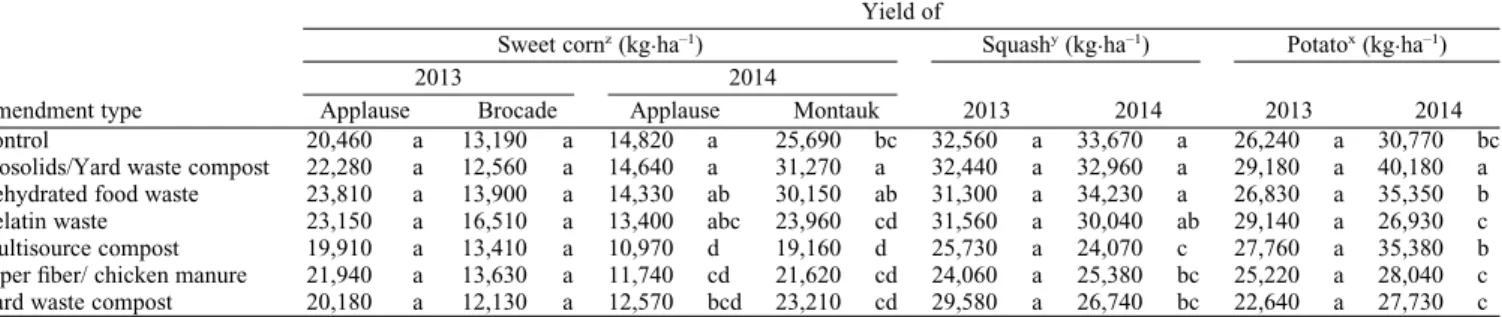
Crop yield.Applied without supplemental fertilizer, BS, FW, and GW produced yields that were either comparable (not significantly different) or significantly higher than the control for all crops and cultivars in 2013 and 2014 (Table 7). However, plots amended with MS, PF, and YW produced significantly less ‘Applause’ sweet corn and butternut
squash in 2014 compared with the control. In addition, MS produced significantly less ‘Montauk’ sweet corn in 2014 compared with the control. Yields from plots amended with PF, YW, and MS were not significantly different from the control for all other crops and years.
Compared with the control, sweet corn and squash from plots amended with YW, PF, and MS received equivalent or higher rates of N, P, and K (Table 1). The exception was PF, which received30 kg-P/ha, which was less than the control (49 kg-P/ha) but higher than the recommended rate for sweet corn and butternut squash of 20 kg-P/ha (Hazzard and Howell, 2014). Despite higher application rates, N applied to waste-amended plots was primarily in the organic form and re-quired mineralization before it was available to plants. It is possible that N in YW, PF, and MS amended plots did not mineralize in time to be available at the appropriate growth stages for sweet corn and squash and was therefore responsible for reduced yields.
Tissue levels of nutrients did not reveal a likely cause for reduced yields (data not presented). Critical nutrient levels (the lower limit for adequate growth) were based on Maynard and Hochmuth (2007) for pump-kins (most recent mature leaf, 8 weeks after seeding), sweet corn (most recent mature leaf, just before tasseling), and potatoes (most recent mature leaf, first blossom stage). These levels represent the closest approximation for the stage of maturity at which tissue samples were taken. Although levels of N, P, Ca, Mg, Mo, Cu, and Fe were sufficient for all crops and years tested, some or all treatments showed deficiencies of K, Mn, B, and Zn (data not presented). However, even when treatments with lower yields showed deficient nutrient levels, these levels were not significantly dif-ferent from those of the control.
Crop growth and quality.Plots amended with PF had significantly lower emergence of potatoes than the control in 2014 (80% vs. 93%) and produced significantly shorter plants in 2013 (7.6 vs. 12.6 cm) and 2014 (35.0 vs. 44.4 cm). In addition, potato plants from plots amended with FW (2014), GW (2014), and YW (2013 and 2014) were significantly shorter than the control (data not presented).
Table 7. Mean sweet corn, butternut squash, and potato yield for 2013 and 2014 (four replicates). Treatments with same letter within each column were not significantly different (P< 0.05). Cultivars, crops, and years were analyzed separately.
Amendment type Yield of Sweet cornz(kg ·ha–1) Squashy(kg ·ha–1) Potatox(kg ·ha–1) 2013 2014 2013 2014 2013 2014
Applause Brocade Applause Montauk
Control 20,460 a 13,190 a 14,820 a 25,690 bc 32,560 a 33,670 a 26,240 a 30,770 bc
Biosolids/Yard waste compost 22,280 a 12,560 a 14,640 a 31,270 a 32,440 a 32,960 a 29,180 a 40,180 a
Dehydrated food waste 23,810 a 13,900 a 14,330 ab 30,150 ab 31,300 a 34,230 a 26,830 a 35,350 b
Gelatin waste 23,150 a 16,510 a 13,400 abc 23,960 cd 31,560 a 30,040 ab 29,140 a 26,930 c
Multisource compost 19,910 a 13,410 a 10,970 d 19,160 d 25,730 a 24,070 c 27,760 a 35,380 b
Paper fiber/ chicken manure 21,940 a 13,630 a 11,740 cd 21,620 cd 24,060 a 25,380 bc 25,220 a 28,040 c
Yard waste compost 20,180 a 12,130 a 12,570 bcd 23,210 cd 29,580 a 26,740 bc 22,640 a 27,730 c
z
Corn yield is all marketable ears harvested, including husk. Because of varying plant density between cultivars, sweet corn yields were calculated as the weight of ears harvested/plant and converted to kg·ha–1based on a plant density of 47,361 plants/ha.
y
Squash yield is the total weight of squash harvested (both marketable and culls).
xPotato yield is the total weight of all three categories of quality: firsts (marketable), seconds (potentially usable for secondary market-like processing), and culls.
Fig. 1. Mean potato quality, measured as the fraction (by weight) of total harvest that were firsts (marketable), seconds (potentially usable for secondary market-like processing), and culls for plots in 2013 and 2014 (four replicates). Means separation by Fisher’s least significant difference. Treatments with the same letter were not significantly different (P< 0.05). Each year and category were analyzed separately. BS = biosolids/yard waste cocompost; CN = mineral fertilizer control; FW = dehydrated food waste; GW = gelatin waste; MS = multisource compost; PF = paper fiber/chicken manure; YW = yard waste compost.
However, there were no significant differ-ences in emergence of sweet corn or squash in 2014, and no wastes had significantly shorter sweet corn plants than the control in 2013 or 2014. Significant differences may have been seen in potatoes but not sweet corn or squash because of the earlier planting date of potatoes.
Potatoes harvested from plots amended with PF were of significantly better quality than the control in 2014, e.g., a higher pro-portion of firsts and fewer seconds (Fig. 1). This was in spite of an overall drop in quality in 2014, when all treatments yielded a lower proportion of firsts and higher pro-portion of seconds compared with 2013, because of increased incidence of disease and pests. Amendment with noncomposted paper fiber may have contributed to lower disease, pest pressure, or both. Others have reported suppression ofRhizoctonia solani and snap bean root rot (Pythium spp. and Aphanomyces euteiches) after amendment with both composted and raw paper fiber (Croteau and Zibilske, 1998; Rotenberg et al., 2007). However, while amendment with composted paper fiber reduced symp-toms of bacterial speck (Pseudomonas syringaepv.tomato) in tomatoes (Solanum lycopersicumL.) and thale cress (Arabidop-sis thalianaL.), noncomposted paper fiber did not (Vallad et al., 2003).
Feasibility.Although some waste streams are widely available to farmers for use as amendments (yard waste, food scraps, and biosolids), others are more specific to the areas that house industry (gelatin waste and paper fiber). The cost of transporting wastes to farms would make locally available sour-ces the most economical. The composition of waste amendments in this study varied, dem-onstrating that it would be beneficial for farmers to calculate the cost not only per weight or volume of waste but also based on their desired nutrient (N, P, K etc.) or benefit (C to build OM or liming equivalency) when choosing between different wastes. Many of the wastes in this study could be spread with a box-type manure spreader without further processing after delivery, making spreading accessible without specialized equipment.
Conclusions
Our results illustrate that all the waste amendments tested show promise as sources of plant nutrients. Although waste amend-ment qualities varied between wastes and year-to-year for the same amendment, they did not negatively impact soil moisture, bulk density, EC, or heavy metals in soil or plants. Amendment with MS increased soil pH, whereas amendment with YW and BS low-ered pH but increased soil organic matter. Although the C:N ratio of waste amendments was not a reliable indicator of N mineraliza-tion rate, results indicate that waste amend-ments can increase PMN in the soil. Amendment with BS, FW, and GW produced yields at least as high as the control, whereas YW, PF, and MS produced either lower
yields or yields that were not significantly different. Finally, potatoes grown in plots amended with PF showed inhibition of dis-ease and insect damage.
Literature Cited
Aitken, M.N., B. Evans, and J.G. Lewis. 1998. Effect of applying paper mill sludge to arable land on soil fertility and crop yields. Soil Use Mgt. 14:215–222.
Amlinger, F., B. G€otz, P. Dreher, J. Geszti, and C. Weissteiner. 2003. Nitrogen in biowaste and yard waste compost: Dynamics of mobilisation and availability–A review. Eur. J. Soil Biol. 39:107–116.
Arsova, L., R. van Haaren, N. Goldstein, S.M. Kaufman, and N.J. Themelis. 2008. 16th na-tionwide survey of MSW management in the U.S.: The state of garbage in America. Biocycle 29:22–28.
Bernal, M.P., A.F. Navarro, M.A. Sanchez-Monedero, A. Roig, and J. Cegarra. 1998. Influence of sewage sludge compost stability and maturity on carbon and nitrogen mineralization in soil. Soil Biol. Biochem. 30:305–313.
Bolan, N.S. and M.J. Hedley. 2003. Role of carbon, nitrogen and sulfur cycles in soil acidification, p. 29–52. In: Z. Rengel (ed.). Handbook of soil acidity. Marcel Dekker, Inc., New York, NY. Brady, N.C. and R.R. Weil. 2008. The nature and
properties of soils. 14 ed. Pearson Prentice Hall, Upper Saddle River, NJ.
Cabrera, M.L., D.E. Kissel, and M.F. Vigil. 2005. Nitrogen mineralization from organic residues: Research opportunities. J. Environ. Qual. 34:75–79.
Casado-Vela, J., S. Selles, C. Díaz-Crespo, J. Nav-arro-Pedre~no, J. Mataix-Beneyto, and I. Gomez. 2007. Effect of composted sewage sludge appli-cation to soil on sweet pepper crop (Capsicum annuumvar. annuum) grown under two exploi-tation regimes. Waste Mgt. 27:1509–1518. Chapman, H.D. and P.F. Pratt. 1961. Methods for
analysis for soils, plants and waters. Univ. of California, Div. Agr., Riverside, CA. Chellemi, D.O. and E.N. Rosskopf. 2004. Yield
potential and soil quality under alternative crop production practices for fresh market pepper. Renew. Agr. Food Syst. 19:168–175. Crews, T.E. and M.B. Peoples. 2004. Legume
versus fertilizer sources of nitrogen: Ecological tradeoffs and human needs. Agr. Ecosyst. Environ. 102:279–297.
Croteau, G.A. and L.M. Zibilske. 1998. Influence of papermill processing residuals on sapro-phytic growth and disease caused by Rhizocto-nia solani. Appl. Soil Ecol. 10:103–115. Culley, J.L.B. 1993. Density and compressibility,
p. 529–539. In: M.R. Carter (ed.). Soil sam-pling and methods of analysis. Lewis Pub-lishers, Boca Raton, FL.
De Neve, S., S. Sleutel, and G. Hofman. 2003. Carbon mineralization from composts and food industry wastes added to soil. Nutr. Cycl. Agroecosyst. 67:13–20.
Doane, T.A. and W.R. Horwath. 2003. Spectro-photometric determination of nitrate with a sin-gle reagent. Anal. Lett. 36:2713–2722. Douglas, J.T., M.N. Aitken, and C.A. Smith. 2003.
Effects of five non-agricultural organic wastes on soil composition, and on the yield and nitrogen recovery of Italian ryegrass. Soil Use Mgt. 19:135–138.
Elliot, H.A., J.M. Potter, J.H. Kang, R.C. Brandt, and G.A. O’Connor. 2005. Neutral ammonium citrate extraction of biosolids phosphorus. Commun. Soil Sci. Plan. 36:2447–2459.
Foley, B.J. and L.R. Cooperband. 2002. Paper mill residuals and compost effects on soil carbon and physical properties. J. Environ. Qual. 31:2086–2095.
Gagnon, B., R. Lalande, and S. Fahmy. 2001. Organic matter and aggregation in a degraded potato soil as affected by raw and composted pulp residue. Biol. Fertil. Soils 34:441–447. Gartley, K.L. 2011. Recommended methods for
measuring soluble salts in soils, p. 87–94. In: A. Wolf and J. McGrath (eds.). Recommended soil testing procedures for the Northeastern United States. Northeastern Regional Publica-tion No. 493. 3rd ed. Agr. Expt. Sta., Univ. of Delaware, Newark, DE.
Gilmour, J.T., C.G. Cogger, L.W. Jacobs, G.K. Evanylo, and D.M. Sullivan. 2003. Decompo-sition and plant-available nitrogen in biosolids: Laboratory studies, field studies and computer simulation. J. Environ. Qual. 32:1498–1507. Gugino, B.K., O.J. Idowu, R.R. Schindelbeck,
H.M. van Es, D.W. Wolfe, B.N. Moebius-Clune, J.E. Thies, and G.S. Abawi. 2009. Cornell soil health assessment training man-ual. 2nd ed. Cornell Univ., Geneva, NY. Hargreaves, J.C., M.S. Adl, and P.R. Warman.
2008. A review of the use of composted municipal solid waste in agriculture. Agr. Ecosyst. Environ. 123:1–14.
Hazzard, R.V. and J.C. Howell. 2014. New En-gland vegetable management guide: 2014-2015 ed. Univ. Mass. Ext., Amherst, MA. Hendershot, W.H., H. Lalande, and M. Duquette.
1993. Soil reaction and exchangeable acidity, p. 141–145. In: M.R. Carter (ed.). Soil sam-pling and methods of analysis. Lewis Pub-lishers, Boca Raton, FL.
Kalra, Y.P. and D.G. Maynard. 1991. Methods manual for forest soil and plant analysis. Forestry Canada, Northwest Region, Northern Forestry Centre, Edmonton, Alberta. Lee, C.H., D.K. Lee, M.A. Ali, and P.J. Kim. 2008.
Effects of oyster shell on soil chemical and biological properties and cabbage productivity as a liming materials. Waste Mgt. 28:2702– 2708.
Maas, E.V. 1984. Crop tolerance. Calif. Agr. 38:20–21.
Maynard, A.A. and D.E. Hill. 2000. Cumulative effect of leaf compost on yield and size distribution in onions. Compost Sci. Util. 8:12–18.
Maynard, D.N. and G.J. Hochmuth. 2007. Knott’s handbook for vegetable growers. 5th ed. Wiley, Hoboken, NJ.
McBride, M.B. 1995. Toxic metal accumulation from agricultural use of sludge: Are USEPA regula-tions protective? J. Environ. Qual. 24:5–18. Miller, R.O. 1998. High-temperature oxidation:
Dry ashing, p. 53–56. In: Y.P. Kalra (ed.). Handbook of reference methods for plant anal-ysis. CRC Press, Boca Raton, FL.
Owen, J., S. LeBlanc, P. Toner, C. Nduwamungu, and E. Fava. 2008. Evaluation of fresh and aged clam processing wastes as potential agricultural liming materials for coastal area vegetable production soils. Can. J. Soil Sci. 88:559–569. Ozores-Hampton, M. and D.R.A. Peach. 2002. Biosolids in vegetable production systems. HortTechnology 12:336–340.
Ozores-Hampton, M., P.A. Stansly, and T.P. Salame. 2011. Soil chemical, physical and biological properties of a sandy soil subjected to long-term organic amendments. J. Sustain. Agr. 35:243–259.
Parr, J.F. and S.B. Hornick. 1992. Agricultural use of organic amendments: A historical perspec-tive. Amer. J. Altern. Agr. 7:181–189.
Rotenberg, D., A.J. Wells, E.J. Chapman, A.E. Whitfield, R.M. Goodman, and L.R. Cooperband. 2007. Soil properties associated with organic matter-mediated suppression of bean root rot in field soil amended with fresh and com-posted paper mill residuals. Soil Biol. Bio-chem. 39:2936–2948.
Shober, A.L., R.C. Stehouwer, and K.E. Macneal. 2003. On-farm assessment of biosolids effects on soil and crop tissue quality. J. Environ. Qual. 32:1873–1880.
Sidhu, J.P.S. and S.G. Toze. 2009. Human patho-gens and their indicators in biosolids: A liter-ature review. Environ. Intl. 35:187–201. Simard, R.R., R. Baziramakenga, S. Yelle, and J.
Coulombe. 1998. Effects of de-inking paper sludges on soil properties and crop yields. Can. J. Soil Sci. 78:689–697.
Soil Survey Staff. 2013. Web soil survey. Natural Resources Conservation Service, U.S. Dept.
Agr. 22 Mar. 2016. <http://websoilsurvey.sc. egov.usda.gov/App/HomePage.htm>. Soumare, M., F.M.G. Tack, and M.G. Verloo.
2003. Characterisation of Malian and Belgian solid waste composts with respect to fertility and suitability for land application. Waste Mgt. 23:517–522.
Topp, G.C. 1993. Soil water content, p. 541–557. In: M.R. Carter (ed.). Soil sampling and methods of analysis. Lewis Publishers, Boca Raton, FL.
U.S. Department of Agriculture. 2015. National organic program. 205.203. U.S. Dept. Agr., Washington, DC. 21 Mar. 2016. <http://www. ecfr.gov/cgi-bin/text-idx?rgn=div8&node=7: 3.1.1.9.32.3.354.4>.
U.S. Environmental Protection Agency. 1994. A plain English guide to the EPA part 503 bio-solids rule. U.S. Environmental Protection Agency, Washington, DC.
U.S. Environmental Protection Agency. 2015. Advancing sustainable materials management: 2013 fact sheet. U.S. Environmental Protection Agency, Washington, DC. EPA-530-R-15-003. Vallad, G.E., L. Cooperband, and R.M. Goodman. 2003. Plant foliar disease suppression mediated by composted forms of paper mill residuals exhibits molecular features of induced resis-tance. Physiol. Mol. Plant Pathol. 63:65–77. Weather Channel. 2014. Growing degree days
calculator. The Weather Channel, LLC, 8 Mar. 2015. <http://adstest.climate.weather.com/out-look/agriculture/growing-degree-days/02881>. Weatherburn, M.W. 1967. Phenol-hypochlorite
reaction for determination of ammonia. Anal. Chem. 39:971–974.
Zibilske, L.M., W.M. Clapham, and R.V. Rourke. 2000. Multiple applications of paper mill sludge in an agricultural system: Soil effects. J. Environ. Qual. 29:1975–1981.