QoE-AWARE RESOURCE ALLOCATION FOR CROWDSOURCED LIVE
STREAMING: A MACHINE LEARNING APPROACH
BY
FATIMA HAOUARI
A Thesis Submitted to
the Faculty of the College of Engineering
in Partial Fulfillment of the Requirements for the Degree of Masters of Science in Computing
June 2019
ii The members of the Committee approve the Thesis of
Fatima Haouari defended on 01/06/2019.
Dr. Aiman Erbad Thesis/Dissertation Supervisor
Prof. Amr Mohamed Committee Member
Prof. Mohsen Guizani Committee Member Dr. Tamer Elsayed Committee Member Dr. Hazem Hajj Committee Member Approved:
iii HAOUARI, FATIMA, Masters : June : [2019:], Masters of Science in Computing Title: QoE-Aware Resource Allocation For Crowdsourced Live Streaming: A Machine Learning Approach.
Supervisor of Thesis: Aiman, Mahmood, Erbad.
In the last decade, empowered by the technological advancements of mobile devices and the revolution of wireless mobile network access, the world has witnessed an explosion in crowdsourced live streaming. Ensuring a stable high-quality playback experience is compulsory to maximize the viewers’ Quality of Experience and the content providers’ profits. This can be achieved by advocating a geo-distributed cloud infrastructure to allocate the multimedia resources as close as possible to viewers, in order to minimize the access delay and video stalls.
Additionally, because of the instability of network condition and the heterogeneity of the end-users capabilities, transcoding the original video into multiple bitrates is required. Video transcoding is a computationally expensive process, where generally a single cloud instance needs to be reserved to produce one single video bitrate representation. On demand renting of resources or inadequate resources reservation may cause delay of the video playback or serving the viewers with a lower quality. On the other hand, if resources provisioning is much higher than the required, the extra resources will be wasted.
In this thesis, we introduce a prediction-driven resource allocation framework, to maximize the QoE of viewers and minimize the resources allocation cost. First, by exploiting the viewers’ locations available in our unique dataset, we implement a
iv site. Second, based on the predicted results that showed to be close to the actual values, we formulate an optimization problem to proactively allocate resources at the viewers’ proximity. Additionally, we will present a trade-off between the video access delay and the cost of resource allocation.
Considering the complexity and infeasibility of our offline optimization to respond to the volume of viewing requests in real-time, we further extend our work, by introducing a resources forecasting and reservation framework for geo-distributed cloud sites. First, we formulate an offline optimization problem to allocate transcoding resources at the viewers’ proximity, while creating a tradeoff between the network cost and viewers QoE. Second, based on the optimizer resource allocation decisions on historical live videos, we create our time series datasets containing historical records of the optimal resources needed at each geo-distributed cloud site. Finally, we adopt machine learning to build our distributed time series forecasting models to proactively forecast the exact needed transcoding resources ahead of time at each geo-distributed cloud site. The results showed that the predicted number of transcoding resources needed in each cloud site is close to the optimal number of transcoding resources.
v DEDICATION
vi First and foremost, I would like to thank the Almighty for giving me the strength and patience to work on this thesis, so that today I can stand proudly with my head held high.
I extend my heartiest gratitude to my parents. I thank my mother for her unconditional love and support, and my father for being such a great model and setting an example to me. I owe thanks to a very special person, my husband, Houssem for his continued and unfailing love, understanding and emotional support during my pursuit of Master’s degree that made the completion of thesis possible. He was always around at times I thought that it is impossible to continue; he gave me the extra strength and motivation to get things done. I deeply appreciate his confidence in me and for always showing me how proud he is. I appreciate my kids, Adel and Mariam for tolerating my being preoccupied and the patience they showed during this journey. Words would never be enough to express how grateful I am to all of you. I consider myself the luckiest in the world to have such a lovely and caring family, standing beside me with their love and unconditional support.
I would like to sincerely thank my thesis supervisor, Dr. Aiman Erbad, for believing in me and pushing me to always give my best. I would also like to thank Prof. Amr Mohamed, and Prof. Mohsen Guizani for their valuable comments and encouragement all the time. My deepest thanks to Dr. Emna Baccour for her valuable guidance, timely suggestions, and support throughout the thesis journey.
This contribution was made possible by NPRP grant 8-519-1-108 from the Qatar National Research Fund (a member of Qatar Foundation). The findings achieved herein are solely the responsibility of the authors.
vii
DEDICATION ... v
ACKNOWLEDGMENTS ... vi
LIST OF TABLES ... xi
LIST OF Figures ... xii
LIST OF ALGORITHMS ... xiv
Chapter 1: Introduction ... 1
1.1 Overview and Motivation ... 1
1.2 Thesis objectives and contributions ... 4
1.3 Thesis overview ... 6
Chapter 2: Background/Related work ... 7
2.1 Background ... 7
2.1.1. Crowdsourced Live Streaming... 7
2.1.2. Quality Of Experience (QoE) ... 7
2.1.3. Elastic cloud computing ... 8
2.1.4. Time series forecasting ... 9
2.1.5. Machine learning algorithms ... 9
2.1.5.1 Multilayer Perceptron (MLP) ... 9
2.1.5.2 Decision Trees (DT) ... 10
viii
2.1.5.5 Long Short Term Memory (LSTM)... 11
2.1.5.6 Gated Recurrent Unit (GRU) ... 11
2.1.5.7 Convolutional Neural Network (CNN) ... 12
2.2 Related works ... 12
2.2.1 Geo-distributed clouds to maximize QoE ... 12
2.2.2 Resource allocation to maximize QoE ... 12
2.2.3 Machine learning to maximize QoE ... 14
Chapter 3: QoE-Aware Resource Allocation for Crowdsourced Live Streaming: A machine Learning Approach ... 16
3.2 System model ... 16
3.2.1 Predicting live videos viewers ... 17
3.2.1.1 Dataset ... 17
3.2.1.2 Preprocessing ... 19
3.2.1.3 Predictive models ... 20
3.2.1.4 Predictive models results ... 22
3.2.2 Proactive live video allocation and viewers serving ... 29
3.2.2.1 Problem formulation ... 29
3.2.2.1 Proactive resource allocation ... 32
ix
3.3.2 Simulation results ... 34
Chapter 4: Transcoding Resources Forecasting and Reservation for Crowdsourced Live Streaming ... 38
4.1 Motivation ... 38
4.2 Contributions ... 39
4.3 System model ... 39
4.3.1 Optimal transcoding resources for historical videos ... 41
4.3.1.1 Dataset ... 41
4.3.1.2 Preprocessing ... 41
4.3.1.3 Problem formulation ... 42
4.3.2 Time series resources forecasting ... 47
4.3.3 Proactive resources reservation ... 49
4.4 Performance Evaluation... 50
4.4.2 Simulation results ... 52
CHAPTER 5: CONCLUSION ... 59
5.1 Limitations and Future Work ... 60
Publications ... 61
1. Accepted ... 61
x REFERENCES ... 62
xi
Table 1. Overview Of Features For Predicting Number Of Viewers. ... 20
Table 2. Best Predictive Models Configurations. ... 21
Table 3. Notations For The Formalized Problem. ... 31
Table 4. Notations For The Formalized Problem. ... 45
Table 5. Best Resources Predictive Models Configurations. ... 48
Table 6. 2 Testing Results For 8.8ms Latency Threshold Dataset. ... 54
Table 7. 2 Testing Results For 120ms Latency Threshold Dataset. ... 54
xii
Figure 1. MLP architecture [17]. ... 10
Figure 2. LSTM memory unit [22]. ... 11
Figure 3. GRU memort unit [22]. ... 12
Figure 4. Proactive resource allocation system model. ... 17
Figure 5. A live video stream metadata/features ... 18
Figure 6. Viewers predictive model. ... 19
Figure 7 Mapping viewers to AWS datacenters... 20
Figure 8. Predictive models 2 validation comparisons. ... 23
Figure 9. Predictive models 2 testing comparisons. ... 23
Figure 10. Asia Mumbai predicted vs actual number of viewers... 24
Figure 11. Asia Seoul predicted vs actual number of viewers. ... 24
Figure 12. Asia Singapore predicted vs actual viewers number. ... 25
Figure 13. China Ningxia predicted vs actual viewers number. ... 25
Figure 14. Europe Frankfurt predicted vs actual viewers number. ... 26
Figure 15. Europe Paris predicted vs actual viewers number. ... 26
Figure 16. South America Sao Paulo predicted vs actual viewers number. ... 27
Figure 17. US East Ohio predicted vs actual viewers number. ... 27
Figure 18. US East Virginia predicted vs actual viewers number. ... 28
Figure 19. US West California predicted vs actual viewers number. ... 28
Figure 20. Hourly incoming videos/ Hourly predicted viewers. ... 35
Figure 21. Hourly optimal cost. ... 36
Figure 22. Total system cost vs latency threshold... 36
xiii
Figure 25. Resources forecasting and reservation system model... 40
Figure 26. System model timeline at the start of t... 47
Figure 27. Hourly optimal cost. ... 52
Figure 28. Hourly average latency. ... 52
Figure 29. Actual vs predicted cloud instances at Singapore/8.8ms latency threshold dataset. ... 56
Figure 30. Actual vs predicted cloud instances at Singapore/120ms latency threshold dataset. ... 56
Figure 31. Actual vs predicted cloud instances at Singapore/180ms latency threshold dataset. ... 56
Figure 32. Actual vs predicted cloud instances at Frankfurt/8.8ms latency threshold dataset. ... 57
Figure 33. Actual vs predicted cloud instances at Frankfurt/120ms latency threshold dataset. ... 57
Figure 34. Actual vs predicted cloud instances at Frankfurt/180ms latency threshold dataset. ... 57
Figure 35. Actual vs predicted cloud instances at Virginia/8.8ms latency threshold dataset. ... 58
Figure 36. Actual vs predicted cloud instances at Virginia/120ms latency threshold dataset. ... 58
Figure 37. Actual vs predicted cloud instances at Virginia/180ms latency threshold dataset. ... 58
xiv Algorithm 1. Proactive resources allocation. ... 33 Algorithm 2. Proactive resources reservation. ... 49
1 CHAPTER 1: INTRODUCTION
1.1Overview and Motivation
Crowdsourced live video streaming where users broadcast their captured live videos is on the rise, and it continues to grow every single day. As per Cisco mobile video traffic statistics, mobile video content is predicted to present 82% of the global Internet traffic in 2021 compared to 73% in 20161. The rise in popularity of
crowdsourced live streaming can be attributed to technological advancement, proliferation of smartphones and wireless network availability, which have led crowdsourcers to broadcast their live videos to various content providers.
One of the most popular video live streaming platform is Facebook, which had 2.19 billion active users per month in the first quarter of 20182. 78% of Facebook online
users are watching live videos, and 1 out of 5 videos on Facebook is live3.
The industry and academia have shown an overwhelming interest in crowdsourced streaming recently in terms of achieving the best Quality of Experience (QoE) as it is the key to increase the audiences’ number and the content providers' revenues. A series of recent studies have been conducted to determine the main factors that affect the viewers' QoE [1] [2]. These studies revealed that viewers QoE is primarily dependent on two factors: first, the video startup delay and playback buffering stalls, and second, the video quality which depends on the viewers' internet connectivity quality and available video representations. They also showed that viewers who experienced low QoE are less likely to revisit the content provider's application within
1 https://www.cisco.com/c/en/us/solutions/collateral/service-provider/visualnetworking-index-vni/mobile-white-paper-c11-520862.html
2 https://www.statista.com/statistics/264810/number-of-monthly-active-facebook 3 https://www.wordstream.com/blog/ws/2017/11/07/facebook-statistics
2 a specific period of time. Therefore, video startup, rebuffering delays and low video quality have high impact on viewers' QoE. However, the challenge is to serve the viewers with the best QoE possible, while minimizing the cost of the resources allocated.
Cloud computing is a powerful technology in terms of offering elastic and cost-effective computing resources [3] for live streaming applications. In fact, geo-distributed cloud live video applications can benefit from on demand resource renting, where cloud instances can be paid on hourly basis without upfront payment or any long term commitment [4]. The challenge is that live streaming applications have strict video startup delay requirement, including transcoding and streaming delay, while in fact it takes time for a cloud instance to be activated. As per He et al. [4] experiments, it takes two minutes for an Amazon EC2 cloud instance to boot up and function. Therefore, to minimize the initialization delay, a certain amount of cloud instances should be pre-rented for the upcoming time frame, where upfront payment can be made for a long-term reservation [4]. Moreover, various cloud providers offer up to 75% discount for reserving cloud instances proactively as opposed to on demand cloud instances pricing4. The challenge of cloud instances pre-renting is that resources
can be insufficient to transcode all the videos into viewers matching video quality requests, or over-provisioned, which may lead to significant additional costs to the service providers.
Many pioneer works have been done on optimizing crowdsourced live videos on resource allocation for geo-distributed clouds to maximize the QoE. He et al. [4] introduced a dynamic programming approach for transcoding resources scheduling to
3 minimize the cost and maximize the QoE. K. Bilal et al. [5] proposed a QoE-aware resource allocation framework for multiview crowdsourced live streaming to choose the optimal cloud site locations for transcoding. Wu et al. [6] formulated an optimal viewing request distribution in the geo-distributed clouds; they predicted users future demands based on their social influences using an epidemic model. The drawback of these traditional algorithms is the near optimal solutions they provide. First, they assume that the popularity of the videos is known at the start of the video streaming based on the number of views which is not the case as the number of views can be determined at the end of streaming only. Second, they assume that the viewers are in one region near the broadcaster’ region, however the videos’ viewers are usually geographically distributed. So they lack the ability to allocate the needed resources beforehand. This may either lead to over-provisioning of resources that may incur significant costs to the service providers, or under-provisioning of resources that may cause delays to the viewers. Therefore, addressing such a trade-off proactively is a real challenge that requires some accurate prediction techniques. Moreover, these works considered on demand renting of cloud instances, which is not always adequate for live streaming systems due to the startup time needed to boot servers.
To the best of our knowledge, there is no research work that applied machine learning techniques for resource allocation or reservation to maximize QoE and minimize the cost. Only a few studies adopted machine learning to improve the viewers QoE, with their focus varies from dealing with the buffering and the bitrate selection [7] to determining Adaptive Bitrate (ABR) best parameters in order to improve adaptive video streaming [8]. Petrangeli et al [7] proposed a video freeze predictive model to detect possible factors that lead to video stalling at the viewers’ side. A recent study by Le et al. [8] proposed using decision trees to choose the best ABR parameters to
4 improve the adaptive video streaming.
Moreover, few recent studies have used machine learning for predicting the viewers' QoE. Zhu et al. [9] predicted the users’ engagement score, by considering users engagement as a function of Quality of Service (QoS) factors and viewers preferences. Balachandran et al. [1] proposed a classification model for users’ engagement, where users’ engagement was quantified in terms of users’ number of visits and video watching time.
1.2Thesis objectives and contributions
The aim of this research is to first, tackle the problem of predictive-driven resource allocation to maximize the content providers profit and the viewers QoE. Specifically, we aim to predict the video popularity of each live video at the start of the live streaming, in order to allocate the live videos replicas at the proximity of the viewers to minimize the access delay.
Second, we study the problem of proactive transcoding resources reservation to minimize the network system cost and maximize the QoE. Specifically, we aim to predict the number of computational cloud instances needed for transcoding at each geo-distributed cloud site, in order to reserve them in advance, and consequently minimize the access delay and maximize the content providers’ profit.
The research questions we aim to study in this thesis are the following:
1. How to decide the popularity of the videos at the start of live streaming? 2. How to minimize the system cost while guaranteeing serving distributed
viewers from their proximity around the world?
3. How to reserve the exact number of transcoding resources in advance to minimize the cost and delay without over or under provisioning of resources?
5 The contributions of this thesis are as follows:
We address the problem of predicting the live videos popularity at the start of live streaming. In particular, we consider predicting the number of viewers near each geo-distributed cloud site for each incoming live video, in order to proactively allocate resources at the proximity of the viewers.
1. Using Facebook 2018 live videos dataset5 containing records of viewers'
locations for each video, we develop a regression model using machine learning techniques that predicts the number of viewers near different geo-distributed cloud sites for each incoming live video.
2. To serve the predicted viewers such that they experience the minimum startup delay with a minimal cost to the content provider, we formulate an optimization problem for allocating resources as close as possible to the viewers.
We present a proactive distributed transcoding resource reservation framework. First, we consider an offline resource allocation optimization that uses past incoming videos to decide the optimal number of transcoding cloud instances at each cloud site, while respecting the latency and requested video bitrates constraints. Second, based on the optimization decisions on past data, we adopt machine learning to proactively forecast the needed computational resources at each cloud site for the next time frame.
1. We preprocess Facebook 2018 live videos dataset [10] containing records of viewers' locations to calculate the number of viewers for each video bitrate representation near different geo-distributed cloud sites.
6 2. We develop an offline resource allocation optimization for allocating transcoding resources, and serving the viewers from their nearest cloud site, with the objective to minimize the overall system cost while maximizing the viewers' QoE.
3. Based on the optimizer resource allocation decisions on historical live videos, we create our time series datasets containing historical records of the rented resources at each geo-distributed cloud site.
4. To proactively reserve the exact transcoding resources for incoming live videos, we adopt machine learning to build our distributed time series resources forecasting models.
1.3Thesis overview
This chapter provided an overview of the research problem, and presented the thesis objectives and contributions. We organize the remainder of the thesis as follows. We introduce the main concepts used in our work, and we review the related works in chapter 2. Our prediction-driven resource allocation framework system model and evaluation results are presented in chapter 3. We present our resources forecasting and reservation framework system model and evaluation results in chapter 4. Finally we conclude and present possible future work in chapter 5.
7
CHAPTER 2: BACKGROUND/RELATED WORK
In this chapter, we will review some of the related works on resource allocation for crowdsourced live streaming along with some background on the concepts related to this thesis.
2.1Background
2.1.1.Crowdsourced Live Streaming
In 2005, crowdsourcing was introduced by Meriam-Webster [4], where content providers’ resources are collected from crowds of users instead of suppliers or employees. Over the past six years, crowdsourced live streaming have emerged, with various content providers, such as Facebook, YouTube, Periscope and Twitch, to name a few. In such applications, users broadcast their captured live videos, e.g., online game scenes or live events, to the data center. The received live videos will be encoded in the data center, and optionally transcoded into various bitrate representations [11]. In fact, every live video may have multiple versions with various resolutions and bitrates [4] in order to maximize the viewers’ satisfaction.
2.1.2.Quality Of Experience (QoE)
The industry and academia have shown an overwhelming interest in crowdsourced streaming recently in terms of achieving the best QoE as it is the key to increase the audiences’ number and the content providers' revenues. A series of recent studies have been conducted to determine the main factors that affect the viewers' QoE [1] [2]. These studies revealed that viewers’ QoE is primarily dependent on two factors: first, the video startup delay and playback buffering stalls, and second, the video quality which depends on the viewers' internet connectivity quality and available video bitrate representations. Krishnan et al. [2] highlighted that the higher the startup delay is, the more the viewers’ abandonment increases.
8 They also showed that viewers who experienced high startup delay are less likely to revisit the content provider's application within a specific period of time. Therefore, video startup and rebuffering delays have high impact on viewers' QoE. Moreover, Viewers’ devices heterogeneity on their screen resolutions, computational and bandwidth capacity demands transcoding the original live video into multiple bitrates such as 240p, 360p, 480p and 720p. To handle this heterogeneity, most video service providers deployed Adaptive Bitrate (ABR) and lately dynamic adaptive streaming over HTTP (Dash) [12]. Video transcoding is a computationally expensive process where generally a single cloud instance needs to be reserved to produce one single video bitrate representation [4]. The higher the number of viewers’ demands, the more cloud instances will be used. Therefore, not all live videos are transcoded into all video bitrate representations, leading to lower QoE.
2.1.3.Elastic cloud computing
Cloud computing is a powerful technology in terms of offering elastic and cost-effective computing resources [3] for live streaming applications. In fact geo-distributed cloud live video applications can benefit from on demand resource renting, where cloud instances can be paid on hourly basis without upfront payment or any long term commitment [13]. The challenge is that live streaming applications have strict video startup delay requirement, including transcoding and streaming delay, while in fact it takes time for a cloud instance to be activated. As per He et al. [4] experiments, it takes two minutes for an Amazon EC2 cloud instance to boot up and function. Therefore, to minimize the initialization delay, a certain number of cloud instances should be pre-rented for the upcoming time frame, where upfront payment can be made for a long-term reservation [13]. Moreover, various cloud providers offer up to 75% discount for reserving cloud instances proactively as opposed to on demand
9 cloud instances pricing [14].
The challenge of cloud instances pre-renting is that resources can be insufficient to transcode all the videos into viewers matching video quality requests, or over-provisioning, which may lead to significant additional costs to the service providers.
2.1.4.Time series forecasting
A time series is a set of observations o1, o2, o3,…., oN , each one being recorded at a
specific time t [15]. Time series forecasting is predicting future values oN+h at time N
for h steps, Given that h is the lag time or forecasting horizon. Both the time the forecasting is made and the forecasting horizon should be specified before forecasting [16].
2.1.5.Machine learning algorithms
2.1.5.1Multilayer Perceptron (MLP)
Multilayer Perceptron (MLP), is a feed forward multilayer artificial neural network which is based upon the Back Propagation rule [17] . This learning rule applies the extended gradient-descent technique. A neural Network traverses through two phases. Firstly, the forward pass phase, where outputs are computed and their error from the expected output is measured. Secondly, it goes through the backward pass, where the error calculated in the previous phase is used to adjust the associated weights. This is achieved by implementing the backpropagation algorithm and helps in minimizing the error. This two-step process undergoes repeated iterations during the training process until an acceptable error rate is reached. The multilayer perceptron is a set of of simple interconnected neurons as illustrated in Fig. 1.
10
2.1.5.2Decision Trees (DT)
Decision trees are a well-established machine learning technique. It is a tree-like model for classification or regression problems. Each node in the tree splits a data set into subsets while the decision tree is incrementally developed. In fact, the resulting tree will contain decision nodes and leaf nodes. A decision node has two or more edges. A Leaf node represents a decision or classification.
2.1.5.3Random Forest (RF)
RF is an efficient machine learning algorithms, which has been successfully used, and proved to produce great results for many classification and regressions tasks. RF is an ensemble of DTs. In fact, RF builds various DT models then merges them to produce more accurate predictions [18].
2.1.5.4XGboost
XGboost, extreme gradient boosting is a distributed implementation of the gradient boosting decision tress [19]. Boosting is an ensemble method where new models are added sequentially to predict the residuals or errors of existing models and then added
11 together to make the final prediction. The process of adding models will continue until no extra improvement can be achieved. XGboost is widely used by data scientists and provides state-of-the-art results on many classification and regression problems [19].
2.1.5.5Long Short Term Memory (LSTM)
LSTM is a deep learning algorithm that has time-varying inputs and outputs. The core idea of an LSTM network is that the hidden neuron is treated as a memory unit [20] that can maintain the temporal state. The LSTM memory unit is comprised of three gates namely, input gate i, forget gate f, and output gate o as illustrated in Fig. 2. In fact, the LSTM basic process can be expressed as follows [21]: First, the new input information will be stored to the memory unit if the input gate is activated. Second, if the forget gate is activated, it will forget the past unit status. Finally, once the output gate is activated, it will propagate the final state.
2.1.5.6Gated Recurrent Unit (GRU)
Like LSTM, GRU has a memory unit. However, it has only two gates namely, the reset and update gate illustrated as r and z respectively in Fig. 3. Its memory content
12 is fully exposed at each time step. Moreover, the previous and the current memory content are balanced using leaky integration [22].
2.1.5.7Convolutional Neural Network (CNN)
Convolutional neural networks (CNN) are a special case of the neural network. It is a non-fully-connected neural network that consists of multi convolutional layers, RELU layer, pooling layers, which are followed by multi connected layers as in a regular neural network [23].
2.2Related works
2.2.1 Geo-distributed clouds to maximize QoE
Live streaming applications are highly dynamic applications that demand strict video startup delay requirements. Therefore, it is challenging to design a cost-effective live streaming application. Geo-distributed clouds are proposed to support large-scale live streaming applications to minimize the overall system cost and to enhance the QoE [4] [5] [6] [24]. As they provide a cost-effective solution by offering on-demand cloud resources that meets the ever-increasing demands of bandwidth and storage, and by serving on the fly frequent viewer's requests.
2.2.2 Resource allocation to maximize QoE
Many pioneer works have been done on optimizing crowdsourced live streaming on Figure 3. GRU memort unit [22].
13 resource allocation for geo-distributed clouds to maximize the QoE. He et al. [4] presented a resource allocation framework to allocate geo-distributed cloud service to crowdsourcers for transcoding and serving viewers, by proposing a cloud rental strategy. They proposed a cloud rental approach based on dynamic programming, where they took into consideration the limitation of elastic cloud supply in each geo-distributed cloud. They further extended their experiments by proposing a heuristic that pre-rank the cloud instances in advance, in order to achieve faster running time. K. Bilal et al. [5] presented a QoE-aware resource allocation framework for crowdsourced multiview live streaming to choose the optimal transcoding cloud site location, and the optimal set of video representations. They first formulated the resource allocation as an optimization problem. However, because of the size and complexity of the problem, they introduced a greedy heuristic that proved to achieve a near optimal solution. Chen et al. [24] introduced a cost-effective framework for cloud resources provisioning to cope with geo-distributed video broadcasters. They built a prototype for crowdsources live streaming using Amazon Cloud and Microsoft Azure to evaluate their system, which proved to be effective in terms of cost and streaming quality. However, the mentioned studies assumed that the popularity of the videos based on the number of views is known at the start of the video live streaming, which is not the case in reality. Moreover, they assume that the viewers are in one region near the broadcaster’ region, but the video’ viewers are usually geo-distributed. In our work, we exploit the viewers’ locations in our dataset to map the viewers of each video into Amazon geo-distributed cloud sites. Then, we predict the popularity of each video at the start of streaming by predicting the number of viewers near each geo-distributed cloud site.
14 clouds, they predicted users future demands based on their social influences using an epidemic model. They then served the predicted viewers by introducing one-shot optimization. They evaluated their system performance using Amazon Elastic cloud computing (EC2). The results proved that their method outperforms some heuristics algorithms.
2.2.3 Machine learning to maximize QoE
Only a few studies adopted machine learning to improve the viewers QoE, with their focus varies from dealing with the buffering and the bitrate selection [7], to determining Adaptive Bitrate (ABR) best parameters in order to improve adaptive video streaming [8]. Petrangli et al. [7] proposed machine learning based framework to prevent video stalling to maximize the viewers QoE. As part of their framework, they introduced a video freeze predictive model to detect possible factors that lead to video stalling at the viewers’ side. A recent study by Le et al. [8] proposed adaptation of existing decision trees algorithms to choose the best ABR parameters, in order to improve the adaptive video streaming. The authors showed that the performance of an ABR algorithm can be improved by 8.59% by applying their approach.
Moreover, few recent studies have used machine learning for predicting the viewers' QoE. Zhu et al. [9] predicted the users’ engagement score, by considering users engagement as a function of Quality of Service (QoS) factors and viewers preferences. They then formulated an optimization problem to map the users to content delivery networks (CDN) in order to maximize the QoE.
Balachandran et al. [1] proposed a classification model for users’ engagement, where users’ engagement was quantified in terms of users’ number of visits and video watching time. Their predictive model is useful to handle the video delivery mechanisms for the content providers and the video player designers. To our
15 knowledge, no prior studies examined machine learning for resource allocation to maximize QoE for crowdsourced live streaming. Our contribution in this context is to first, predict the popularity of the videos at the start of the live streaming in order to allocate videos replicas at the proximity of the viewers to maximize their QoE. Second, forecasting the transcoding resources ahead of time at each geo-distributed cloud site to minimize the system cost and delay without over or under provisioning of resources.
16
CHAPTER 3: QOE-AWARE RESOURCE ALLOCATION FOR CROWDSOURCED LIVE STREAMING: A MACHINE LEARNING
APPROACH
In this chapter, we address the problem of predicting the live videos popularity at the start of live streaming. In particular, we consider predicting the number of viewers near each geo-distributed cloud site for each incoming live video, in order to proactively allocate resources at the proximity of the viewers.
3.1Contributions
1. Using Facebook 2018 live videos dataset [10] containing records of viewers' locations for each video, we develop a regression model using machine learning techniques that predicts the number of viewers near different geo-distributed cloud sites for each incoming live video.
2. To serve the predicted viewers such that they experience the minimum startup delay with a minimal cost to the content provider, we formulate an optimization problem for allocating resources as close as possible to the viewers.
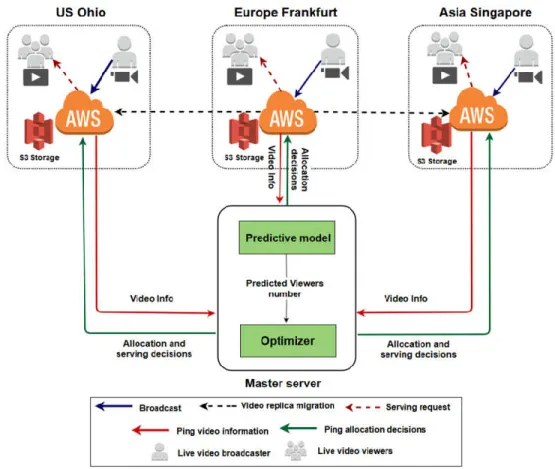
3.2System model
In our system, we adopt a geo-distributed cloud infrastructure as shown in Fig. 4 that consists of multiple geographically distributed cloud sites. Our predictive model and resource allocation optimizer are deployed in a centralized master server. A set of geo-distributed crowdsourcers broadcast their videos in real time, which will be allocated by default in their nearest cloud site. Each broadcaster cloud site will report the master server with the incoming live videos information. The predictive model will predict the number of viewers expected near each cloud site. Based on the predicted results, the optimizer will allocate live videos replicas across the geo-distributed cloud sites
17 near the viewers’ proximity to minimize the delay and video stalls with the minimum possible cost. Moreover, the optimizer determines from which cloud site the viewers should be served.
In our work, we consider only the storage resources, while the computation resources for video transcoding are not considered in this framework.
Figure 4. Proactive resource allocation system model.
3.2.1 Predicting live videos viewers
3.2.1.1Dataset
In our work, we are using the Facebook 2018 live videos dataset [10], containing more than two million Facebook live video streams. The active video streams metadata are
18 fetched every 3 minutes in different periods on January, February, March, May, June and July 2018. As a result, we obtained a list of fetches related to each video and containing the number of viewers at the recording time. The live videos are collected with many features such as creation time and date, broadcaster location, number of likes and most importantly the viewers' locations. In this work, we selected six features for each video namely, the broadcaster name, content category, created time, created day, broadcaster location and the viewers' locations as illustrated in Fig. 5. The viewers' locations were selected from the video fetch with maximum number of viewers.
19 Figure 6. Viewers predictive model.
3.2.1.2Preprocessing
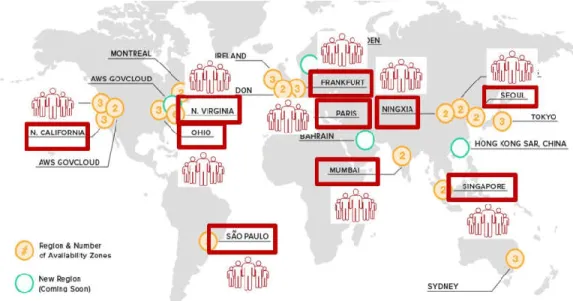
As our objective is to predict the viewers’ number near various geo-distributed cloud sites, there was a need to preprocess our raw data. First, as illustrated in Figure 7, we mapped the viewers’ locations into 10 Amazon Web Services (AWS) cloud sites locations6 namely, Asia-Mumbai, Asia-Seoul, Asia-Singapore, China-Ninxgia,
Europe-Frankfurt, Europe-Paris, South America-Sao paulo, US Ohio, US East-Virginia and US West-California. This was done by calculating the shortest distance between the viewer’s locations and the 10 AWS cloud sites location7. Furthermore,
we calculated the number of viewers near each cloud site for each video. We did the same to the broadcaster location, where we mapped his location into the nearest AWS cloud site.
Moreover, we clustered the created time into 6 time periods. Finally, we applied the categorical one-hot encoding to the time period, created day and broadcaster location features, while we used feature hashing introduced by [25] to transform the high-cardinality features namely broadcaster name and content category into hashed feature
6 https://aws.amazon.com/about-aws/global-infrastructure/
20 vectors. An overview of how we processed our features is presented in Table 1.
Table 1. Overview Of Features For Predicting Number Of Viewers.
Feature Feature representation
Broadcaster Name Feature hashing: a vector of 6 bits Content Category Feature hashing: a vector of 6 bits
Created day One hot encoding of 7 days
Created time One hot encoding of 6 time periods
Broadcaster Location One hot encoding of 10 locations
3.2.1.3Predictive models
The dataset used to train our models included 224,839 live video records collected in March, May and June 2018. 80% of the records were randomly selected for training and 20% were used for validation.
We trained our regression models to produce 10 outputs as illustrated in Fig. 5, each represents the number of viewers near the 10 AWS cloud sites mentioned previously. We adopted three different ML algorithms namely, Multilayer-perceptron (MLP), Figure 7. Mapping viewers to AWS datacenters.
21 Decision trees (DT) and Random Forest (RF).
We used Scikit-learn python library8 to build several models using each ML
algorithm, as there is no method to predetermine the best combination of hyperparameters, such as the number of hidden layers and neurons for MLP models, number of forests for RF models and the max depth for DT models. Finally, the best models were selected by a grid search approach considering the best determination coefficient values, which is used to assess the goodness of fit of our regression models. values approaching 1 indicate that the model provides accurate predictions, and it is calculated according to Eq.1 :
=1-
∑ ( )∑ ( ̅)
Eq. 1
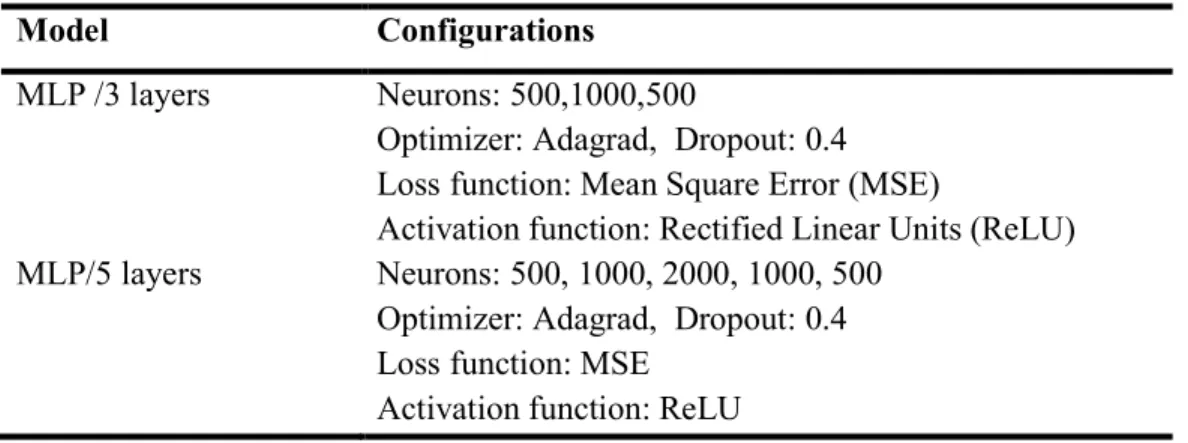
Where m is the number of videos, is the actual number of viewers for video i, is the predicted number of viewers for video i, and ̅ is the mean of the actual number of viewers of all videos. In Table 2, we present our best models hyperparameters configurations. In our MLP models we adopted the dropout proposed by [26], where some neurons are disabled during the training process to avoid overfitting.
Table 2. Best Predictive Models Configurations.
8 https://scikit-learn.org/stable/
Model Configurations
MLP /3 layers Neurons: 500,1000,500
Optimizer: Adagrad, Dropout: 0.4 Loss function: Mean Square Error (MSE)
Activation function: Rectified Linear Units (ReLU) MLP/5 layers Neurons: 500, 1000, 2000, 1000, 500
Optimizer: Adagrad, Dropout: 0.4 Loss function: MSE
22
3.2.1.4Predictive models results
After training the models, the validation results, depicted in Fig. 6, showed that RF outperforms the other ML algorithms by achieving for example an of 0.91 for Seoul, 0.89 for Sao Paulo, 0.85 for Ohio, 0.86 for California and 0.74 for China. The DT model achieved the lowest as opposed to MLP and RF. The results showed that increasing the number of layers for the MLP models improves the results. However, due to the complexity of the models, and because we noticed that there is a slight difference between the performance of the 5 layers model and the 7 layers model, we did not increase the layers above 7.
The results also showed that for all ML models, the predicted number of viewers near some regions achieved a higher compared to other regions, China achieved the lowest, while Seoul and Sao paulo achieved the best . This could be attributed to the fact that some regions have a higher number of videos broadcasted near to them. We further tested our models on unseen data of live videos collected from July 1 to July 6, 2018. The models performed the same as with validation data in some regions, slightly less or higher in other regions as shown in Fig. 7. We then extended our experiments by performing the predictions on hourly basis for 24 hours using the live
Model Configurations
MLP/7 layers Neurons: 500, 1000, 1500, 2000, 1500, 1000, 500 Optimizer: Adagrad
Dropout: 0.4 Loss function: MSE Activation function: ReLU Random Forest Loss function: MSE
Number of estimators: 50 Decision trees Loss function: MSE
23 videos of July 3, 2018. The RF and MLP 7 layers models were used for prediction, since they performed better than other models. The predicted number of viewers for the hourly incoming live videos versus the actual number of viewers for all cloud sites are presented in Fig. 8 to Fig. 17. Since our results demonstrate that the RF predictions are the closest to the actual values, we will adopt this model in our system.
Figure 9. Predictive models testing comparisons. Figure 8. Predictive models validation comparisons.
24
Figure 10. Asia Mumbai predicted vs actual number of viewers.
25 Figure 12. Asia Singapore predicted vs actual viewers number.
26 Figure 14. Europe Frankfurt predicted vs actual viewers number.
27 Figure 17. US East Ohio predicted vs actual viewers number.
28 Figure 18. US East Virginia predicted vs actual viewers number.
29
3.2.2 Proactive live video allocation and viewers serving
In this section, we formulate the problem of proactive resource allocation, to derive the optimal number of video allocation cloud sites and the nearest cloud site to serve the viewers, with an objective of minimizing the cost constrained by the access delay. We then, present our proactive resource allocation algorithm.
3.2.2.1Problem formulation
The set of incoming videos at period t is denoted by V (t) = { , , , …. }. The set of regions is represented by R ={ , , , … , }. Let , and denote the broadcasting region, video allocation region and video serving region respectively. The round trip delay from to is represented by .
Let P(t) = { , , , … … , } represent the set of predicted viewers for the incoming videos at period t . As each video has predicted viewers in different regions, let ={ , , , … . . } denote the set of the number of predicted viewers at different regions for each video v. The broadcasters' regions for the incoming videos at period t is denoted by B(t)= { , , … . }.
Due to the fact that some videos do not have any viewers near some cloud sites, let E(v, ) present a binary variable equal to 1, if video v has predicted viewers near the region , and 0 otherwise.
The decision variable A(v, ) is equal to 1, if video v is allocated in region , and 0 otherwise. While the decision variable W(v, , ) is equal to 1, if viewers at region are served from region and 0 otherwise. The problem formulation notations are presented in Table. 3.
We consider renting S3 storage9 servers at each cloud site. Three types of costs are
9 https://aws.amazon.com/s3/pricing/
30 taken into account: (1) the storage cost at each cloud site; (2) the migration cost of a video replica from one cloud site to another and (3) the cost of serving viewers. We assume that the storage capacity can be provisioned based on the application demand. On allocation cloud site at region , let be the storage cost per GB, which varies based on site location and the storage thresholds fixed by Amazon S3. For example, Amazon charges 0.023$ per GB for the first 50TB, while it charges 0.021$ when exceeding 500TB in the case of US East Virginia region9.
Given that Κ is the video size, the total storage cost S can be calculated as presented in Eq. 2.
S= ∑ ∈ ( )∑ ∈ *Κ*A(v, ) Eq. 2
Given that is the cost to migrate a copy of a video from the broadcaster region to allocation region , which is the data transfer cost from one cloud site to another per GB, the total migration cost M is calculated as presented in Eq. 3.
M=∑ ∈ ( )∑ ∈ ∗ ∗ ( , ) Eq. 3
Given that is the serving request cost from region , which is the data transfer cost from that region to the internet per GB, the total serving request cost R is calculated as presented in Eq. 4. The overall cost C to serve viewers is shown in Eq. 5.
R=∑ ∈ ( )∑ ∈ ∑ ,∈ ∗ ∗ ∗ ( , , ) Eq. 4
C=S+M+R Eq. 5
Our objective is to minimize the cost for period t as shown in Eq. 6:
( , ) ( , , )C Eq. 6
Subject to the following constraints:
31 A(v, )=1 Ɐ v ∈ V(t), Ɐ ∈ B(t) Eq. 6a
A video v can be served from region to viewers at region , only if it is allocated at region .
( , , ) ≤ A(v, ) Ɐ v ∈ V(t), Ɐ ∈ R, Ɐ ∈ R Eq. 6b
A video v can be served from region to only if there exists viewers at . W(v, , ) ≤ E(v, ) Ɐ v ∈ V(t), Ɐ ∈ R, Ɐ ∈ R Eq. 6c
If there exists viewers for video v at region , they can only be served from one region.
∑ ∈ ( , , )=E(v, ) ) Ɐ v ∈ V(t), Ɐ ∈ R Eq. 6d
The average serving request delay to serve a video v should not exceed a threshold D.
∑ ∈ ∑ ∈ ∗ ∗ ( , , )
∑ ∈
≤ Ɐ ∈ ( ) Eq. 6e
Binary decision variables that can be set to 0 or 1.
A(v, ), W(v, , ) ∈ {0,1} Eq. 6f
Table 3. Notations For The Formalized Problem.
Notation Description
V(t) Set of incoming live videos at period t
R Set of regions
B(t) Set of broadcasters regions for videos at period t
, , Region of video allocation, Region of serving and Region of broadcasting
P(t) Set of predicted viewers for live videos at period t Set of predicted viewers at different R for video v
32
Notation Description
SU Set of storage used at each region
W(v, , ) Binary decision variable that indicates the serving site A(v, ) Binary decision variable that indicates the allocation site E(v, ) Binary variable that indicates viewers existence
Round trip delay between and
RTT Matrix for round trip delay between the different R
D Delay threshold
Κ Video size
Storage cost per GB at region
Migration cost per GB from broadcaster region Serving request cost per GB from
S Total storage cost
M Total migration cost
R Total serving request cost
C Overall cost
3.2.2.1Proactive resource allocation
The proposed proactive resource allocation algorithm is presented in Algorithm. 1. In fact, at each period t, the system receives a set of incoming videos, which will be an input to the viewers’ predictive model. Based on the predicted viewers, the optimal number of allocation cloud sites and the nearest cloud site to serve the viewers will be decided by the optimizer presented in 3.2.2. The storage resources at each cloud site
33 is reserved based on the allocation decisions, and released for ended live videos from the previous periods. Moreover, the viewers are served from their closest cloud site based on the serving decisions.
Algorithm 1. Proactive resources allocation.
3.1Performance evaluation
3.3.1 Simulation settings
In this section, we evaluate the performance of our system using the RF hourly predicted viewers of July 3, 2018 to get the hourly optimal resource allocation for T=24(hours) and t=1(hour). We implemented the optimization problem using Matlab in CVX solver. The number of hourly incoming videos, and the hourly predicted viewers used in our simulation are presented in Fig. 18. In our system, we assume that the video duration is 4 hours, which is the maximum video duration for a Facebook live video. We assume that if a video is allocated in a set of cloud sites at period t, it will be allocated in the same cloud sites for the remaining time periods of streaming. Moreover, because video quality is out of the scope of this thesis we assume that the viewers are served with the best video quality, where we set the video size Κ to 0.738 Gbit. We constructed our round trip time (RTT) matrix by calculating the
34 average RTT from the different cloud sites using10 accessed on September 19, 2018.
The storage and data transfer prices of Amazon S39 are considered in our simulation
to model α, ω and η. We varied the latency thresholds constraints D for serving a video to 8.8ms, 60ms, 120ms, 171ms, 220ms and 371ms. 8.8ms is the latency needed to serve a viewer from its closest cloud region [5].
3.3.2 Simulation results
Fig. 19 shows that we can establish a trade-off between the video access delay and the resource allocation cost. Indeed, the hourly optimal cost is high when the system is forced to serve the viewers from their region by setting the latency threshold to 8.8ms. Relaxing the threshold leads to minimizing the cost. Therefore, the content provider can sacrifice in terms of cost to enhance the QoE or the opposite based on her requirements. It is worth mentioning that the optimal cost is higher in some periods as opposed to others, because, as illustrated in Fig. 18, the number of incoming videos and predicted viewers varies from period to another.
In order to evaluate the total system cost over the 24 hours with various latency thresholds, we calculated the hourly total cost, as presented in Fig. 20. The hourly total cost is defined as the sum of the network cost at period t and the cost of storage of still running videos, which is presented in Eq. 7, given that is the storage usage at region n until period t.
Hourly total cost (t)=C(t)+ ∑ ∈ * Eq. 7
The system total cost is calculated as shown in Eq. 8:
System total cost= ∑ ( ) Eq. 8
Furthermore, we calculated the hits percentages, which represents the percentage of
10 https://wondernetwork.com/pings
35 videos served from the same region of viewers as shown in Fig. 21. Setting the latency to 8.8ms resulted in hits percentage of 100% in every hour, as all viewers will be served from their region. While it is in the range of 20% to 30% with 60ms latency threshold. Moreover, when the latency threshold was set to 120ms, 171ms, 220ms and 371ms, less than 20% of videos were served from the same region of viewers. The hits percentage was very low with high latency thresholds, as the system is not forced to serve the viewers from their closest region.
Finally, to evaluate the accuracy of our resource allocation framework, we calculated the hourly average latency using the proactive serving decisions with variant latency thresholds D. In fact, we calculated the latency of serving the actual number of viewers based on our proactive video allocation and we compared it to the latency derived from the predictive model. The results as shown in Fig. 22 proved that the average latency to serve the actual viewers is very close to the average latency serving the predicted viewers. Moreover, the average latency to serve the actual viewers did not exceed the latency thresholds D.
36
Figure 22. Total system cost vs latency threshold. Figure 21. Hourly optimal cost.
37 Figure 24. Predicted vs actual hourly average latency.
38
CHAPTER 4: TRANSCODING RESOURCES FORECASTING AND RESERVATION FOR CROWDSOURCED LIVE STREAMING
In this chapter, we present a proactive distributed transcoding resource reservation framework. First, we consider an offline resource allocation optimization that uses past incoming videos to decide the optimal number of transcoding cloud instances at each cloud site, while respecting the latency and requested video bitrates constraints. Second, we adopt machine learning to proactively forecast the needed computational resources at each cloud site for the next time frame.
4.1Motivation
The complexity and infeasibility of the optimal solution, in our proposed framework presented in Chapter 3, to respond to the volume of viewing requests in real-time.
The centralization of our predictive model in the master server, in our proposed framework presented in Chapter 3, which makes it less fault tolerant. Assuming that all the viewers will receive the highest quality is not a realistic scenario, because viewers’ devices are usually heterogeneous, and the original broadcasted video quality is not always high.
In our previous framework, resources are allocated on the fly after predicting the potential number of viewers in each site. However, we aim to reserve the computational resources beforehand to minimize the access delay, and minimize the system cost.
Transcoding the original video into multiple video qualities 240p, 360p, 480p and 720p is computationally intensive.
39
4.2Contributions
1. We develop an offline resource allocation optimization for allocating transcoding resources, and serving the viewers from their nearest cloud site, with the objective of minimizing the overall system cost while maximizing the viewers' QoE.
2. To proactively reserve the exact transcoding resources for incoming live videos, we adopt machine learning to build our distributed time series resources forecasting models.
4.3System model
In our work, we adopt a geo-distributed cloud infrastructure as shown in Fig. 23 that consists of multiple geographically distributed data centers. Our offline resource allocation optimizer is deployed in a centralized master server. A set of geo-distributed broadcasters broadcast their live videos, which will be allocated by default with their original bitrate representations in their nearest cloud sites. The incoming live videos information including, viewers’ locations and original broadcasted video quality will be collected in each broadcaster data center. In fact, our system is two-phase.
In the first phase, a collection of live videos is performed for a period T. This collection of historical videos information will be sent to our optimizer, deployed in a master server, in order to decide the optimal number of computational cloud instances rented across the geo-distributed data centers. The optimizer decisions guarantee that the viewers are served their requested video quality with minimum delay and the minimum system cost. Moreover, the optimizer determines from which cloud site the viewers should be served. Decisions are then used to create our time series datasets containing records of the number of cloud instances rented for each past time interval t in T. Such that, each cloud site has its own independent dataset.
40 Then, a predictive model is trained and deployed at each cloud site, in order to predict the number of cloud instances to be reserved for the upcoming time interval.
Phase two is executed in real-time. In fact, at the beginning of period t, the optimizer, will receive historical incoming videos from period t-1 to decide the optimal computational resources at each cloud site cloud site for t+1, as illustrated in Fig. 23. Specifically, the optimizer decisions will be sent to the distributed predictive models in each cloud site, in order to forecast and reserve the required cloud instances for the future period t+1.
41
4.3.1 Optimal transcoding resources for historical videos
In this section, we formulate the problem of offline resource allocation, to derive the optimal number of video transcoding instances and the nearest cloud site to serve the viewers with their requested bitrate representation, with an objective of minimizing the system cost constrained by the startup delay.
4.3.1.1Dataset
In our work, we are using the Facebook 2018 live videos dataset collected by our team [10], containing more than two million Facebook live video streams. The active video streams metadata are fetched every 3 minutes in different periods on January, February, March, May, June, July, September and October 2018. As a result, we obtained a list of fetches related to each video and containing the number of viewers at the recording time. The live videos are collected with many features such as creation time and day, broadcaster location, number of likes and most importantly the viewers' locations. In this work, we selected four features for each video namely, the broadcaster location, viewers’ locations, width and height of the video. The viewers' locations were selected from the video fetch with maximum number of views.
4.3.1.2Preprocessing
As we adopted a geo-distributed cloud infrastructure to build a distributed offline transcoding resource preparation framework, there was a need to preprocess our raw data. First, we mapped the viewers’ locations into 10 Amazon Web Services (AWS) cloud sites locations [27] namely, Asia-Mumbai, Asia-Seoul, Asia-Singapore, China-Ninxgia, Europe-Frankfurt, Europe-Paris, South America-Sao paulo, US East-Ohio, US East-Virginia and US West-California. This was done by calculating the shortest distance between the viewer’s locations and the 10 AWS cloud sites locations. We also mapped the broadcaster location to his nearest AWS cloud site. Furthermore, we
42 extracted the bitrate representation for each video according to its width and height11,
assuming that the frame rate is 30fps and the amount of the motion in the image is medium for all videos. Finally, since requested qualities for each stream are missing from our dataset, and based on bandwidth and screen resolutions statistics12 in each
continent, we classified the requested qualities of each video into four bitrate representation classes: 240p, 360p, 480p and 720p. Note that the highest bitrate representation allowed by Facebook to broadcast live videos is 720p. Finally, for each video, we calculated the number of viewers for each bitrate representation, where we took into consideration that a video cannot have viewers for a video quality higher than the original broadcasted quality.
4.3.1.3Problem formulation
The set of incoming live videos at period t is denoted by V(t)={ , , ,... }. The set of video bitrate representations is represented by Q={ , , , }. 240p, 360p, 480p and 720p are the bitrate representations in Q. Let , and denote the original broadcasted, requested and transcoded video quality respectively. Let QT=1 if ≤ and 0 otherwise. Let QB(t)={ , , ,..., } denote the broadcasted video bitrate representations for the set of incoming videos at period t. The set of regions is denoted by R={ , , ,.... }. Let , and denote the broadcasting region, video transcoding region and video serving region respectively. The round trip delay from to is represented by .
Let P={ , ,... } represent the set of viewers for the incoming videos at period t. As each video has viewers in different regions, let ={ , , ,.... } denote the number of viewers at different regions for a video v. At each region, the number of
11 Rhiannon https://vzaar.com/wp-content/uploads/2018/05/logo-padded-1-300x138.png 12 http://gs.statcounter.com/screen-resolution-stats
43 viewers requesting different bitrate representations is represented by ( )={ ( ),
( ), ( ), ( )}. The broadcasters' regions set for the incoming videos at period t is denoted by B(t)={ , , ,..., }.
Due to the fact that some videos do not have any viewer for a specific bitrate representation near some cloud sites, let E(v, q, ) present a binary variable, equal to 1, if video v has viewers for bitrate representation q near the region , and 0 otherwise.
Video transcoding is a computationally expensive process that requires renting a single elastic cloud instance to transcode a video to a single bitrate representation. In our work, we consider renting an Amazon EC2 c5.large compute instance13 for
transcoding a higher video bitrate to a lower one.
The decision variable I(v, q, r) is equal to 1, if video v is allocated and transcoded to quality q in region r, and 0 otherwise. While the decision variable W(v, , , ) is equal to 1, if viewers at region are served a video with the requested quality from region and 0 otherwise.
Three types of costs are taken into account: (1) the computational cost for renting a number of cloud instances at each cloud site; (2) the migration cost of the original video replica from one cloud site to another and (3) the cost of serving viewers. On transcoding cloud site at region , let the cost of renting a cloud instance per hour, which varies based on site location. For example, Amazon charges for c5.large 0.085$ at Ohio region, while it charges 0.131$ at Sao Paulo [28]. The total transcoding cost T can be calculated as presented in Eq. 9.
44
T= ∑ ∈ ( ) ∑ ∈ ∑ ∈ ∗ Κ ∗ I(v, , ) Eq. 9
Given that is the cost to migrate a copy of a video from the broadcaster region to transcoding region , which is the data transfer cost from one cloud site to another per GB, and Κ( ) is the size of a video with bitrate representation , the total migration cost M is calculated as presented in Eq. 10.
M=∑ ∈ ( ) ∑ ∈ ∑ ∈ ∗ Κ( ) ∗ I(v, , ) Eq. 10
Given that is the serving request cost from region , the total serving request cost R is calculated as presented in Eq. 11.
R=∑ ∈ ( )∑ ∈ ∑ ∈ ∑ ∈ ∗ Κ( ) ∗ ( ) ∗ ( , , , ) Eq. 11
The serving cost is defined as the data transfer cost from that region to the internet per GB, that varies based on cloud region and data transfer thresholds fixed by Amazon EC2, for example, Amazon EC2 charges 0.09$ for the first 9.99TB of data transferred, 0.085$ for the next 40TB, while it charges 0.05$ when exceeding 150TB of data transfer for Ohio cloud data center13. In this thesis, we suppose that the data is
transferred in chunks having the same length and different sizes that depend on the bitrate version. The overall cost C to serve viewers is shown in Eq. 12.
C=T+M+R Eq. 12
Our objective is to minimize the cost for period t as shown in Eq. 13:
( , , ) , , , C Eq. 13
Subject to the following constraints:
Every video is allocated with its original quality by default in the broadcaster closest cloud site.
I(v, , )=1 Ɐ v ∈ V(t), Ɐ ∈ QB(t), Ɐ ∈ B(t) Eq. 13a
45 if it is allocated and transcoded at region to quality
( , , , ) ≤ I(v, , )
Ɐ v ∈ V(t), Ɐ ∈ Q, Ɐ ∈ R, Ɐ ∈ R Eq. 13b
A video v can be served from region from region from region only if there exist viewers for quality at .
( , , , ) ≤ E(v, , )
Ɐ v ∈ V(t), Ɐ ∈ Q , Ɐ ∈ R, Ɐ ∈ R Eq. 13c
If there exist viewers for video v with quality at region , they can only be served with one quality from one region.
∑ ∈ ( , , , )= E(v, , ) Ɐ v ∈ V(t), Ɐ ∈ Q , Ɐ ∈ R Eq. 13d
A video can not be transcoded to a quality higher than the broadcasted quality. I(v, , ) ≤ QT Ɐ v ∈ V(t), Ɐ ∈ Q, Ɐ ∈ R Eq. 13e
The average serving request delay to serve a video v should not exceed a threshold D.
∑ ∈ ∑ ∈ ∑ ∈ ( )∗ ∗ , , ,
∑ ∈
≤ Ɐ ∈ ( ) Eq. 13f
Binary decision variables that can be set to 0 or 1.
I(v, , ), W(v, , , ) ∈ {0,1} Eq. 13g
Table 4. Notations For The Formalized Problem.
Notation Description
V(t) Set of incoming live videos at period t
R Set of regions
46
Notation Description
QB(t) Set of broadcasted bitrates for videos at period t
, , Region of video transcoding, Region of serving and Region of broadcasting
P(t) Set of viewers for live videos at period t Set of viewers at different R for video v
( ) Set of viewers for different representations for video v at region r
SU Set of storage used at each region
W(v, , , ) Binary decision variable that indicates the serving site and quality
I(v, , ) Binary decision variable that indicates the allocation, transcoding site and quality
E(v, , ) Binary variable that indicates viewers existence for a video quality
Round trip delay between and
RTT Matrix for round trip delay between the different
D Delay threshold
Κ Video size
Cloud instance cost at region
Migration cost per GB from broadcaster region Serving request cost per GB from
![Figure 1. MLP architecture [17].](https://thumb-us.123doks.com/thumbv2/123dok_us/9039106.2801712/24.918.313.595.107.369/figure-mlp-architecture.webp)