NETWORK AND DESIGN CONCEPTS FOR ACCOMMODATING LARGE TRUCKS AT ROUNDABOUTS
by
RANJIT PRASAD GODAVARTHY
B.Tech., Nagarjuna University, 2007 M.S., Kansas State University, 2010
AN ABSTRACT OF A DISSERTATION
submitted in partial fulfillment of the requirements for the degree
DOCTOR OF PHILOSOPHY
Department of Civil Engineering College of Engineering
KANSAS STATE UNIVERSITY Manhattan, Kansas
Abstract
It has been well documented that roundabouts can offer several safety and operational benefits over signalized and stop controlled intersection alternatives. However the growing use of roundabouts and their benefits could be greatly diminished because they may not be well designed for large trucks, or to accommodate oversize/overweight (OSOW) vehicles which may be essential to a state’s industry and economy. This dissertation addresses concepts to better design roundabouts for use by owners/operators of typical large trucks, and that will also accommodate OSOW vehicles where appropriate. Roundabout safety generally decreases with increased roundabout size, wider lanes and larger radii, the geometric parameters that benefit large trucks and OSOW, thus a better balance is needed.
This study accomplishes this balance by initially reviewing and incorporating those portions of the study “Accommodating Oversize Overweight Vehicles at Roundabouts” that were researched, completed and written by the author of this dissertation, and which compiled current practice, research and concerns by various U.S. states and concerns of the trucking industry, by conducting four different surveys. Then to meet these concerns expressed by survey respondents, a great number of possible accommodation, strategies and design templates were developed by using existing design software. An evaluation method was also developed.
Two additional, needed studies, not previously reported in any published literature, addressed : 1. a vertical, ground clearance analysis, and 2. a study of the use of roundabouts in urban freight networks to incorporate their inherent benefits ,such as, reducing congestion, delay and pollution.
The first analysis described above was conducted by using software with 3D analysis capabilities to check and recommend critical vertical grades and maximum dimensions for a range of large truck types and OSOW vehicle configurations. Guidelines were developed to avoid problems of low, ground clearance vehicles scraping roundabout surfaces (“hanging up”).
The second study used existing software that relates intersection types to intersection traffic flow efficiency and related pollution, on a number of routing scenarios to test the hypothesis that integration of roundabouts in these freight networks improves traffic flow, and decreases delay, congestion and pollution. The results were mixed but the procedure is sound and should be beneficial for future use by researchers and decision makers.
NETWORK AND DESIGN CONCEPTS FOR ACCOMMODATING LARGE TRUCKS AT ROUNDABOUTS
by
RANJIT PRASAD GODAVARTHY
B.Tech., Nagarjuna University, 2007 M.S., Kansas State University, 2010
A DISSERTATION
submitted in partial fulfillment of the requirements for the degree
DOCTOR OF PHILOSOPHY
Department of Civil Engineering College of Engineering
KANSAS STATE UNIVERSITY Manhattan, Kansas
2012
Approved by:
Major Professor Dr. Eugene Russell
Abstract
It has been well documented that roundabouts can offer several safety and operational benefits over signalized and stop controlled intersection alternatives. However the growing use of roundabouts and their benefits could be greatly diminished because they may not be well designed for large trucks, or to accommodate oversize/overweight (OSOW) vehicles which may be essential to a state’s industry and economy. This dissertation addresses concepts to better design roundabouts for use by owners/operators of typical large trucks, and that will also accommodate OSOW vehicles where appropriate. Roundabout safety generally decreases with increased roundabout size, wider lanes and larger radii, the geometric parameters that benefit large trucks and OSOW, thus a better balance is needed.
This study accomplishes this balance by initially reviewing and incorporating those portions of the study “Accommodating Oversize Overweight Vehicles at Roundabouts” that were researched, completed and written by the author of this dissertation, and which compiled current practice, research and concerns by various U.S. states and concerns of the trucking industry, by conducting four different surveys. Then to meet these concerns expressed by survey respondents, a great number of possible accommodation, strategies and design templates were developed by using existing design software. An evaluation method was also developed.
Two additional, needed studies, not previously reported in any published literature, addressed : 1. a vertical, ground clearance analysis, and 2. a study of the use of roundabouts in urban freight networks to incorporate their inherent benefits ,such as, reducing congestion, delay and pollution.
The first analysis described above was conducted by using software with 3D analysis capabilities to check and recommend critical vertical grades and maximum dimensions for a range of large truck types and OSOW vehicle configurations. Guidelines were developed to avoid problems of low, ground clearance vehicles scraping roundabout surfaces (“hanging up”).
The second study used existing software that relates intersection types to intersection traffic flow efficiency and related pollution, on a number of routing scenarios to test the hypothesis that integration of roundabouts in these freight networks improves traffic flow, and decreases delay, congestion and pollution. The results were mixed but the procedure is sound and should be beneficial for future use by researchers and decision makers.
v
Table of Contents
List of Figures ... x List of Tables ... xv Acknowledgements ... xviii Dedication ... xixChapter 1 - Introduction, Problem Statement, and Study Objectives ... 1
1.1 Problem Statement ... 4
1.2 Study Objectives ... 6
Chapter 2 - Literature Review ... 7
2.1 Origin of Roundabouts... 7
2.2 Roundabout Categories ... 9
2.2.1 Mini Roundabouts ... 9
2.2.2 Single- lane Roundabout ... 9
2.2.3 Multilane Roundabouts ... 10
2.3 Advantages of Roundabouts ... 12
2.3.1 Safety Features ... 12
2.4 Geometric Features ... 14
2.4.1 Inscribed Circle Diameter ... 14
2.4.2 Truck Apron ... 15
2.4.3 Design Vehicle ... 16
2.5 Trucking ... 17
2.6 Freight Transportation and Logistics ... 20
2.7 Conflicting Land Uses for Freight Transportation ... 23
2.8 Large Trucks and Roundabouts ... 23
2.9 Joint Roundabout Truck Study ... 26
2.10 Accommodating OSOW Vehicles at Roundabouts ... 30
2.10.1 Wisconsin DOT OSOW Freight Network Guidelines for Roundabouts ... 35
Chapter 3 - Surveys with 50 US States and Trucking Agencies and Guidelines to Build Statewide Freight Networks ... 37
vi
3.1 Survey 2 ... 37
3.1.1 Concerns about Roundabouts from the Companies that deal with Vehicles Requiring a Permit ... 37
3.1.2 Problems with OSOW Vehicles Navigating Roundabouts ... 38
3.1.3 Studies/Information of how OSOW Vehicles or Trucking Associations Accept Roundabouts in a State ... 39
3.1.4 Input of OSOW Companies/Organizations in Highway Design ... 40
3.1.5 State Agencies Interaction with OSOW Vehicle Owners/Operators or Trucking Association ... 41
3.1.6 Roundabouts on State or Non-State Routes on which OSOW Vehicles might be Routed ... 41
3.2 Survey 4 ... 42
3.2.1 Details of Presenting Respondents’ Answers ... 42
3.3 Summary of Survey 4 Responses ... 43
3.3.1 Are Roundabouts any more of a Problem Compared to Intersection and Other Highway Features? ... 43
3.3.2 Unique Problems with Roundabouts... 44
3.3.3 Solutions to Mitigate Problems at Roundabouts ... 44
3.3.4 Experience with Different Aspects of a Roundabout ... 49
3.3.5 Roadway through the Roundabout ... 49
3.3.6 OSOW Loads having Problems Negotiating a Roundabout ... 50
3.4 Building Statewide Freight Networks ... 52
3.4.1 Statewide Freight Plan Template ... 52
3.4.2 Western Minnesota Regional Freight Study ... 54
3.4.2.1 Summary of Recommendations Developed for the Western Minnesota Freight Study ... 54
3.4.3 Accommodating Oversize & Overweight Loads ... 58
3.4.4 Conclusions ... 59
Chapter 4 - Roundabout Designs ... 60
4.1 Urban Roundabouts ... 61
vii
4.1.1.1 Single-Lane Symmetric 3-Leg Roundabout ... 61
4.1.1.2 Single-Lane 3-Leg Roundabout at T-Intersection ... 66
4.1.1.3 Single-Lane Typical 4-Leg Roundabout ... 68
4.1.1.4 Single-Lane Symmetric 5-Leg Roundabout ... 70
4.1.2 Two-Lane Urban Roundabouts ... 73
4.1.2.1 Double-Lane, Symmetric 3-Leg Roundabout ... 73
4.1.2.2 Double-Lane 3-Leg Roundabout at T-Intersection ... 75
4.1.2.3 Double-Lane Typical 4-Leg Roundabout ... 76
4.1.3 Summary of Urban Roundabout Designs ... 77
4.2 Rural Roundabouts ... 78
4.2.1 OSOW Vehicles used for the Study ... 79
4.2.2 Single Lane Rural Roundabouts ... 80
4.2.2.1 Rural Single-Lane, Symmetric 3-Leg Roundabout ... 81
4.2.2.2 Rural Single-Lane, 3-Leg Roundabout at T-Intersection ... 88
4.2.2.3 Rural Single-Lane Typical 4-Leg Roundabout ... 90
4.2.3 Double-Lane Rural Roundabouts ... 92
4.2.3.1 Rural Double-Lane Typical Symmetric 3-Leg Roundabout ... 92
4.2.3.2 Rural Double lane 3-Leg Roundabout at T-Intersection ... 93
4.2.3.3 Rural Double-Lane, Typical 4-Leg Roundabout ... 94
4.2.4 Truck Apron Area plots for Single lane and Double – Lane Roundabouts ... 96
4.3 Testing of Check Vehicles on Kansas Roundabout Drawings ... 97
4.3.1 Wellington Roundabout ... 97
4.3.2 Garnett Roundabout ... 107
4.3.2.1 Garnett Case 1 ... 108
4.3.2.2 Garnett Case 2 ... 113
4.3.2.3 Garnett Case 3 ... 118
4.3.3 Ark City Roundabout ... 121
Chapter 5 - Vertical Ground Clearance Analysis ... 127
5.1 Background and Relevant Literature Review ... 127
5.2 Background and Analysis Strategy ... 128
viii
5.4 Procedure to Generate a 3D Simulation: ... 130
5.5 Single-Lane Roundabout Ground Clearance Analysis: ... 131
5.5.1 Illustration of a Vertical Clearance Analysis using an Example: ... 133
5.5.2 Vehicle Clearance Analysis Results of DST Lowboy at Single-Lane Roundabout: . 143 5.5.2.1 Reliability of Recommendations Provided for Symmetric Single-Lane Roundabouts: ... 148
5.6 Double-Lane Roundabout Ground Clearance Analysis: ... 149
5.6.1 Vehicle Clearance Analysis Results of DST Lowboy at Double-Lane Roundabout: 152 Chapter 6 - Integrating Roundabouts in Freight Networks ... 157
6.1 Objective of the Study and Work Procedure ... 158
6.1.1 Limitations of the Study ... 159
6.1.2 Performance Measures ... 159
6.1.2.1 Intersection Control Delay ... 159
6.1.2.2 Level of Service (LOS) ... 160
6.1.2.3 Effective Intersection Capacity ... 160
6.1.2.4 Cost ... 160
6.1.3 Manhattan (Small City) ... 163
6.1.3.1 SIDRA INTERSECTION Analysis ... 163
6.1.3.2 Example Intersection Analysis ... 164
6.1.4 Topeka (Medium City) ... 171
6.1.4.1 Intersection Analysis Results ... 171
6.1.5 Overland Park (Big City) ... 171
6.1.5.1 Intersection Analysis Results ... 172
6.2 Statistical Analysis for Testing Various Performance Measures for Signalized and Roundabout Intersection Treatment in Urban Freight Networks: Randomized Complete Block Design ... 173
6.3 Results ... 176
Chapter 7 - Summary and Conclusions ... 179
7.1 Survey Results with US State Officials ... 179
7.2 Survey Results with OSOW Haulers ... 180
ix
7.4 Roundabout Designs ... 181
7.4.1 Urban Roundabouts ... 181
7.4.2 Rural Roundabouts ... 183
7.4.3 Straight Passage through the Roundabouts ... 184
7.4 Ground Clearance Analysis ... 185
7.5 Integrating Roundabouts in Urban Freight Networks ... 186
7.6 Conclusions ... 187
7.7 Recommendations ... 189
References ... 191
Appendix A - Dimensions and Turning Path Requirements of Design Vehicles ... 194
Appendix B - Survey 2 and Survey 4 Questions Used for the Study ... 196
Appendix C - Concerns about Roundabouts from Companies that deal with a Vehicle Requiring a Permit, i.e Oversize/Overweight (OSOW) Vehicles ... 200
Appendix D - Input of OSOW Companies into Roundabout Design ... 203
Appendix E - When planning or designing roundabouts, are OSOW routes taken into consideration? ... 204
x
List of Figures
Figure 1.1: Pictures of Oversize/Overweight Vehicles ... 2
Figure 2.1: Key Roundabout Characteristics ... 7
Figure 2.2: Features of Typical Mini-Roundabout ... 9
Figure 2.3: Features of Typical Single-Lane Roundabout ... 10
Figure 2.4: Features of Two-Lane Roundabout ... 11
Figure 2.5: Features of Three-Lane Roundabout ... 11
Figure 2.6: Swept Path Analysis of WB-67 Vehicle for Different Diameters ... 17
Figure 2.7: U.S. Freight Expenditures by Mode (in billions of 2000 US$) ... 18
Figure 2.8: FHWA Truck Classifications ... 19
Figure 2.9: Relationship between Cost and Modal Service Associated with various available Freight Transportation Modes ... 20
Figure 2.10: Trend in Average Length of Haul by Mode ... 21
Figure 2.11: Trucks used for Last Mile and Line Haul Operations ... 22
Figure 2.12: Treatments for Accommodating Truck Right Turns ... 25
Figure 2.13: Example Layouts of Case 1, Case 2, and Case 3 Roundabouts ... 27
Figure 3.1 Summary of the Question "Are Roundabouts any more of a Problem compared with Other Intersections?”... 44
Figure 3.2 Summary of the Question "Are Roundabouts any more of a Problem than Highway Features which may be of a Concern to Oversize/Overweight Loads such as Narrow Bridges, Wires, Curbs, Ramps, and so Forth?"... 44
Figure 3.3 Summary of OSOW Haulers Responses to the Question "How Beneficial Would it be if Loads Could go Straight Through a Roundabout, if Removable Barrier is in Place to Prevent Other Vehicles from Doing So?" ... 50
Figure 3.4 Summary of OSOW Haulers Response to the Question "How Beneficial Would it be if Loads Could go Straight Through a Roundabout, if the Pathway Would be Offset so the Entrance Would Line Up With the Left Approach (Where the Driver Would Have to Move to the Left Lane on the Approach)?” ... 50
xi
Figure 3.5: Summary of OSOW Haulers Response to the Question, “Do you Remove and Replace Highway Signs, or any other Highway Feature you Consider an Obstacle, and Replace them after Passing?” ... 51 Figure 3.6: Summary of OSOW Haulers Response to the Question, “Are there Places where you
are Permitted to Hold Traffic and Travel in the Wrong Direction to Continue toward your Destination? ... 51 Figure 3.7: Tiered truck Roadway Network for Northern Minnesota & Western Wisconsin and
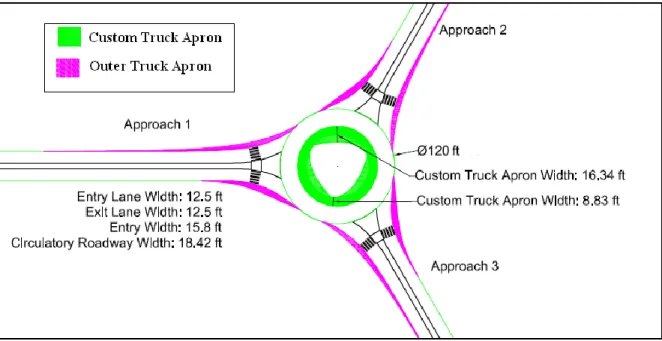
Western Minnesota ... 55 Figure 3.8: Super Haul Corridor in Minnesota ... 57 Figure 3.9: Primary/Alternative OS/OW Routes in Texas ... 58 Figure 4.1: Single-Lane 3-leg Symmetric Roundabout with 120ft ICD and 9.36ft Center Island
Truck Apron ... 62 Figure 4.2: Understanding a AutoTURN Vehicle Simulation ... 63 Figure 4.3: Example Right Turn and Left Turn Simulations of the Design Vehicle, WB-50 ... 64 Figure 4.4: Example Right Turn and Left Turn Simulation of WB-67 and Developing External
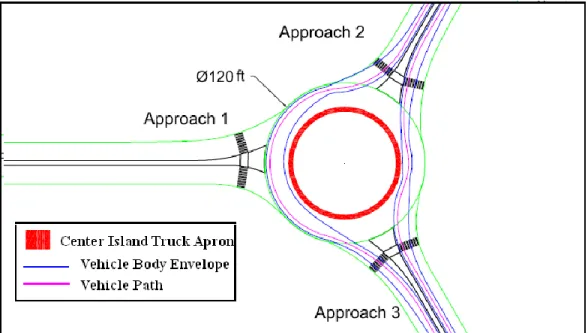
Truck Apron and Custom Center Island Truck Apron ... 65 Figure 4.5: Final Modified Design of Single-Lane Symmetric 3-Leg Roundabout ... 66 Figure 4.6: Single-Lane 3-leg Roundabout at T-intersection with 120ft ICD and 9.36ft Center
Island Truck Apron ... 67 Figure 4.7: Designs Generated to Accommodate WB-67 at Single-Lane 3-leg Roundabout at
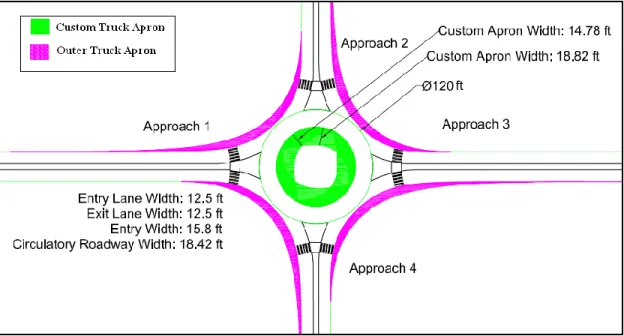
T-Intersection ... 68 Figure 4.8: Final Modified Design of Single-Lane 3-Leg Roundabout at T-Intersection ... 68 Figure 4.9: Single-Lane 4-leg Symmetric Roundabout with 120ft ICD and 9.36ft Center Island
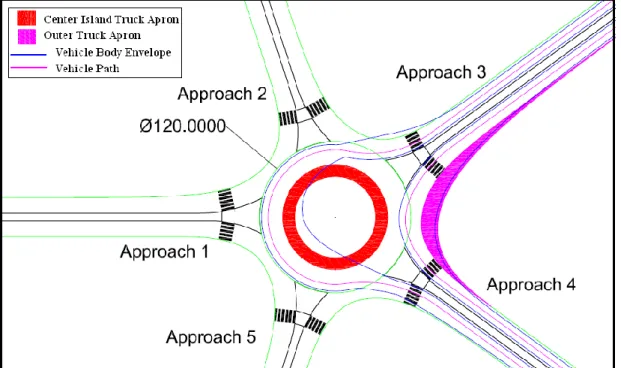
Truck Apron ... 69 Figure 4.10: Final Modified Design of Single-Lane 4-Leg Symmetric Roundabout ... 70 Figure 4.11: Single-Lane 5-leg Symmetric Roundabout with 120ft ICD and 9.36ft Center Island
Truck Apron ... 71 Figure 4.12: Example Right Turn Simulation, Through Simulation, and Left Turn Simulations of
WB-50 at the Single-Lane 5-leg Symmetric Roundabout ... 71 Figure 4.13: Example Right Turn and Left Turn Simulation of WB-67 at Single-Lane 5-Leg
xii
Figure 4.14: Final Modified Design of Single-Lane 5-Leg Symmetric Roundabout ... 73
Figure 4.15: Double-Lane Symmetric 3-leg Roundabout with 200ft ICD and 5.27 ft Center Island Truck Apron ... 74
Figure 4.16: Example Right Turn and Left Turn Simulation of WB-67 at Double-Lane Symmetric 3-Leg Roundabout ... 75
Figure 4.17: Final Design of Double-Lane Symmetric 3-Leg Roundabout ... 75
Figure 4.18: Double-Lane 3-Leg Roundabout at T-Intersection with 220 ft ICD and 5.27 ft Truck Apron ... 76
Figure 4.19: Double-Lane 4-Leg Symmetric Roundabout with 220 ft ICD and 5.27 ft Truck Apron ... 77
Figure 4.20: Six OSOW check vehicles from Wisconsin Department of Transportation ... 80
Figure 4.21: Understanding a AutoTURN OSOW Check Vehicle Simulation in this Study... 81
Figure 4.22: Steps Followed for Modifying the Geometry of Single-Lane Typical Symmetric 3-leg Roundabout for OSOW Check Vehicles ... 83
Figure 4.23: ODT, and ODT & FTCI Method of Accommodating OSOW Movements ... 87
Figure 4.24: Designs for Single-Lane 3-leg Roundabout at T-Intersection... 89
Figure 4.25: Designs for Single-Lane Typical 4-Leg Roundabout... 91
Figure 4.26: Designs for a Double-Lane Typical Symmetric 3-leg Roundabout ... 93
Figure 4.27: Designs for Double-Lane Typical 4-leg Roundabout for T-Intersection ... 95
Figure 4.29: Truck Apron Area Data Plot for Single-Lane Roundabouts ... 96
Figure 4.30: Truck Apron Area Data Plot for Double-Lane Roundabouts ... 96
Figure 4.30: The Wellington Roundabout with Four Approaches ... 98
Figure 4.31: Right Turn Simulation of a 55 Meter Wind Blade from Approach 1 ... 101
Figure 4.32: Wellington Roundabout Showing all Possible Vehicle Simulations for all Approaches. ... 102
Figure 4.33: Extra Traversable Area/Truck Apron Required for Wellington Roundabout ... 103
Figure 4.34: Extra Traversable Area Required and Removable Sign Area for Wellington Roundabout ... 104
Figure 4.35: All Possible Vehicle Simulations for all the Approaches for Wellington Roundabout ... 105
xiii
Figure 4.36: Extra Traversable Area and Removable Sign area Required for Wellington
Roundabout ... 106
Figure 4.37: Garnett Roundabout with three Approaches ... 107
Figure 4.38: Garnett Roundabout Showing all Critical Vehicle Simulations for all Approaches ... 109
Figure 4.39: Extra Traversable Area/Truck Apron Required for Garnett Roundabout ... 110
Figure 4.40: Removable Sign Area Required for Garnett Roundabout ... 111
Figure 4.41: Extra Traversable Area and Removable Sign Area Required for Garnett Roundabout ... 112
Figure 4.42: Garnett Roundabout Showing all Critical Vehicle Simulations for all the Approaches ... 114
Figure 4.43: Extra Traversable Area/Truck Apron Required for Garnett Roundabout ... 115
Figure 4.44: Removable Sign Area Required for Garnett Roundabout ... 116
Figure 4.45: Extra Traversable Area and Removable Sign Area Required for Garnett Roundabout ... 117
Figure 4.46: Extra Traversable Area/Truck Apron Required for Garnett Roundabout ... 119
Figure 4.47: Extra Traversable Area and Removable Sign Area Required for Garnett Roundabout ... 120
Figure 4.48: Ark City Roundabout with four Approaches ... 121
Figure 4.49: Ark City Roundabout showing all Critical Vehicle Simulations for all the Approaches ... 123
Figure 4.50: Extra Traversable Area/Truck Apron Required for Ark City Roundabout ... 124
Figure 4.51: Removable Sign Area Required for Ark City Roundabout ... 125
Figure 4.52: Extra Traversable Area and Removable Sign Area required for Garnett Roundabout ... 126
Figure 5.1: DST Lowboy Vehicle from Wisconsin DOT Library ... 130
Figure 5.2: DST Lowboy 2 Part 1 Vehicle from Wisconsin DOT Library ... 130
Figure 5.3: Symmetric Single-Lane Roundabouts Generated by TORUS Software ... 131
Figure 5.4: Example Illustration of Grading for the Symmetric Single-Lane Roundabout... 133
Figure 5.5: Two Dimensional Left and Through Movement Simulation of DST Lowboy at the Single-Lane Roundabout ... 134
xiv
Figure 5.6: Three Dimensional Simulation of DST Lowboy 2 Part 1 Vehicle at the Single-Lane
Roundabout ... 136
Figure 5.7: Vehicle Clearance Analysis along the Analysis Line ‘Vehicle Centerline Path’ ... 138
Figure 5.8: Vehicle Clearance Analysis along the Analysis Line ‘Center of Rear Axle Group’ 139 Figure 5.9: Vehicle Clearance Analysis along the Analysis Line ‘Center of Swept Path’ ... 140
Figure 5.10: Vehicle Clearance Analysis along the Analysis Line ‘Left Side of Swept Path’... 141
Figure 5.11: Vehicle Clearance Analysis along the Analysis Line ‘Right Side of Swept Path’ 142 Figure 5.12: Symmetric Double-Lane Roundabouts Generated by TORUS Software ... 150
Figure 5.13: Two Dimensional Left and Through Movement Simulation of DST Lowboy at the Double-Lane Roundabout ... 151
Figure 6.1: HCM Method of Level of Service Based on Vehicle Delay ... 160
Figure 6.2: Map showing Overland Park Truck Routes and Intersections Selected for the Study ... 162
Figure 6.3: SIDRA INTERSECTIONS Working Interface ... 164
Figure 6.4: McCall Road & Hays Drive Intersection from Google Maps and Geometry Generated from SIDRA INTERSECTIONS ... 165
Figure 6.5: Intersection Traffic Counts and Truck Percentages for McCall Road & Hays Drive ... 166
Figure 6.6: Signalized Intersection Geometry and Roundabout Geometry at the Intersection McCall Road & Hays Drive Generated using SIDRA INTERSECTION ... 168
Figure 6.7: Randomized Complete Block Design Layout for Manhattan Intersections ... 174
Figure 6.8: Randomized Complete Block Design Layout for Topeka Intersections ... 174
xv
List of Tables
Table 2.1: Key Roundabout Features... 8
Table 2.2: Design Characteristics of three Roundabout Categories ... 12
Table 2.3: Crash Reduction by Implementing a Roundabout ... 13
Table 2.4: Mean Crash Reduction in various Countries ... 14
Table 2.5: Inscribed Circle Diameter Ranges for different Categories of Roundabouts ... 15
Table 2.6: Observed Design Characteristics of 18 Study Roundabouts ... 28
Table 2.7: Apron Width Range and Average by Roundabout Case Type ... 28
Table 2.8: Typical Design Parameters for Two-Lane Roundabouts ... 29
Table 2.9: Sector of Trucking Industry Being Operated... 34
Table 2.10: Carrier type that Best Describes the Company ... 34
Table 2.11: Type of Commodity Drivers or Contractors Typically Haul... 35
Table 3.1 Comments for the Question "Are Roundabouts any more of a Problem Compared with Other Intersections?”... 45
Table 3.2 Comments for the Question "Are Roundabouts any more of a Problem than Highway Features which may be of a Concern to Oversize/Overweight Loads such as Narrow Bridges, Wires, Curbs, Ramps, and so Forth?"... 46
Table 3.3 Summary of Responses for the Question “Do you have any Unique Problems with Roundabouts, and if so, please Explain?” ... 47
Table 3.4 Summary of Responses for the Question “If Answer to Q 15 and/or 16 is "yes", what Possible Solutions you think Might Mitigate Problem(s) without Compromising their Safety Benefits to Passenger Vehicles, or Requiring Excessive Right of Way and Cost" ... 48
Table 3.5 Respondents Experience with Different Aspects of a Roundabout ... 49
Table 4.1: Summary of Designs Developed for Urban Roundabout Setting ... 78
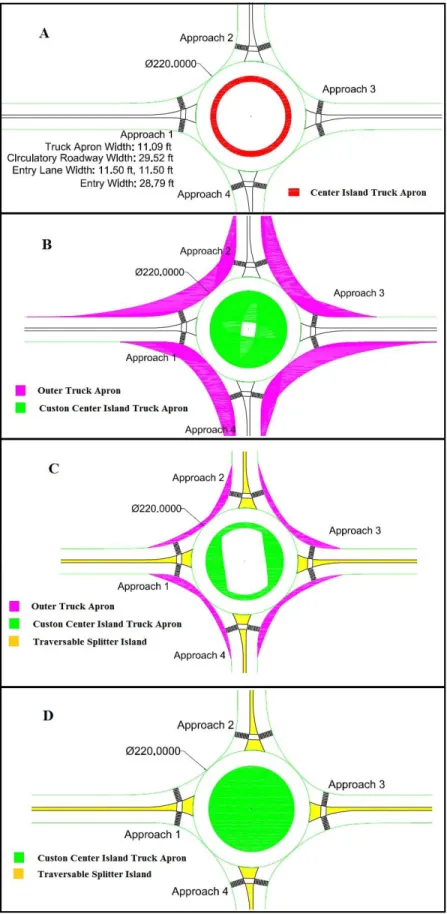
Table 4.2: Center Island Truck Apron Area, Outer Truck Apron Area, and Total Truck Apron area for Roundabouts Designed for Accommodating 6 OSOW Check Vehicles. ... 84
xvi
Table 5.1: Ground Clearance of the DST Lowboy Vehicle at Various Grades of Symmetric Single-Lane Roundabout with 3-inch Truck Apron Height and Approach Roadway Sloping towards the Roundabout ... 144 Table 5.2: Ground Clearance of the DST Lowboy Vehicle at Various Grades of Symmetric
Single-Lane Roundabout with 3-inch Truck Apron Height and Approach Roadway Sloping away from the Roundabout ... 145 Table 5.3: Ground Clearance of the DST Lowboy Vehicle at Various Grades of Symmetric
Single-Lane Roundabout with 2-inch Truck Apron Height and Approach Roadway Sloping towards the Roundabout ... 146 Table 5.4: Ground Clearance of the DST Lowboy Vehicle at Various Grades of Symmetric
Single-Lane Roundabout with 2-inch Truck Apron Height and Approach Roadway Sloping away from the Roundabout ... 147 Table 5.5: Ground Clearance of the DST Lowboy Vehicle at Various Grades of Symmetric
Double-Lane Roundabout with 4-inch Truck Apron Height and Approach Roadway Sloping towards the Roundabout ... 153 Table 5.6: Ground Clearance of the DST Lowboy Vehicle at Various Grades of Symmetric
Double-Lane Roundabout with 4-inch Truck Apron Height and Approach Roadway Sloping away from the Roundabout ... 154 Table 5.7: Ground Clearance of the DST Lowboy Vehicle at Various Grades of Symmetric
Double-Lane Roundabout with 3-inch Truck Apron Height and Approach Roadway Sloping towards the Roundabout ... 155 Table 5.8: Ground Clearance of the DST Lowboy Vehicle at Various Grades of Symmetric
Double-Lane Roundabout with 3-inch Truck Apron Height and Approach Roadway Sloping away from the Roundabout ... 156 Table 6.1: Performance Measures of Selected Intersections in Manhattan for Signalized and
Roundabout Treatment Generated using SIDRA INTERSECTIONS ... 169 Table 6.2: Performance Measures of Selected Intersections in Topeka for Signalized and
Roundabout Treatment Generated using SIDRA INTERSECTIONS ... 169 Table 6.3: Performance Measures of Selected Intersections in Overland Park for Signalized and
Roundabout Treatment Generated using SIDRA INTERSECTIONS ... 170 Table 6.4: Randomized Complete Block Design Results for Manhattan Intersections ... 177
xvii
Table 6.5: Randomized Complete Block Design Results for Topeka Intersections ... 177
Table 6.6: Randomized Complete Block Design Results for Overland Park Intersections... 178
Table 7.1: Summary of Designs Developed for Urban Roundabout Setting ... 182
xviii
Acknowledgements
I would like to convey my deepest gratitude to my major professor and mentor Dr. Eugene Russell for continuously inspiring and encouraging me in my research and academic career and for honing me as a successful transportation engineering professional.
I would also like to take this opportunity to thank my academic advisor Dr. Sunanda Dissanayake, and Dr. Robert Stokes, Dr. Margaret Rys, and Dr. Larry Weaver for serving as my PhD committee members.
A special thanks to one of my best friends Nirupama Mrinalini Meesala for continuously motivating me throughout my degree and helped me to build confidence in hard times.
I would like to acknowledge the continuous support and help of my friends Nithin Katireddy, Marrapu Surya, Vijay Varma Indukuri, Nitya Jangam, Freya Christina, Naveena Bellam, and Satish Achanta.
This dissertation wouldn’t be possible without the love and support of my father Dr. Benzimen Franklin, my mother Manorama, my brother Avinash, my sister Deepa, and my brother-in-law Nissy Praveen.
xix
Dedication
I would like to dedicate this doctoral dissertation to my grandmother Leelavathi who always wanted to see me as a successful Civil Engineer.
1
Chapter 1 - Introduction, Problem Statement, and Study
Objectives
Roundabouts can offer several advantages over signalized and stop controlled
intersection alternatives, including better overall safety performance, greatly reduced intersection injury crashes and fatalities, lower delays, shorter queues, better management of speed and opportunities for community enhancement (1). The safety and traffic operational benefits of roundabouts for the typical vehicle fleet (automobiles. and small trucks) have been well
documented and are presented in Chapter 2. Although roundabouts have been in widespread use in other countries for many years, their general use in the United States (US) began only in the recent past (1990 is generally accepted as the year the firstmodern roundabouts were built in the US), but their use is growing at an ever increasing rate (1). In some cases roundabouts can avoid or delay the need for expensive widening of an intersection approach that would be necessary for signalization.
However the growing potential use of roundabouts with all their benefits could be greatly diminished because they may not be well designed for large trucks or to accommodate
oversize/overweight vehicles. For example, due to complaints from truckers, legislation was introduced in the state legislature in Oregon restricting roundabouts, leading to the Oregon Department of Transportation to impose a moratorium on designing and building roundabouts in the state (2).
Figure 1.1 shows some pictures of oversize/overweight vehicles. The design vehicle for a roundabout, as in any design, should be the largest vehicle that can reasonably be anticipated for normal use. Better guidelines for determining where and what vehicle size should be designed are needed, particularly on routes used by large trucks. Also, Oversize Overweight vehicles (OSOW) are vehicles that use the roadway by special permit and travel on a random basis. They may be essential to a state’s industry and economy but may need special designs or
accommodations at roundabouts on designated routes. Their physical characteristics and turning requirements, which may be unique to certain types of loads, usually exceed the dimensions given for standard, recommended design vehicles recommended in “A Policy on Geometric Design of Highways and Streets”, commonly known as “The Green Book”, the book of standards followed by all states (3). There is also a question of policy regarding which
2
roundabouts in a state need to accommodate what type of OSOW, leading to a need for planning designated networks.
Figure 1.1: Pictures of Oversize/Overweight Vehicles
3
In the US, trucks carry a share of 60 percent of freight volume and 67 percent of freight value according to the Office of Freight Management and Operations (HOFM) and the Freight Analysis Framework (FAF) (5). It is also estimated by the HOFM's Freight Analysis, Framework (FAF), that the freight tonnage will increase by 48 percent between 2002 and 2035 and shows truck Vehicle Miles Travelled (VMT) growing faster than the automobile VMT. This projected increase in freight truck tonnage, without increased capacity and operation changes, will amount to an increase in congestion. Congestion increases travel time and costs, and leads to a less reliable pickup and delivery time for truck operators. This congestion increases the cost of transportation, which over time is passed along to customers, as well as having negative impacts on urban areas and their environments, such as increased pollution. It is estimated by FHWA that increase in travel time costs shippers and carriers an additional $25 to $200 per hour depending on the product. Pollution can decrease an areas quality of life (5).
An FHWA report, Traffic Congestion and Reliability: Trends and Advanced Strategies for Congestion Mitigation (6), has estimated about 40 percent of traffic congestion in general, as opposed to freight congestion specifically, is caused by bottlenecks, resulting in stop-and-go traffic flow and long backups. Bottlenecks on highways that serve high volumes of trucks are “freight bottlenecks" (7). A recent study conducted by FHWA, An Initial Assessment of Freight Bottlenecks on Highways (7) have shown that freight bottlenecks cause upwards of 243 million truck hours of delay and the direct user cost from this delay is about $7.8 billion per year. It is also observed that highway interchange bottlenecks accounted for more than 50 percent of the delay, or about 124 million hours of delay (7). Simultaneously, signalized, arterial intersections account for a total of 18 percent of the delay, or about 43 million hours of delay, for different freight routes comprised of urban freight corridors, intercity freight corridors, truck access routes and intermodal connectors (7).
There are also air pollution concerns from heavy congestion in urban areas. According to the 2009 Freight Fact and Figures - Office of Freight Management and Operations Report (8), diesel-fueled, heavy trucks emit small amounts of carbon monoxide (CO) but large amounts of nitrogen oxides (NOx) when compared to gasoline-fueled cars affecting the air quality. Freight transportation contributes 27 percent of the total NOx emissions and one-third of emissions of particulate matter 10 microns in diameter (PM-10) from mobile sources in the US. Among various modes of transportation in the freight sector, like heavy-duty trucks, freight rail,
4
commercial marine, and air freight, heavy-duty trucks contribute a two-thirds share of the NOx emissions from the freight sector (8).
Apart from the above emissions, the transportation sector releases large quantities of greenhouse gases (GHGs) such as carbon dioxide (CO2), methane, nitrous oxide, and hydro fluorocarbons and these gases trap heat in the atmosphere which affects the earth’s temperature (8). Therefore, the increase in the congestion of the trucks at urban intersections can affect the quality of air by emissions which can be mitigated by better traffic flow techniques such as less delay at urban intersections (8).
The above challenges clearly show that there is a need for improving traffic flow at interchanges, intersections and other transportation facilities to better accommodate vehicles and trucks with less congestion, thus decreasing the overall delay time and saving many dollars.
The National Cooperative Highway Research Program (NCHRP) report, Synthesis 320 Integrating Freight Facilities and Operations with Community Goals has studied the issues and concerns of the growing amount of freight traffic during freight operations (9). It has been concluded that balancing freight transportation facilities and operations with community goals can be complex and there is "no one size fits all" solution. However, the report concludes that solutions have to be developed through a common understanding of issues, working together to craft the solutions, and continuously checking to see if the solution remains effective (9).
1.1 Problem Statement
Most US roundabouts are intentionally designed to operate at slow speeds by using narrow curb to curb widths and relatively tight turning radii. However, if the design geometrics are too restrictive, roundabout use by OSOW vehicles, and in some cases even typical, large trucks, commonly called tractor-trailers, “semis” or “18-wheelers”, may be difficult or even impossible. In some cases in the US this has led to opposition to roundabouts by the trucking industry and to the possibility of lobbying their state legislatures for laws detrimental to
roundabout use, as occurred in Oregon (2). There is a pressing need to address and mitigate their concerns in order to not diminish the growth of roundabouts and thus their safety and operational benefits to other vehicles and the general traveling public. Therefore, the central issue is how to design roundabouts that are not difficult to use by typical large trucks and also accommodate OSOW vehicles where appropriate. They need to be accommodated on designated routes,
5
networks or certain areas where their transport is necessary, without sacrificing the safety and operational efficiency of the roundabouts, which generally decreases with increased roundabout size, wider lanes and longer radii. Thus there are safety, cost and other benefits in keeping roundabouts small but still capable of being acceptable to truckers and able to accommodate OSOW vehicles as appropriate to their essential travel. OSOW are generally routed around roadway restrictions such as certain bridges, narrow roadways, etc.; however, with the popularity of roundabouts and the benefits they provide, such routing could become more difficult and could potentially lead to reduced or prohibited roundabout use if OSOW cannot be accommodated.
With the rapid increase in construction of roundabouts in and around urban areas in the US there are many instances where these roundabouts impact freight movement routes.
Roundabouts in the US have proven to have many advantages (1). Among the many advantages roundabouts have is less delay and decreased congestion which should help freight flows, thereby saving many dollars while reducing delay and negative environmental impacts such as air pollution. Roundabouts, as a part of freight networks, should be able to better handle the increasing freight demand, and reduce congestion and negative environmental issues and concerns in and around urban communities.
There have been no published studies in the area of optimizing the use of roundabouts to incorporate their inherent benefits into freight networks to better serve trucking and community needs, i.e. reducing congestion, delay, pollution and other negative impacts while
6
1.2 Study Objectives
The objectives of the study included:
1. Compile current practice and research by various US states related to the effects that OSOW have on roundabout location, design, and accommodation. This will be achieved by participating in developing, and then analyzing surveys to 50 US State agencies, and OSOW haulers, concurrently conducted for the study “Accommodating
Oversize/Overweight Vehicles at Roundabouts” (2).
2. Investigate strategies, recommendations and guidelines to build statewide freight networks for large trucks and necessary OSOW needs, and recommend state policy. 3. Build designs for typical roundabout intersection types to accommodate all reported types
of large trucks and representative OSOW configurations/combinations which may need to be accommodated.
4. Perform 3-D vehicle simulations and develop guidelines for a vertical ground clearance analysis, by adapting 3-D swept path analysis software and recommending maximum vertical dimensions for roundabout geometric features.
5. Investigate integrating the greater use of roundabouts in freight networks in and around urban areas to optimize goods movement while decreasing air pollution due to trucks in and around the communities.
7
Chapter 2 - Literature Review
2.1 Origin of Roundabouts
Use of traffic circles in the US started from 1905 when William Phelps Eno designed the Columbus Circle in New York City (1). These traffic circles gave priority to entering vehicles leading to high speed entries. However, due to high crash experience and congestion in the circles, they became out of favor in the US after the mid-1950s (1).
The United Kingdom developed the concept of modern roundabouts to address the problems with traffic circles by adapting a rule that for all circular intersections, the entering traffic should give the way, yield, to the circulating traffic. It was observed that these changes improved the operational and safety characteristics of the circular intersections and thereafter, many countries then adapted what can be now referred to as a modernroundabout, as a
common intersection form. Figure 2.1 shows the key characteristics of a typical roundabout and Table 2.1 describes the key roundabout features (1).
Figure 2.1: Key Roundabout Characteristics
8
Table 2.1: Key Roundabout Features
Feature Description
Central island The central island is the raised area in the center of a roundabout around which traffic circulates. The central island does not necessarily need to be circular in shape. In the case of mini-roundabouts the central island is traversable.
Splitter island A splitter island is a raised or painted area on an approach used to separate entering from exiting traffic, deflect and slow entering traffic, and allow pedestrians to cross the road in two stages. Circulatory roadway The circulatory roadway is the curved path used by vehicles to travel in a counterclockwise fashion around the central island.
Circulatory Roadway
The circulatory roadway is the curved path used by vehicles to travel in a counterclockwise fashion around the central island.
Apron An apron is the traversable portion of the central island adjacent to the circulatory roadway that may be needed to accommodate the wheel tracking of large vehicles. An apron is sometimes provided on the outside of the circulatory roadway.
Entrance line The entrance line marks the point of entry into the circulatory roadway. This line is
physically an extension of the circulatory roadway edge line but functions as a yield or give-way line in the absence of a separate yield line. Entering vehicles must yield to any
circulating traffic coming from the left before crossing this line into the circulatory roadway. Accessible
pedestrian crossings
For roundabouts designed with pedestrian pathways, the crossing location is typically set back from the entrance line, and the splitter island is typically cut to allow pedestrians, wheelchairs, strollers, and bicycles to pass through. The pedestrian crossings must be accessible with detectable warnings and appropriate slopes in accordance with ADA requirements.
Landscape strip Landscape strips separate vehicular and pedestrian traffic and assist with guiding pedestrians to the designated crossing locations. This feature is particularly important as a way finding cue for individuals who are visually impaired. Landscape strips can also significantly improve the aesthetics of the intersection.
9
2.2 Roundabout Categories
Roundabouts can be categorized into three basic types based on the size and number of lanes (1). They are discussed below.
2.2.1 Mini Roundabouts
These are small roundabouts with fully traversable center island, commonly used in low speed urban environments with an average operating speed of 30 mph or less in Europe (1). A fully traversable center island helps in better accommodating larger vehicles at a
mini-roundabout and therefore they are mostly recommended when a traditional single-lane
roundabout has insufficient right of way to accommodate the design vehicle. However, the mini-roundabout is designed in such a way that the passenger cars generally do not traverse over the center island (1). To date, their use has not caught on in the US.
Figure 2.2: Features of Typical Mini-Roundabout
Source: Roundabouts: An Informational Guide, Second Edition (1)
2.2.2 Single- lane Roundabout
This type of roundabout has a single-lane entry for all the legs and one circulating lane. Their geometric design typically includes features such as a raised splitter island, a
10
circle diameter when compared to mini-roundabouts. However, the size of the roundabout is largely influenced by the design vehicle and right of way constraints (1).
Figure 2.3 shows the features of a typical single-lane roundabout.
Figure 2.3: Features of Typical Single-Lane Roundabout
Source: Roundabouts: An Informational Guide, Second Edition (1)
2.2.3 Multilane Roundabouts
This type of roundabout has at least one entry with two or more lanes and in some cases they might have different number of lanes on one or more approaches (1). The geometric design typically includes a raised splitter islands, a truck apron, a non-traversable center island, and appropriate entry path deflection. These types of roundabouts have wider circulatory roadways, so that more than one vehicle can travel side by side. The speed of the vehicles at the entry, on the circulatory roadway, and at the exit, are generally similar or may be slightly higher than the single-lane roundabouts (1).
Figure 2.4 shows the features of a typical two-lane roundabout and Figure 2.5 shows the features of a three-lane roundabout. Table 2.2 shows the summary of design and operational elements for each of these three roundabout categories.
11
Figure 2.4: Features of Two-Lane Roundabout
Source: Roundabouts: An Informational Guide, Second Edition (1)
Figure 2.5: Features of Three-Lane Roundabout
12
Table 2.2: Design Characteristics of three Roundabout Categories
Source: Roundabouts: An Informational Guide, Second Edition (1)
2.3 Advantages of Roundabouts
2.3.1 Safety Features
NCHRP Report 572, Roundabouts in the United States conducted a before-after safety study by considering 55 locations that used to have different previous intersection treatments such as two-way stop, all way stop, or signal control and are changed to a roundabout treatment (10). On a whole, it was observed that there was a 35% reduction in total crashes and 76% reduction in injury crashes by converting the intersection treatment (signalized, all-way stop, or two-way stop) to a roundabout (10).
Table 2.3 shows the percentage crash reduction obtained for both total and injury
accidents, categorized by intersection control, type of setting and number of lanes (10). Table 2.4 presents a comparison of mean crash reduction for various countries which shows that
roundabouts are safer than comparable intersection alternatives (1). It was observed that converting intersections with signals and two-way stop control to roundabout has produced significant safety benefits, and especially for injury accidents (10).
Roundabouts generally operate with lower delays, less stopping and less idling, when compared to other intersection forms when operating within their capacity (1, 11). Therefore,
13
with the reduction of vehicle delays, roundabouts can provide environmental benefits. Though there may be heavy volumes of vehicles, they continue to move slowly rather than completely stopping, and therefore, noise and air quality impacts are reduced (1). Mandavilli et al. have studied the impact of modern roundabouts in decreasing the vehicular emissions at four sites in Kansas where modern roundabout had replaced a stop controlled intersection (12). Analyzing four measures of effectiveness, i.e., emissions of HC, CO, NOx, and CO2, at roundabouts vs other intersection control, it was found that the modern roundabout performed better than the stop controlled intersections (12). A 38%-45% decrease in CO emissions (in Kg/hr) was
observed with the installation of a roundabout for AM and PM periods. A 55%-61% decrease in CO2 emissions (in Kg/hr) was observed with the installation of a roundabout for AM and PM periods. A 44%-51% decrease in NOx emissions (in Kg/hr) was observed with the installation of a roundabout for AM and PM periods. A 62%-68% decrease in HC emissions (in Kg/hr) was observed with the installation of a roundabout for AM and PM periods (12).
Table 2.3: Crash Reduction by Implementing a Roundabout
14
Table 2.4: Mean Crash Reduction in various Countries
Source: Roundabouts: An Informational Guide, Second Edition (1)
2.4 Geometric Features
2.4.1 Inscribed Circle Diameter
The Inscribed Circle Diameter (ICD) is the distance across the circle that is inscribed by the outer curbs and is the sum of center island diameter and twice the circulatory roadway width (1). The ICD design is based on an iterative process and is based upon design objectives such as accommodating the design vehicle and providing speed control (1).
For a single-lane roundabout the turning requirements of a design vehicle plays a prominent role in deciding the size of the ICD. To accommodate an AASHTO designated WB-50 design vehicle, at least a 105 ft. inscribed circle diameter is needed, and to accommodate a WB-67 design vehicle, a larger inscribed circle diameter, in the range 130 to 150 ft., will be required. The dimensions and turning path requirements for different common highway vehicles can be found in the Appendix A.
For a multilane roundabout, the size of the roundabout is based on balancing the need to achieve deflection, speed control and good alignment for normal small vehicles. The inscribed circle diameter of a multilane roundabout ranges from 150 to 250 ft. Table 2.5 shows the inscribed circle diameter ranges for different categories of roundabouts. These inscribed circle diameter ranges have to be considered an initial selection as modifications are often necessary based on the context of the location (1).
15
Table 2.5: Inscribed Circle Diameter Ranges for different Categories of Roundabouts
Source: Roundabouts: An Informational Guide, Second Edition (1)
2.4.2 Truck Apron
A truck apron is usually provided within the center island on the outer edge to keep the inscribed circle diameter reasonably small, while providing additional paved area to
accommodate off-tracking of the rear wheels of larger design vehicles while maintaining the deflection for smaller vehicles (1). Roundabouts truck aprons should be designed in such a way that they are traversable by trucks but discourage passenger vehicles from using them, usually by being elevated. Therefore the outer edge of the truck apron should by approximately 2 to 3 in. above the surface of circulatory roadway (1). The actual height and curb type is somewhat controversial and there is currently no consensus among designers or in states’ guidelines (this will be covered in detail in later sections).
The swept path of the design vehicle dictates the clearance needed (1). Swept path is the calculation and analysis of the movement and path of different parts of the vehicle as it
maneuvers a turning movement (13).The wheel paths of the design vehicle dictates the width of the truck apron which typically varies from 3 to 15 ft. wide with a cross slope of 1% to 2% away from the center island (1). Computer Aided Design (CAD) based vehicle turning, simulation software, is generally used to simulate a tracking template of the design vehicle in order to decide upon the minimum truck apron width needed. A truck apron should be constructed with material which is visually different from the circulatory roadway and sidewalks so that they can be easily differentiated, and also, so pedestrians are not encouraged to cross the circulatory
16
roadway thinking it is a sidewalk. It can be understood from Figure 2.6 that roundabouts with a smaller inscribed circle diameter requires a wider truck apron to accommodate a left-turning vehicle (1).
2.4.3 Design Vehicle
The largest vehicle that is likely to regularly use the intersection is termed the ‘design vehicle’, and the accommodation of this vehicle at the intersection dictates many of the
roundabouts' dimensions (1). Roundabouts are intentionally designed to slow traffic by different techniques such as narrow curb-to-curb widths and relatively tight turning radii, and this concept could create difficulties for large vehicles if they are not considered during the design
process(1).
The approaching roadway type and surrounding land use characteristics help decide the choice of the design vehicle, but the local or state agency with jurisdiction of the roadways, and all stakeholders, e.g. large industrial shippers, should be consulted to assist in determining the appropriate design vehicle and possible need for OSOW accommodation (1). The dimensions and turning path requirements for different common highway vehicles can be found in the Appendix A.
Fire engines, transit vehicles, and single-unit delivery vehicles should also be considered to be accommodated in urban areas without the use of the truck apron. Generally, WB-50 vehicles are the largest vehicle needed on urban collectors and arterials; however, larger trucks such as WB-67 may need to be considered at intersections on Interstate or primary state highway systems (1). Accommodating WB-67 vehicles at roundabouts designed using the WB-50 design vehicle are discussed in later sections of this study.
Some locations in rural areas and freeway interchanges may expect OSOW which travel on the roadways infrequently and require a special permit. These oversized vehicles should not be used as a design vehicle for a roundabout design since their passage is usually infrequent, and excessive dimensions would lead to higher speeds and lessened safety for the majority of the users. Therefore, the challenge is to design roundabouts on roadways where an OSOW vehicle can be anticipated and needs to be accommodated, without diminishing the safety benefits for the majority of users (1).
17
Figure 2.6: Swept Path Analysis of WB-67 Vehicle for Different Diameters
Source: Roundabouts: An Informational Guide, Second Edition (1)
2.5 Trucking
The use of motor vehicles for freight transportation accelerated in the US during World War I (1914-1918) (14). It was estimated that commercial trucks have increased by 56 percent between 1980 and 2007 (8). From Figure 7, it can be observed that freight expenditure, the combining local and intercity trucking shares, are a major portion of US freight expenditures and it has increased over time (14).
18
Figure 2.7: U.S. Freight Expenditures by Mode (in billions of 2000 US$)
Source: Trucking 101: An Industry Primer (14)
According to an estimate by the American Trucking Association (ATA), in 2009 the trucking industry had a revenue share of 81.9% ($544.4 billion) of the total spent on all modes of freight transportation in US (15). Trucking also plays a prominent role in international trade. Freight movement between US and other continents primarily taking place by a ship or an airplane; however, trucks make shipments to ports and airports and are used when freight has to travel between the US, Mexico, and Canada (15). According to an estimate of the Bureau of Transportation Statistics (BTS) in 2006, goods transported between the US, Canada, and Mexico by truck had a share of 61.6% of the value of cargo, and this share accounts for 26.3% of the tons of cargo moved between these countries (16). Figure 2.8 illustrates different types of large trucks that operate in US.
19
Figure 2.8: FHWA Truck Classifications
Source: FHWA Comprehensive Truck Size and Weight Study, Volume 2 (17)
The legal, maximum gross vehicle weight (GVW) of a truck is 80,000 lbs (14) based on the current federal regulations. These regulations are enforced by a combination of weigh-in-motion (WIM) sites and roadside weigh and inspection stations (14). About 200 million weighs were made in 2008 with WIM sites sharing 60% and the remaining 40% were static (8). Heavy trucks exceeding the GVW limit can do damage to roads and bridges (8). Single-unit trucks and combination vehicles are two different categories of truck types. As can be seen in Figure 2.8, single-unit trucks have short wheel bases and they do not have trailers. Combination vehicles can be further categorized into conventional combination vehicles and longer combination vehicles (LCVs) as shown in Figure 2.8. (17). Congress has defined an LCV as “any combination of a
20
truck tractor and two or more trailers or semi-trailers which operates on interstate system at a gross vehicle weight (GVW) greater than 80,000 lbs.” (18).
2.6 Freight Transportation and Logistics
Freight transportation and logistics management are an integral part of supply chain management which basically involves transportation services to deliver raw materials,
intermediate goods, and finished goods between origin and destination (19). There are various modes of transportation available in logistics management such as rail, truck, water, and air. Among the various modes of transportation available, motor carriers (trucks) are used for the ‘last’ mile of journey in the usual supply chain process because of their greater flexibility and universal access to industrial and commercial locations (20). As a result of the last mile truck travel, urban truck traffic is growing in the urban areas resulting in congestion problems which are seen in many American cities today (20). Figure 2.9 explains the relationship between cost and modal service associated with various available freight transportation modes. Figure 2.10 illustrates the trend in average length of haul by mode from three recent commodity flow survey (CFS). It can be noted that from the 2007 CFS, the average truck shipment moves 206 miles, and the average length of hauling in trucking mode has increased 24 percent over 2002 (20).
Figure 2.9: Relationship between Cost and Modal Service Associated with various available Freight Transportation Modes
21
Figure 2.10: Trend in Average Length of Haul by Mode
Source:Preserving and Protecting Freight Infrastructure and Routes(19)
Transportation and warehousing industries employed 4.5 million people in 2008 which was more than 3 percent of the total U.S. employment. Also trucking was the largest employer with 1.4 million employees within the for-hire transportation section (19).
Three quarters of people in America were reported to be living in urban locations by 1990. Currently, over 83 percent of the U.S. population is reported living and working in urbanized areas (20). By considering the 20 largest U.S. metropolitan areas, it was determined that 41 percent of population lives in the city and the rest 59 percent live in the surrounding suburbs (20). Urbanized area is defined by the Census Bureau as:
“An area consisting of a central place (s) and adjacent territory with a general population density of at least 1,000 people per square mile of land area that together have a
minimum residential population of at least 50,000 people. The U.S. Census Bureau uses published criteria to determine the qualification and boundaries of urban areas.” (20)
22
Urban delivery service has many operational challenges while making just-in-time (JIT) deliveries travelling through congested highways, parking restrictions, and route restrictions (20). Warehouses and distribution facilities are constructed in or near urban areas to overcome these challenges and meet the delivery times by transporting the goods in smaller vehicles that can negotiate the road geometrics in dense urban areas (20). The truck configuration that is most commonly used in US is a 5-axle tractor-semi-trailer (TST) combination vehicle which is
commonly called an ‘18 wheeler’ or just “semi”. However, this 5-axle TST is commonly used to transport goods from origin to warehousing facility near urban areas (20). The last mile
deliveries were generally made in smaller trucks which are shown in Figure 2.11. Various movements involving urban truck traffic include (20):
1) long haul trucks passing through the urban area on the urban highway network which has both the origin and destination outside the urban area,
2) long haul trucks having either pick-up or delivery in the urban region, 3) truck drayage,
4) local trucks moving goods among facilities, 5) construction vehicles,
6) utility and other residential service vehicles,
7) van lines delivering goods with special requirement, and 8) package services.
Figure 2.11: Trucks used for Last Mile and Line Haul Operations
23
2.7 Conflicting Land Uses for Freight Transportation
Residential, educational, and medical related land uses were generally considered incompatible with freight transportation activities (19). Some of the major conflicts that non-freight interests face with non-freight transportation facilities are air and water pollution, light pollution, noise pollution, effects of vibration, safety issues, congestion, and environmental justice issues (19). However, these conflicts lead to building of barriers for the development of efficient freight transportation operation from the freight perspective of interest. On the other hand, potential barriers for freight services are speed restrictions, limitations on hours of operation, height and clearance impacts, size and weight limitations, corridor design impacts, environmental permitting, limitations on dredging operations and/or the depositing of dredging material, backlog of waterway lock or channel maintenance, hazardous material routing
restrictions, and gentrification that displaces, impedes, or increases the cost of freight
transportation. Barriers for freight facilities not only affect the freight transportation facilities, but also the route choice and accessibility to their destination points (19).
Freight facilities and corridors are very important and have to be preserved. Lack of preserving freight facilities, yards, and other ancillary facilities in the transportation network can create bottlenecks, increase in cost of goods, and ultimately effects the customers by increased prices. Various practices such as long range planning activities, delineation of corridors, freight support and preservation initiatives, maintenance activities, and purchase of corridors for freight future use have to be conducted for preserving the freight facilities and corridors (19).
2.8 Large Trucks and Roundabouts
A study Accommodating Trucks in Single and Multilane Roundabouts discusses various issues and a design measure related to trucks and oversize vehicles at roundabouts and describes the treatments used when the truck percentages are high and the trade-offs in terms of safety and speed control when using these techniques (21).
An optimal roundabout design is a design which safely accommodates a large portion of road users with minimal delay. Therefore frequencies of use by various users are considered for an optimal roundabout. Accommodating larger vehicles at roundabouts is a relatively a new and
24
growing practical challenge. Many practical measures have been developed worldwide to accommodate larger trucks at roundabouts such as: fully traversable center islands (similar to mini-roundabouts), widened entry and exit lanes, right turn bypass lanes, partially traversable central islands (truck aprons), gated pass-through lanes, lane striping, and others. Each of these methods carry design trade-offs in terms of safety and speed control of cars and small trucks, and so each should be considered for site specific conditions (21).
Truck right turns can be accommodated at larger roundabouts by different means, such as, use of an adjacent lane, providing widened entries and entry lanes, providing right turn bypass lanes, free flow bypass lanes, yield controlled bypass lanes, and an internal bypass lane (21). Figure 2.12 shows pictures of few of the treatments to accommodate truck right turns.
Truck aprons are generally designed to provide maneuvering space for large vehicles in a roundabout while still providing deflection for smaller vehicles. However, an apron may not be necessary if speed control and truck maneuvering space can be provided without an apron. A fully raised island provides an effective lateral deflection when compared to aprons. Sometimes, the height and slope of the apron can create under clearance and stability problems for trucks (21).
A truck apron field study (not OSOW) was conducted at I-17/Happy Valley Road, Phoenix in July 2007. Peak hour apron use by semis and large single-unit trucks was observed. Data showed that out of 624 trucks observed, 77% of them did not use the apron. Among the trucks that did use the apron, most (67%) of them used it because a car was in the adjacent lane. It was also observed that when a car and truck were side-by-side, the smaller vehicle usually accelerated ahead of the truck or applied brakes to get behind the truck (21).
25
Figure 2.12: Treatments for Accommodating Truck Right Turns
26
2.9 Joint Roundabout Truck Study
A “Joint roundabout truck study” conducted by Wisconsin DOT (WisDOT) and Minnesota DOT (MnDOT) and their consultants team (22) have studied better ways to
understand and improve the accommodation of trucks at multilane roundabouts. This study was a four - phase study and the available report provides a summary for the first three phases. Phase 1 studied the current design practices, and obtained inputs from trucking industry via a survey to develop design guidelines for accommodating trucks in multilane roundabouts. A truck in this study is defined as the design vehicle used on state, trunk highways, WB-62 is considered a design vehicle for MnDOT and WB-65 considered as a design vehicle for WisDOT (22).
Multilane roundabout designs in the US were categorized into case 1 roundabouts, case 2 roundabouts, and case 3 roundabouts based on the data collected for 18 representative
roundabouts located in Wisconsin, Minnesota, Michigan, and Arizona. Figure 2.13 illustrates the example layout of case 1, case 2, and case 3 roundabouts. Case 1 roundabouts are designed such that the trucks encroach into adjacent lanes as they enter, circulate and exit the roundabout. Case 2 roundabouts are designed such that the trucks are accommodated in the lane as they enter, but may encroach the adjacent lanes while circulating and exiting the roundabout. Case 3
roundabouts are designed such that the trucks are accommodated in lane as they enter, circulate, and exit the roundabout. Investigation of the geometric characteristics of the 18 study
roundabouts has showed that each roundabout case type has its unique geometric characteristics relative to the other case types (22).
Table 2.6 shows the observed design characteristics of the 18 study roundabouts based on case types. Heavy vehicle percentages for the 18 study roundabouts ranged from 5.5% to 18.6%. It was observed that case 2 and case 3 roundabouts were in the higher end of the heavy vehicle percentage range. Case 1 roundabouts in this study were observed to have slightly more truck related crashes and caused delays at entries due to truck encroachment (22).
This study also sent out questionnaires to truck companies/drivers to determine their potential concerns about navigating roundabouts. The responses indicated that more information should be conveyed before a roundabout entry to better understand if the truck should stay in the lane or use both lanes. Several responses indicated that the actions of the passenger car drivers may cause conflicts with the trucks and the truck drivers preferred to stay in the lane at
27
Figure 2.13: Example Layouts of Case 1, Case 2, and Case 3 Roundabouts
28
Table 2.6: Observed Design Characteristics of 18 Study Roundabouts
Source: Joint Roundabout Truck Study (22)
Table 2.7: Apron Width Range and Average by Roundabout Case Type
Source: Joint Roundabout Truck Study (22)
Twelve of the 18 roundabouts had data on the truck apron width. From Table2.7, it can be concluded that as the case number increased, the apron width required also increased. It was concluded from phase 1 of the study, that each case has advantages and disadvantages, and these tradeoffs needs to be considered for planning and design process (22).
The objective of Phase 2 of the “Joint roundabout truck study” was to collect video data for the selected roundabouts in phase 1 and observe the truck operations. Trucks at case 1 roundabouts were observed to be navigating as expected using both lanes, and at rare occasions rode over the outside entry curbs. For case 2 and case 3 roundabouts, when potential conflicting traffic was present, trucks stayed in their lane on the approach 91% of the time and stayed in their lane while circulating 83% of time. When potential conflicting traffic was not present, trucks stayed in their lane on the approach 71% of the time and stayed in their lane while
29
circulating 37% of time. It was concluded, from phase 2 of the study, that trucks mostly operated as expected at these three design case. However, the presence of adjacent traffic influenced the truck ‘driving in-lane behavior’ when trucks were entering and circulating. One of the limitations of the study was that, small sample sizes of case 2 and case 3 roundabouts were available for phase 1 and phase 2 investigations (22).
Table 2.8: Typical Design Parameters for Two-Lane Roundabouts
Source: Joint Roundabout Truck Study (22)
Phase 3 of the “Joint roundabout truck study” provided design guidance for