FOR ESTIMATING THE CONSTRUCT
-LEVEL PREDICTIVE
VALIDITY OF SELECTION TESTS
Lazaro Mwakesi Mwandigha, MSc.
PhD
University of York
Health Sciences
Background:
In the thesis two medical selection challenges were addressed using the United Kingdom Clin-ical Aptitude Test (UKCAT) and Professional and Linguistic Assessments Board (PLAB) test in the selection of undergraduate medical school entrants and International Medical Graduates (IMGs) in the UK as motivating examples. Firstly, methods for correcting for bias in the esti-mate of predictive validity due to range restriction (particularly Multiple Imputation (MI) and
Full Information Maximum Likelihood (FIML)) were evaluated for thepredictive validity,
sin-gle hurdle concurrentandmultiple hurdlevalidity designs under varying degrees of strictness in selection. For MI, the impact of the composition of the imputation model was also investi-gated. Secondly, the Number Needed to Reject (NNR), a concept analogous to Number Needed to Treat was evaluated with its uncertainty tackled as a missing data and resampling problem.
Methods:
The performance of MI and FIML was tested through Monte Carlo simulations and validated using PLAB data. The uncertainty about NNR was estimated by use of MI and case resampling bootstrap using UKCAT data.
Results:
Generally, MI and FIML were found to be equivalent in performance and superior to other
methods of correcting for range restriction bias for selection ratios of≤20% only in instances
where data were multivariate normal. The inclusion of highly predictive variables in the im-putation model increased the precision of MI. The percentile bootstrap confidence intervals contained reliable estimates for NNR.
Conclusion
MI and FIML are viable alternatives for tackling bias in the estimate of predictive validity for direct range restricted data that satisfies the assumption of multivariate normality. Caution should be taken to avoid their application in instances where the assumption of multivariate
normality is violated. A combination of imputations andcase resampling bootstrapis
I.
Preface
23
1. Background 24
1.1. Medical selection in the UK context . . . 27
1.2. Towards understanding construct-level predictive validity, uncertainty for Num-ber Needed to Reject (NNR) and Peer Competition Rescaling (PCR) . . . 31
1.3. Aims . . . 33
1.4. Objectives . . . 34
1.5. Chapter summary . . . 34
II.
Literature review
35
2. Predictors used in selection and construct-level predictive validity of aptitude tests 36 2.1. Predictors of undergraduate medical school performance used in the short-listing stage of selection . . . 392.1.1. Prior educational achievement . . . 39
2.1.2. Aptitude tests . . . 40
2.1.3. Situation Judgment Tests (SJTs) and Emotional Intelligence (EI) . . . . 45
2.1.4. Personality tests . . . 47
2.1.5. Personal statements and recommendation letters . . . 49
2.2. Predictors of undergraduate medical school performance used in final stage of
selection . . . 54
2.2.1. Interviews . . . 54
2.3. Review of construct-level predictive validity of aptitude tests for undergraduate medical school performance . . . 57
2.4. Chapter summary . . . 71
3. Dealing with bias in the estimation of predictive validity 72 3.1. Background and scope . . . 72
3.2. Statistical methods for correcting for the bias in the (Pearson) correlation coef-ficient due to range restriction . . . 86
3.2.1. Thorndike Case I formula . . . 89
3.2.2. Thorndike Case II formula . . . 90
3.2.3. Thorndike Case III formula . . . 90
3.2.4. Method of Hunter, Schmidt, & Le (Thorndike Case IV formula) . . . . 91
3.2.5. Pearson Lawley formula . . . 94
3.2.6. Missing data approaches . . . 94
3.3. Chapter summary . . . 99
4. Missing data patterns, frameworks, mechanisms and handling methods 101 4.1. Missing data patterns . . . 102
4.2. Missing data frameworks . . . 103
4.3. Distribution of missingness . . . 104
4.4. Missing data mechanisms . . . 105
4.4.1. Missing Completely At Random (MCAR) . . . 106
4.4.2. Missing At Random (MAR) . . . 107
4.4.3. Missing Not At Random (MNAR) . . . 108
4.5. Missing data handling methods . . . 109
4.5.1. Deletion methods . . . 109
4.5.3. Weighting observations . . . 111
4.5.4. Direct likelihood . . . 112
4.5.5. Joint modelling of observed and missing data . . . 113
4.5.6. Full Information Maximum Likelihood (FIML) . . . 115
4.5.7. Multiple Imputation (MI) . . . 116
4.6. Forms of imputations . . . 118
4.6.1. Imputing unconditional means . . . 118
4.6.2. Imputing from unconditional distributions . . . 118
4.6.3. Imputing conditional means . . . 119
4.6.4. Imputing from conditional distributions . . . 119
4.7. Algorithms for Multiple Imputation (MI) . . . 120
4.7.1. Expectation Maximisatiom (EM) . . . 120
4.7.2. Markov Chain Monte Carlo (MCMC) . . . 121
4.8. Chapter summary . . . 122
III. Implementation of proposed methodology
123
5. Correcting for range restriction bias using missing data handling methods 124 5.1. Impact of the magnitude of correlation coefficient on the correction for range restriction bias . . . 1335.1.1. Direct range restriction . . . 133
5.1.2. Indirect range restriction . . . 136
5.2. Testing phase for the expected performance of the different methods for cor-recting range restriction . . . 148
5.2.1. Simulation results for correlation coefficients for the predictive validity selection design: Thorndike Case II vs MI . . . 149
5.2.2. Simulation results for correlation coefficients for the predictive validity selection design: Thorndike Case III vs MI . . . 153
5.2.3. Simulation results for correlation coefficients for the two hurdle
valid-ity selection design: Pearson Lawley vs FIML vs MI . . . 161
5.2.4. Simulation results for correlation coefficients for the single hurdle con-current validity selection design: Pearson Lawley vs FIML vs MI . . . 168
5.3. Validation phase for the expected performance of the different methods for cor-recting range restriction using Professional and Linguistic Assessments Board (PLAB) data . . . 171
5.3.1. Validation of results for correlation coefficients for the predictive va-lidity selection design: Thorndike Case II vs MI . . . 174
5.3.2. Validation of results for correlation coefficients for the predictive va-lidity selection design: Thorndike Case III vs MI . . . 176
5.3.3. Validation of results for correlation coefficients for the two hurdle va-lidity selection design: Pearson Lawley vs FIML vs MI . . . 179
5.3.4. Validation of results for correlation coefficients for the single hurdle concurrent validity selection design: Pearson Lawley vs FIML vs MI . 185 5.4. Discrepancy in performance between the testing and validation phases . . . 187
5.5. Chapter summary . . . 199
6. Estimating uncertainty about the estimate of Number Needed to Reject (NNR) and proof of concept for “Peer Competition Rescaling (PCR)” 200 6.1. Estimating uncertainty about the estimate of Number Needed to Reject (NNR) using resampling methods . . . 200
6.1.1. Introduction . . . 200
6.1.2. Data . . . 203
6.1.3. Methods . . . 204
6.1.4. Results . . . 208
6.2. Proof of concept for Peer Competition Rescaling: “Nationalising” local out-come measures . . . 220
6.2.1. Introduction . . . 220
6.2.3. Methods . . . 222
6.2.4. Results . . . 223
6.3. Chapter summary . . . 229
7. Discussion 230 7.1. Main findings . . . 230
7.1.1. Construct-level predictive validity . . . 230
7.1.2. Estimating uncertainty about the Number Needed to Reject (NNR) . . . 237
7.1.3. Proof of concept for “Peer Competition Rescaling” . . . 239
7.2. Comparison with findings from other studies . . . 240
7.3. Inferences and interpretation of findings . . . 242
7.4. Strengths and limitations . . . 245
7.5. Implication for selection practice and policy in the UK . . . 248
7.6. Directions for future research . . . 256
8. Technical Appendices 258 8.1. Correcting for bias in the Pearson correlation coefficient due to measurement error . . . 258
8.1.1. Traditional approach . . . 259
8.1.2. Structural Equation Modeling (SEM) approach . . . 260
8.1.3. Bayesian approach . . . 262
8.2. Correcting for bias in the (Pearson) correlation coefficient due to range restric-tion and measurement error . . . 264
8.3. Simulation techniques: resampling methods . . . 267
8.3.1. Monte Carlo method . . . 268
8.3.2. Permutation (randomisation) . . . 268
8.3.3. Jackknife . . . 269
8.4. Types of bootstrap . . . 269
8.4.1. Non-parametric bootstrap . . . 270
8.5. Bootstrap confidence intervals . . . 276
8.5.1. Non-studentised pivotal method . . . 278
8.5.2. Studentised pivotal method . . . 278
8.5.3. Percentile method . . . 279
8.5.4. Bias Corrected (BC) percentile method . . . 280
8.5.5. Bias Corrected and accelerated (BCa) percentile method . . . 281
8.5.6. Test Inversion Bootstrap (TIB) method . . . 282
8.5.7. Studentised Test Inversion Bootstrap (STIB) method . . . 283
8.6. Choice of bootstrap and bootstrap confidence interval . . . 283
8.7. The computation of Peer Competition Rescaling (PCR) . . . 304
8.7.1. Guidelines for computing PCR . . . 304
8.7.2. Data generation of selection data . . . 305
8.7.3. Computation of the peer rescaled outcomes . . . 311
Glossary 314
1.1. Missing data approach to the UKCAT’s construct-level predictive validity . . . 32 2.1. Flow chart of papers included in the review of predictors of undergraduate
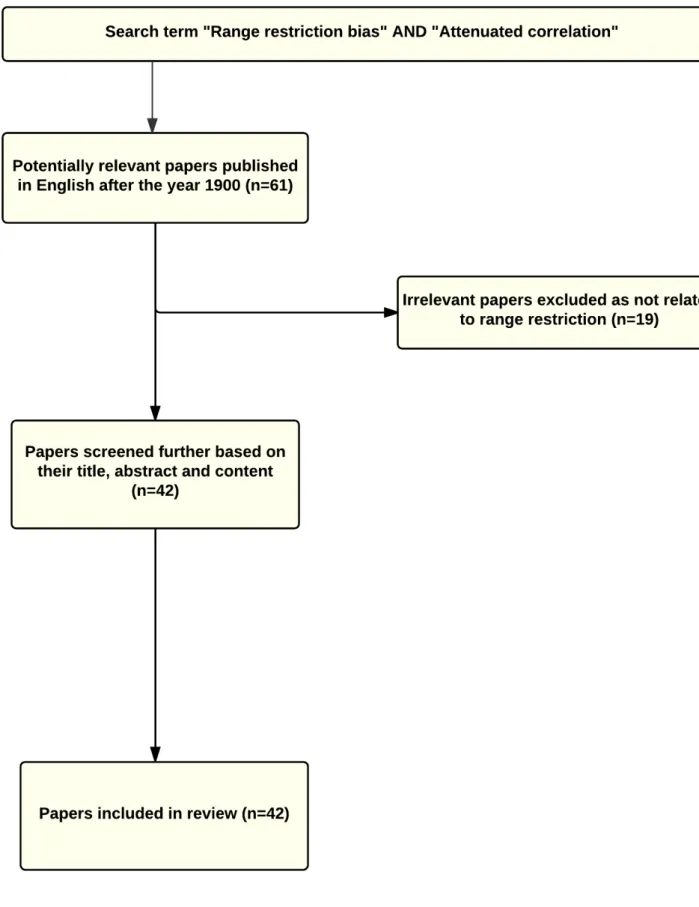
medical school performance used in selection of medical school entrants . . . 38 2.2. Flow chart of papers included in the review of construct-level predictive
valid-ity of aptitude testing for medical school outcomes. . . 59 3.1. The attenuating effect of measurement error on the Pearson correlation
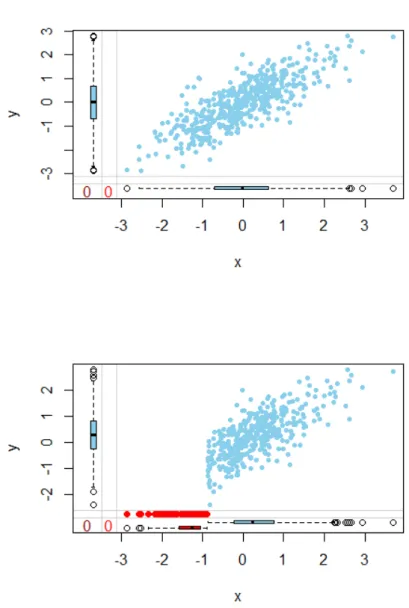
coeffi-cient between a simulated predictor (selection test), x, and a simulated outcome (criterion), y. . . 75 3.2. The attenuating (downward bias) effect of range restriction on the Pearson
correlation coefficient between a simulated predictor (selection test), x, and a simulated outcome (criterion), y. . . 77 3.3. The effect of range restriction on the precision of the estimate for the Pearson
correlation coefficient between a simulated predictor (selection test), x, and a simulated outcome (criterion), y. . . 78 3.4. Mean bias and RMSE for regression coefficient for indirect range restriction
induced by selection on variable z for selection ratio 0.2, 0.4, 0.6 and 0.8. . . . 80 3.5. Illustrative diagram of missing data structure for concurrent validity design . . 81 3.6. Illustrative diagram of missing data structure for the two variable predictive
validity design . . . 81 3.7. Illustrative diagram of missing data structure for the two hurdle validity design 82
3.8. Flow chart of papers included in the review of the effects of range restriction on the (Pearson) correlation coefficient . . . 85 3.9. Model of method of Hunter, Schmidt, & Le (Case IV) for correcting range
restriction . . . 92
3.10.The effect of range restriction on the simulated predictor (selection test) x and
outcome (criterion) y for arbitrary rxyu =0.8and selection ratio=0.8 . . . 98
3.11.MI for the simulated y outcome based on the simulated selection test x with
rxyu=0.8 and selection ratio arbitrarily set at 0.8 . . . 99 4.1. The three missing data patterns:univariate, monotone and arbitrary pattern of
missingness . . . 102 4.2. Conceptual representation of Missing Completely At Random (MCAR) for a
univariate missing data pattern . . . 106 4.3. Conceptual representation of Missing At Random (MAR) for a univariate
miss-ing data pattern . . . 107 4.4. Conceptual representation of Missing Not At Random (MNAR) for a univariate
missing data pattern . . . 108 4.5. Conceptual representation of the stages of Multiple Imputation (MI) . . . 116 5.1. Results from the simulations exploring the impact of quantity of correlations,
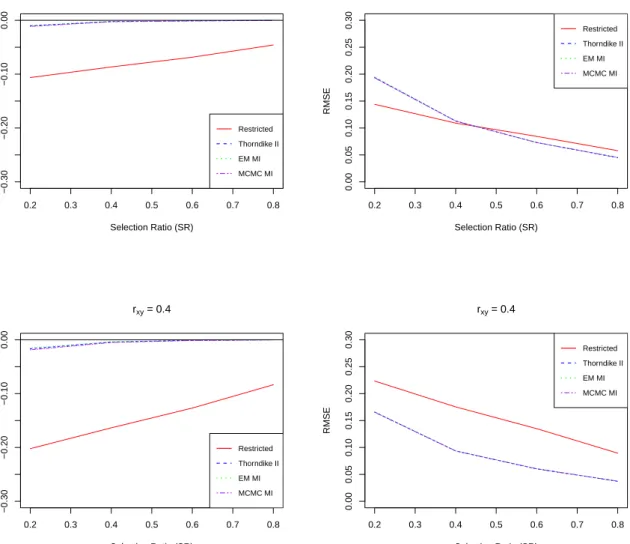
rxyu=0.2 and 0.4, on performance measures mean bias and RMSE . . . 134 5.2. Results from the simulations exploring the impact of quantity of correlations,
rxyu=0.6 and 0.8, on performance measures mean bias and RMSE . . . 135 5.3. Results from the simulations exploring the impact of quantity of correlations of
interest, rxyu=0.2 and varying magnitude of ruzyon performance measures mean bias and RMSE following selection on variable z and MI based on z only. . . . 139 5.4. Results from the simulations exploring the impact of quantity of correlations of
interest, rxyu=0.4 and varying magnitude of ruzyon performance measures mean bias and RMSE following selection on variable z and MI based on z only. . . . 140
5.5. Results from the simulations exploring the impact of quantity of correlations of interest, rxyu=0.6 and varying magnitude of ruzyon performance measures mean bias and RMSE following selection on variable z and MI based on z only. . . . 141 5.6. Results from the simulations exploring the impact of quantity of correlations of
interest, rxyu=0.8 and varying magnitude of ruzyon performance measures mean bias and RMSE following selection on variable z and MI based on z only. . . . 142 5.7. Results from the simulations exploring the impact of quantity of correlations of
interest, rxyu=0.2 and varying magnitude of ruzyon performance measures mean bias and RMSE following selection on variable z and MI based on z and x . . . 144 5.8. Results from the simulations exploring the impact of quantity of correlations of
interest, rxyu=0.4 and varying magnitude of ruzyon performance measures mean bias and RMSE following selection on variable z and MI based on z and x . . . 145 5.9. Results from the simulations exploring the impact of quantity of correlations of
interest, rxyu=0.6 and varying magnitude of ruzyon performance measures mean bias and RMSE following selection on variable z and MI based on z and x . . . 146
5.10.Results from the simulations exploring the impact of quantity of correlations of
interest, rxyu=0.8 and varying magnitude of ruzyon performance measures mean bias and RMSE following selection on variable z and MI based on z and x . . . 147
5.11.Mean bias and RMSE: Imputation variable x . . . 151
5.12.Mean bias and RMSE: Imputation variable z for indirect range restriction . . . 157
5.13.Mean bias and RMSE: Imputation variable z and x for indirect range restriction 158
5.14.Mean bias for Pearson Lawley, FIML and MI methods for two hurdle validity
design with full information available for variables z and x . . . 163
5.15.RMSE for Pearson Lawley, FIML and MI methods for two hurdle validity
de-sign with full information available for variables z and x . . . 164
5.16.Mean bias for Pearson Lawley, FIML and MI methods for two hurdle validity
design with full information based only on selection test z . . . 166
5.17.RMSE for Pearson Lawley, FIML and MI methods for two hurdle validity
5.18.Mean bias for Pearson Lawley, FIML and MI methods for single hurdle con-current validity design for the selection ratios of 0.2, 0.4, 0.6 and 0.8 . . . 169
5.19.RMSE for Pearson Lawley, FIML and MI methods for single hurdle concurrent
validity design for the selection ratios of 0.2, 0.4, 0.6 and 0.8 . . . 170
5.20.Validation of methods based on PLAB data: Thorndike Case II . . . 175
5.21.Validation of methods based on PLAB data: Thorndike Case III with MI based
on PLAB I only . . . 177
5.22.Validation of methods based on PLAB data: Bias for Thorndike Case III with
MI based on PLAB I and IELTS . . . 178
5.23.Validation of methods based on PLAB data: RMSE for Thorndike Case III with
MI based on PLAB I and IELTS . . . 179
5.24.Bias based on PLAB data: FIML, Pearson Lawley with MI based on PLAB I
and IELTS for the two hurdle selection design . . . 180
5.25.RMSE based on PLAB data: FIML, Pearson Lawley with MI based on PLAB I
and IELTS for the two hurdle selection design . . . 181
5.26.Bias based on PLAB data: FIML, Pearson Lawley with MI based on PLAB I
and IELTS but full information on PLAB I only for the two hurdle selection design183
5.27.RMSE based on PLAB data: FIML, Pearson Lawley with MI based on PLAB
I and IELTS but full information on PLAB I only for the two hurdle selection design . . . 184
5.28.Bias based on PLAB data: FIML, Pearson Lawley with MI based on PLAB I
and IELTS for single hurdle concurrent design . . . 185
5.29.RMSE based on PLAB data: FIML, Pearson Lawley with MI based on PLAB I
and IELTS for single hurdle concurrent design . . . 186
5.30.Distributions of the total of UKCAT, GCSE and A-level exams for both
appli-cants and entrants for the 2007-9 undergraduate medical school entry cohort . 189
5.31.Distributions of the standardised undergraduate knowledge and skills-based
exam outcomes across 18 medical schools in the UK for the 2007 and 2008 undergraduate medical school entry cohorts . . . 189
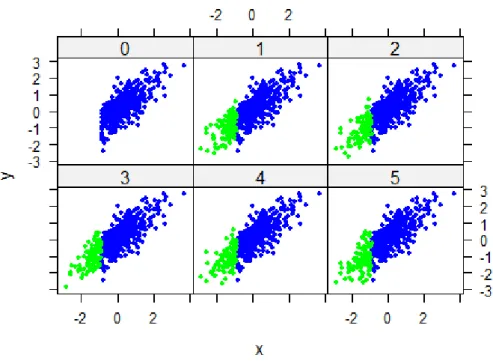
5.32.The effect of varying levels of skewness (η) on simulated data under the DRR and IRR selection design . . . 191
5.33.Bias and RMSE for the Thorndike Case II, MI based on EM and MCMC
cor-rection for Direct Range Restriction (DRR) on data drawn from a Multivariate Skew Normal (MSN) distribution with varying amounts of skewnessη. . . 193
5.34.Bias and RMSE for the Thorndike Case III, MI based on EM and MCMC
cor-rection for Indirect Range Restriction (IRR) on data drawn from a Multivariate Skew Normal (MSN) distribution with varying amounts of skewnessη. . . 196
6.1. Sensitivity and specificity based on multiply imputed data for different thresh-olds of total UKCAT scores. MI was conducted without regard to university effect. . . 213 6.2. Positive Predictive Value (PPV) and Number Needed to Reject (NNR) based on
multiply imputed data for different thresholds of total UKCAT scores. MI was conducted without regard to university (cluster) effect. . . 214 6.3. Sensitivity and specificity based on MI implemented within each cluster
(uni-versity) for different thresholds of the total UKCAT scores. . . 216 6.4. Positive Predictive Value (PPV) and Number Needed to Reject (NNR) based on
MI implemented within each cluster (university) for different thresholds of the total UKCAT scores. . . 217 6.5. Sensitivity and specificity based on single imputation followed by case
resam-pling bootstrap implemented at student and university levels of the hierarchical data for different thresholds of the total UKCAT scores. . . 218 6.6. Positive Predictive Value (PPV) and Number Needed to Reject (NNR) based
on single imputation followed by case resampling bootstrap implemented at student and university-levels of the hierarchical data for different thresholds of the total UKCAT scores. . . 219 6.7. Conceptual diagram for the Peer Competition Rescaling . . . 221
6.8. Results on Unscaled and and Peer Competition Rescaling (PCR) from the uni-variable (top panel) and multiuni-variable (bottom panel) linear mixed models for knowledge-based exam outcomes. The size of the bars represent the magnitude of the (un)scaled coefficients while the line segments on the bars represent the
estimated 95% confidence intervals. . . 227
6.9. Results on Unscaled and and Peer Competition Rescaling (PCR) from the uni-variable (top panel) and multiuni-variable (bottom panel) linear mixed models for skills-based exam outcomes. The size of the bars represent the magnitude of the (un)scaled coefficients while the line segments on the bars represent the estimated 95% confidence intervals. . . 228
7.1. Conceptual representation of the results of the performance of MI correction for the effects of direct range restriction over the Thorndike Case II correction . 233 7.2. Conceptual representation of the results of the performance of the MI correc-tion for the effects of direct range restriccorrec-tion over the Thorndike Case III cor-rection . . . 234
7.3. Conceptual representation of the results of the performance of the MI correc-tion, FIML and Pearson Lawley correction for the effects of range restriction under the two hurdle validity selection design with full information on the se-lection test z and x. . . 236
7.4. Conceptual representation of the results of the performance of the MI correc-tion for the effects of direct range restriccorrec-tion for the FIML and Pearson Lawley corrections with full information on only selection variable z . . . 236
7.5. Decision tree for achieving construct-level predictive validity . . . 243
7.6. Decision tree for estimating uncertainty for NNR . . . 244
8.1. SEM approach to dealing with attenuation . . . 261
8.2. Distribution of simulated knowledge-based outcome scores for two hypotheti-cal medihypotheti-cal schools before and afterPeer Competition Reshypotheti-caling (PCR) . . . . 312
2.1. The PICO methodology contextualised in the review of literature on predictors of medical school performance . . . 37 2.2. The evolution of the first developed aptitude test, the Medical College
Admis-sions Test (MCAT). . . 42 2.3. Summary of figures relating to predictive validity and construct-level predictive
validity from the review of the literature . . . 60 2.4. Summary of papers from the review of the construct-level predictive validity of
aptitude tests used in medical school selection world wide . . . 70 3.1. Bias in regression and bivariate Pearson correlation coefficients for both the
concurrent single hurdle concurrent validity design and predictive validity se-lection design . . . 83 3.2. Bias in regression and bivariate Pearson correlation coefficients for the two
hurdle validity selection design . . . 83 4.1. Layout of missing data framework, mechanisms and handling methods . . . 104 5.1. Performance measures for the different methods evaluated by simulation . . . . 128 5.2. Simulation times for the different investigations conducted . . . 132 5.3. Results of the impact of the strictness of the selection process and magnitude of
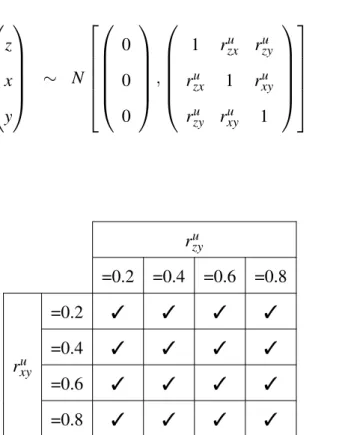
unrestricted correlation rxyu under a DRR with selection based on x . . . 136 5.4. The grid of values for the pairs of correlation rxyu and ruzysampled in the
5.5. Results of the impact of the strictness of the selection process and magnitude of unrestricted correlations rzyu and ruxyunder an IRR with selection based on z . . 148 5.6. Statistical comparison: Imputation based on variable x . . . 152 5.7. Statistical comparison: Imputation based on variable z for indirect range
re-striction . . . 159 5.8. Statistical comparison: Imputation based on variable z and x for indirect range
restriction based on z . . . 160 5.9. Correlation matrix of the three variables for the 8,828 IMGs with their
corre-sponding minimum and maximum values obtained from the PLAB data . . . 173
5.10.Frequency distribution of the overall IELTS score for the 8,828 IMGs from the
PLAB data. . . 173
5.11.T-tests comparing bias for the different methods of correcting range restriction
under DRR selection design for varying degrees of left skewness . . . 194
5.12.F-tests comparing precision for the different methods of correcting range
re-striction under DRR selection design for varying degrees of left skewness . . . 195
5.13.T-tests comparing bias for the different methods of correcting range restriction
under IRR selection design for varying degrees of left skewness . . . 197
5.14.F-tests comparing precision for the different methods of correcting range
re-striction under IRR selection design for varying degrees of left skewness . . . . 198 6.2. Imputation matrix for the predictors and outcomes of interest . . . 207 6.3. Means and standard deviation of the UKCAT scores for medical school
appli-cants who sat for the UKCAT in 2006 to 2007 . . . 208 6.4. Data attrition (missing values) rates for the two cohorts (2007 and 2008
en-trants) . . . 209 6.5. Socio-demographic characteristics of the two entry cohorts . . . 209 6.6. Patterns of missingness in the variables . . . 211 6.7. Patterns of missingness for pass outcome in each year of undergraduate
medi-cal schoool training . . . 212 6.8. Complete separation of data points within the universities in the data. . . 215
6.9. Patterns of missingness for undergraduate medical knowledge-based exams . . 225
6.10.Patterns of missingness for undergraduate medical skills-based exams . . . 226
7.1. The components that contribute towards the Educational Performance Measure (EPM) scores used to selection for the Foundation Programme . . . 254 7.2. The assignment of points based on decile of performance in local medical
school exams . . . 255 8.1. Types of correlation to be computed depending on the scales of the variables. . 258 8.2. Some publications on the UKCAT’s predictive validity . . . 266 8.3. Classification of resampling approaches based on already available data. . . . 267 8.4. Basic assumptions of resampling methods . . . 268 8.5. Classification of methods for constructing bootstrap confidence interval . . . . 277 8.6. Appropriate bootstrap method based on underlying distributional assumptions
(of residuals) of the data . . . 284 8.7. Properties of bootstrap confidence intervals . . . 284 8.8. T-test comparison of the methods under direct range restriction with imputation
based on selection test x together with predictive variables t, u, v and w . . . . 285 8.9. F-test comparison of the methods under direct range restriction with
imputa-tion based on selecimputa-tion test x together with predictive variables t, u, v and w . . 286
8.10.T-test comparison of the methods under indirect range restriction with
imputa-tion based on selecimputa-tion test z and predictor x together with predictive t, u, v and
w. . . 287
8.11.F-test comparison of the methods under indirect range restriction with
impu-tation based on selection test z and predictor x together with predictive t, u, v and w . . . 288
8.12.Statistical comparison: T-tests for Pearson Lawley, FIML and MI under the two
hurdle validity selection design with full information on both selection tests z and x. . . 289
8.13.Statistical comparison: F-tests for Pearson Lawley, FIML and MI under the two hurdle validity selection design with full information on both selection tests z and x . . . 290
8.14.Statistical comparison: T-tests for Pearson Lawley, FIML and MI with under
the two hurdle validity selection design with full information only on selection tests z . . . 291
8.15.Statistical comparison: F-tests for Pearson Lawley, FIML and MI with under
the two hurdle validity selection design with full information only on selection tests z . . . 292
8.16.Statistical comparison: T-tests for Pearson Lawley, FIML and MI under the
single hurdle concurrent validity selection design . . . 293
8.17.Statistical comparison: F-tests for Pearson Lawley, FIML and MI under the
single hurdle concurrent validity selection design . . . 294
8.18.Statistical comparison: Imputation for PLAB II based on the selection test
PLAB I for direct range restriction . . . 295
8.19.Statistical comparison: Imputation for PLAB II based on the selection test
PLAB I for indirect range restriction . . . 296
8.20.Statistical comparison: Imputation for PLAB II based on the selection test
PLAB I for indirect range restriction . . . 297
8.21.T-test comparison of the methods under the two hurdle validity selection
de-sign with imputation based on the selection tests PLAB I and IELTS with full information on PLAB I only. . . 298
8.22.F-test comparison of the methods under the two hurdle validity selection
de-sign with imputation based on the selection tests PLAB I and IELTS with full information on PLAB I only. . . 299
8.23.T-test comparison of the methods under the two hurdle validity selection
de-sign with imputation based on the selection tests PLAB I and IELTS with full information on available for both selection tests . . . 300
sign with imputation based on the selection tests PLAB I and IELTS with full information available on both selection tests . . . 301
8.25.T-test: Imputation for PLAB II based on the selection test PLAB I and predictor
IELTS under single hurdle validity selection design . . . 302
8.26.F-test: Imputation for PLAB II based on the selection test PLAB I and predictor
“Iron sharpens iron, So one man sharpens another”Proverbs 27:17.
I owe a debt of gratitude to many who have sharpened my personality and wit during my PhD journey, without whom this labour of work would not be possible. I am grateful to the UKCAT
Board, and specifically,Rachel Greatrix, for her help administering my stipend. I am grateful
for the support of Hull York Medical School, and specifically Professor Trevor Sheldon, who
provided the funds for two years of my tuition fees at the University of York, and to Oliver
Short who helped me with administering the finances. I owe a vote of thanks to the Health SciencesandInternational Student Support Teamwho made my student life memorable. I am
grateful toDrs Paul TiffinandAdetayo Kasimwho welcomed me to the UK and have provided
supervision throughout my studies at both Durham and York. They, together with Professor
Catherine HewittandDr Jan B¨ohnkehave offered me invaluable academic mentorship, pastoral
support and constructive criticism in my second and third year of my PhD at theUniversity of
York. I have greatly cherished their readiness and availability to offer great feedback. I thank
my father, mother and siblings who have been supportive of me in my studies. Special thanks
goes out to my lovely wife,Maria Cristina Mwandigha, a real gem and dependable ally in this
life. Lastly, certainly not least, I am grateful for the divine providence that has seen me journey from the rough neighbourhood of Nairobi, Kenya to study and work alongside the brightest minds in statistical methodology and medical education.
I declare that this thesis is a presentation of original work and I am the sole author. This work has not previously been presented for an award at this, or any other, university. All sources are acknowledged as references. From the thesis, chapter 5 and 6 are intended to be published as statistical methodology papers. The working titles for the papers are listed under subsection entitled “working scientific publication (from PhD thesis)”. During my research for this thesis, I collaborated with other researchers within the area of medical education selection. My contribution was the provision of statistical support in terms of data management, statistical modelling, interpretation and critical appraisal of the written reports. This led to submission of papers numbered 2 to 5 listed under subsection entitled “related scientific publication”. The first paper on the list is my first author publication which is based on a multilevel mediation analysis conducted on the same data used in chapter 6 of this thesis.
Working scientific publication (from PhD thesis)
1. Dealing with attenuation in the Pearson correlation coefficient due to range restriction as a missing data problem: A Monte Carlo simulation and validation with the aid of a contrived example using PLAB data(based on chapter 5 of this thesis)
2. Estimating uncertainty in the estimate of Number Needed to Reject (NNR) and proof of concept for “Peer Competition Rescaling (PCR)”(based on chapter 6 of this thesis)
Related scientific publications
1. Mwandigha LM, Tiffin PA, Paton LW, Kasim AS, B¨ohnke JR.What is the effect of
sec-ondary (high) schooling on subsequent medical school performance? A national, UK-based, cohort study. BMJ Open 2018;8:e020291.
predict undergraduate performance in medical schools: a national linkage study. BMC Medical Education 2018 18:93.
3. Tiffin PA, Mwandigha LM, Paton LW, Hesselgreaves H, McLachlan JC, Finn GM, Kasim AS.Predictive validity of the UKCAT for medical school undergraduate performance: a national prospective cohort study. BMC medicine. 2016 Sep 17;14(1):140.
4. Tiffin PA, Paton LW, Mwandigha LM, McLachlan JC, Illing J. Predicting fitness to
practise events in international medical graduates who registered as UK doctors via theProfessional and Linguistic Assessments Board (PLAB) system: a national cohort study. BMC medicine. 2017 Mar 20;15(1):66.
5. Paton LW, Tiffin PA, Smith D, Dowell JS, Mwandigha LM. Predictors of Fitness to
Practise Declarations in UK Medical Undergraduates at Provisional Registration. BMC Medical Education 2018 18:68.
Worldwide competition for medical school places is generally fierce. In the United King-dom (UK), it is approximated that there are 11 applicants per place available to study medicine (Medical School Council, 2014). Most applicants are academically (and often non-academically) highly achieving and thus it is often difficult to discriminate between a relatively homogeneous group of highly achieving individuals in a high stakes situation. This has led to the implemen-tation of more structured and formal selection processes in the medical professions (including dentistry and veterinary science). Within the selection process there are competing agendas-a need to defend high stagendas-akes decisions (agendas-and notagendas-ably the rejection of very agendas-able cagendas-andidagendas-ates agendas-at times), a desire to identify those most suitable for a medical career and also to widen access to traditionally under-represented groups. This has led to the development and implementation of
aptitude tests. The first of these, was the Scholastic Aptitude Test for Medical Schools devel-oped by physician and psychologist F.A Moss (hence sometimes referred to as the Moss test), was implemented almost a century ago for none of these listed reasons- ironically the aim of the Moss test was to address the high drop-out rates from USA medical schools (McGaghie, 2002) (see section 2.1.2 for further details). Nevertheless such aptitude tests, intended to evaluate the characteristics deemed to predict a successful career in medicine, are now widely implemented.
Ideally selection tests should bereliable(i.e. scores should be internally consistent and
repro-ducible). Item Response Theory (IRT) has extended this concept of reliability totest
informa-tion- the accuracy to which a psychometric instrument is able to discriminate between testees
epistemo-logicalissue (the way we know things)- the extent we can gain knowledge of a construct via a
measurement process. Tests should also bevalid, in that they should be measuring the intended
construct. This is a usually a more complex and challenging concept than reliability and raises numerous questions. Is the construct being measured uni or multidimensional? Can the
con-struct be operationalised and defined easily (e.g. professionalismversusverbal reasoning? Is
the construct being directly (and accurately) measured by the instrument or is it a proxy? Thus
the concept of validity raises crucialontologicalissues (what things are). Moreover in
selec-tion science we have addiselec-tional psychometric and statistical challenges. These are outlined in
greater detail later but consist of issues such as range restriction- i.e. the inability to observe
an outcome in those candidates who are not selected. This gives rise to an attenuation in the degree of correlation (association referred to as predictive validity) between the selection test score (also known as selection measure or predictor) and the outcome (also known as outcome measure or criterion variable) of interest. This can easily lead to the erroneous conclusion that the selection test is invalid. Indeed it was this effect that led Sir George Smart, at the General Medical Council (GMC) conference on Methods of Examination and Assessment in 1973 to state:
“As predictors of future performance examinations were not highly successful, as was shown by the low correlation of A level GCE grades with subsequent performance in medical school”
(General Medical Council, 1973; McManus, Dewberry, Nicholson, Dowell, et al., 2013) This thesis is thus primarily statistical in focus, evaluating a number of methods for correct-ing for these, and other attenuatcorrect-ing effects, in selection tests. The case of the Professional and Linguistic Assessments Board (PLAB) test, the main route by which International Med-ical Graduates (IMGs) demonstrate they have the required skills and knowledge to work in the UK, is used as a motivating example. Several competing statistical approaches are eval-uated and methods are also developed and extended to support selectors in understanding the effectiveness (or otherwise) of their tests. In this sense the aim is to understand construct-level
predictive validity- an important term introduced byMcManus, Dewberry, Nicholson, Dowell,
et al. (2013)to indicate an ideal situation whereby thetrue(i.e. free of bias and measurement error) underlying relationship between a selection test score and a target criterion could be
es-timated. This construct-level predictive validity may also be viewed as estimate arrived at by correcting the predictive validity estimate for the effects of bias and measurement error.
Further, this thesis explores other statistical challenges related to selection, one being the po-tential capability of using aptitude tests as screening tests to detect popo-tentially poor candidates during the medical school selection process. The term “poor candidates” in this specific context
and motivating example in the thesis refers tothose applicants who present a high risk of failing
at least one exam at first sitting during undergraduate medical school training. The concept ofNumber Needed to Reject (NNR)(analogous toNumber Needed to Treatwithin biomedical
health research), introduced by Tiffin, Paton, et al. (2017) for the selection context, estimates
the number of good candidates that would be rejected in order to get rid of one poor candidate during the selection process. The term “good candidates” in this specific context and motivating
example in the thesis refers tothose applicants who are at a very low risk of a specified adverse
outcome (i.e. failing at least one year at medical school). If the aptitude test is a good screening test, then it is expected to be characterised by a low NNR. Notably, from a statistical standpoint, the introduction of the concept of NNR was not accompanied by precision estimates (standard errors and confidence intervals). To address this limitation, several methodological approaches are developed in the thesis with recommendations for when they are most appropriate.
The other statistical challenge explored in the thesis has to do with the problem of statistical “nationalisation” of local medical school outcomes. Oftentimes, at the point of entry, applicants to medical school are selected on the basis of their scores on a national predictor like an aptitude test. However, after graduation, selection for national opportunities, is done (to a large extent) based on local medical school outcomes. For example, in the UK, the Educational Performance Measure (EPM) as a medical school measure based on a ranking of a student within their med-ical school (Medmed-ical School Council, 2017a). However, this measure is partly used to select
candidates for the nationalFoundation Programme(Foundation Programme, 2017). Likewise,
attempts to establish the validity of predictors for medical selection, the outcomes used are
The use of local measures of performance as proxies for national ones may lead to bias and incorrect inference. To correct for this, an exploration of potential methodology for adjusting local measures in order to “nationalise” them is worthwhile. In the thesis, this is referred to as “Peer Competition Rescaling (PCR)”, a term coined byTiffin and Paton (2017). The sta-tistical potential for the usefulness of PCR and future research implications are detailed in the thesis. For both the NNR and PCR, the United Kingdom Clinical Aptitude Test (UKCAT), the most widely used aptitude test for medical selection in the UK, is used as a motivating example.
Although the project is primarily statistical in focus it is important to contextualise the work. Thus, in this background section there is a brief overview of the main current selection ap-proaches used in medical education, with a more expanded section on the use of aptitude test-ing.
1.1. Medical selection in the UK context
Historically, selection of medical school students in the UK (as elsewhere) has been primarily based on educational achievement. Specifically, in the UK, students generally sit their Gen-eral Certificate of Secondary Education (GCSE) at around the age of 16 years. Many go on to study for their General Certificate of Education Advanced Level (A-level) exams which they take at around the age of 18 (Wright and Bradley, 2010). Thus, for most school leavers from England and Wales (Scotland has a different examination system based around Scottish High-ers) applying for medical school, they will not have obtained their A-level results at the time of application. Thus, in most cases, provisional offers are made on the basis of their GCSE results and predicted A-level grades. Applicants must then achieve the required A-level grades, specified by the medical school at the time of provisional offer, in order to matriculate. Overall, selection based on prior educational achievment has been a relatively effective approach as re-search has consistently observed that this factor predicts undergraduate performance, scores on any subsequent postgraduate or licensing examinations and career progression (Benbassat and Baumal, 2007). In recent times, however, student selection based on A-level grades has been
complicated by the fact that an increasing number of students obtain top grades at A-level which makes it difficult for medical schools to discriminate applicants due to their relatively homo-geneous score distribution. It has also been found that selection based on A-level performance favours applicants from selective schools. Moreover, many school leavers apply to medical school with other education qualifications including International Baccalaureate and Scottish Highers. This is further complicated by the fact that medical schools also admit entrants who may not be hailing directly from school (Ferguson, James, and Madeley, 2002; James, Yates, and Nicholson, 2010; McManus, Powis, et al., 2005).
Consequently, efforts have been directed towards adjusting for A-level bias in order to com-pensate for the fact that A-level performance may reflect resource deprivation, demographic, social and quality of secondary school differences rather than an applicant’s true ability. Un-fortunately applicants from non-selective secondary schools have been found to be underrep-resented in UK medical schools compared to their representation in society even after such adjustments (Wright and Bradley, 2010). In fact, it was recently highlighted that 80% of those studying medicine in the UK applied from only 20% of the countrys secondary schools a vast majority of which are selective (Medical School Council, 2014). Although these applicants from selective secondary schools are much more likely to be selected for medical school, they tend to underperform compared to their counterparts from non-selective schools (McManus, Powis, et al., 2005). In light of these circumstances, other evidence-based and fair selection procedures that may be used singly or in combination with A-level have been considered (Ben-bassat and Baumal, 2007).
In the UK, this search led to the adoption of UKCAT in 26 UK medical schools in 2006 for applicants starting their studies in 2007. Since then, a majority of UK medical schools have required applicants to sit for the UKCAT as tool for selection for entry since the academic year 2007-2008. The UKCAT was developed by a consortium of medical schools along with the commercial testing company Pearson VUE, a global computer-based testing company that is part of Pearson plc. The UKCAT is delivered worldwide through Pearson VUE’s high street
test centres. The UKCAT is required for admission into UK medical and dentistry schools from applicants in the UK, EU and a majority of other countries outside the EU. Exemptions on ge-ographical grounds may be considered in exceptional cases if an applicant lives or is educated in a country where UKCAT is not offered and it is not possible for the said applicant to sit for UKCAT in a neighbouring country. Applicants are required to sit for UKCAT once in each test cycle. Rejected applicants to UK medical and dentistry schools in a given UCAS cycle who wish to reapply in subsequent UCAS cycles are required to retake the test. Applicants can take UKCAT at their convenience any time between July and October every year (specific dates in those months may vary from year to year), the standard duration of the UKCAT is
120 minutes although applicants with special needs such as dyslexia, dyspraxia, dysgraphia,
dysorthographia, attention deficit disorder or working memory deficit may be given an ad-ditional 30 minutes to complete the test by registering for the UKCATSEN (SEN stands for Special Educational Needs). Applicants from the UK and EU may be eligible for bursaries under certain specified circumstances (Adam, Bore, Childs, et al., 2015; Lynch et al., 2009; UKCAT, 2015; Wright and Bradley, 2010).
The UKCAT assesses a range of mental abilities identified by medical and dental schools as important. There is no curriculum or science content as the test examines aptitude and hence cannot be revised for. Nevertheless, prospective applicants can boost their performance through
practice. The test consists of five subtests, four of which test forcognitive skillsand one which
tests for situated-cognitive skills. The four cognitive based subtests are Quantitative
Reason-ing (QR), Decision Analysis (DA), Verbal ReasonReason-ing(VR)andAbstract Reasoning (AR) while
situated-cognitive based subtest is theSituation Judgment Tests (SJTs). QRassesses an
appli-cants ability to critically evaluate information presented in numerical form, DA assesses the
ability to make sound decisions and judgements using complex information, VR assesses the
ability to critically evaluate information that is presented in a written form, AR assesses the
use of convergent and divergent thinking to infer relationships from information while SJTs
measures the capacity to understand real world situations and to identify critical factors and appropriate behaviour in dealing with them. Each of the subtests is in a multiple-choice format
and is timed separately. Each of the cognitive subtest have their raw score converted to a scale score that ranges from 300 to 900. Therefore total scale score for all of the cognitive subtests range from 1,200 to 3,600. The non-cognitive SJTs raw scores are expressed in one of four bands ( band 1=highest, band 4=lowest ) each with a unique interpretation of performance. The results of the test are valid for the particular UCAS admission cycle. The UKCAT is used by universities depending on the selection procedure in place. Some universities consider the total score of the cogntive subtests, others consider the individual subtests and may even
set a threshold for each subtest, some use UKCAT in addition to prior educational
achieve-ment, personal statementsandinterview performance, others only use UKCAT to discriminate applicants who have scored equally at some point in their selection process while a small num-ber of universities use UKCAT to widen access by considering applicants who do not stand a chance of progressing through their selection process but have performed well in the UKCAT (Adam, Dowell, and Greatrix, 2011; UKCAT, 2017). During inception of UKCAT, concerns were raised regarding the lack of information of its predictive validity, the perception that an additional unnecessary hurdle was being introduced for entry into medical and dental school. It was also claimed that the registration fee was prohibitive for poor students even though bur-saries were available for eligible students in the UK and EU (Wright and Bradley, 2010)(costs
in 2017 range between£65 and£115 depending on the time of the year one is scheduled to sit
the UKCAT test and whether the test is to be taken in or outside the EU (UKCAT Consortium, 2017)).
Evidence for the performance of the UKCAT has been mixed although largely positive. Most studies have found the UKCAT to be (modestly) predictive of undergraduate medical school performance. For instance, a study conducted by the University of Aberdeen and University of Dundee medical schools showed that there was no correlation between UKCAT and Year 1 performance. This finding was the first study that examined the predictive validity of UKCAT. It was noted that since the study was based on two medical schools, it would prove difficult to make generalisations over the entire set of medical schools which adopted the use of UKCAT in the UK. In addition, the study was conducted during a period at which non-cognitive parts
of the UKCAT were still going through development hence some predictive aspects of UKCAT may have been lacking as a result. Nevertheless, it was concerning that the findings failed to find moderate predictive validity demonstrated by similar selection tools (Lynch et al., 2009). A later study established that UKCAT has predictive validity for Year 1 and Year 2 of medical school (in all but one knowledge based examinations). No predictive validity for OSCE was detected which may be indicative of lower reliability of Objective Structured Clinical Exami-nation (OSCE) or that UKCAT is more useful in predicting performance in pre-clinical years. In addition, UKCAT has been found to be less sensitive to school type attended (Wright and
Bradley, 2010). Other findings have shown evidence indicative of the UKCAT’sDAsubtest and
UKCAT overall total scores predictive validity for Year 1 and Year 2 overall exam score. In re-cent years, there have been notable studies that have looked into the performance and predictive validity of the UKCAT (Husbands, Mathieson, et al., 2014; James, Yates, and Nicholson, 2010; Lala, Wood, and Baker, 2013; McManus, Dewberry, Nicholson, and Dowell, 2013; McManus, Dewberry, Nicholson, Dowell, et al., 2013; Sartania et al., 2014). A summary of the findings from the studies may be viewed in Table 8.2 in the Technical Appendices.
1.2. Towards understanding construct-level predictive
validity, uncertainty for Number Needed to Reject (NNR)
and Peer Competition Rescaling (PCR)
Predictive validity estimated as a correlation coefficient between selection test score (predictor) and outcome (criterion) measure is widespread but fraught with challenges. Problems arise due to the fact that whilst the selection test is administered on an entire pool of applicants, validation of the selection test (predictor) by use of predictive validity is applied to only those who entered medical school. This is because the outcome (criterion) is only observed for the entrants. Con-sequently, the entrants have high but less variable scores on selection test scores (predictor) than the entire pool of applicants, a concept referred to as range restriction. This range restriction
causes the estimated correlation coefficient to be artificially deflated (attenuated or downward bias) and may lead to the conclusion that there is modest or at worst no association between selection and outcome measures (McManus, Dewberry, Nicholson, Dowell, et al., 2013). The deflation (downward bias) of the estimated correlation may also be exacerbated by measure-ment error, a problem that stems from imperfect reliability (Fisher, 2014; Neter et al., 1996). There have been attempts to deal with attenuated correlation starting with Spearman over a century ago whose work on the subject formed a foundation for further research on methods for dealing with the problem. This led to the contribution of knowledge regarding how to ad-just for attenuation, computation of associated standard errors and confidence intervals for the dis-attenuated correlation coefficient (Bedeian, Day, and Kelloway, 1997; Behseta et al., 2009; Charles, 2005; Mendoza and Mumford, 1987a). A detailed exploration of these methods
to-gether with a treatment of downward bias in associations estimated byβ regression coefficients
are covered in chapter 3.
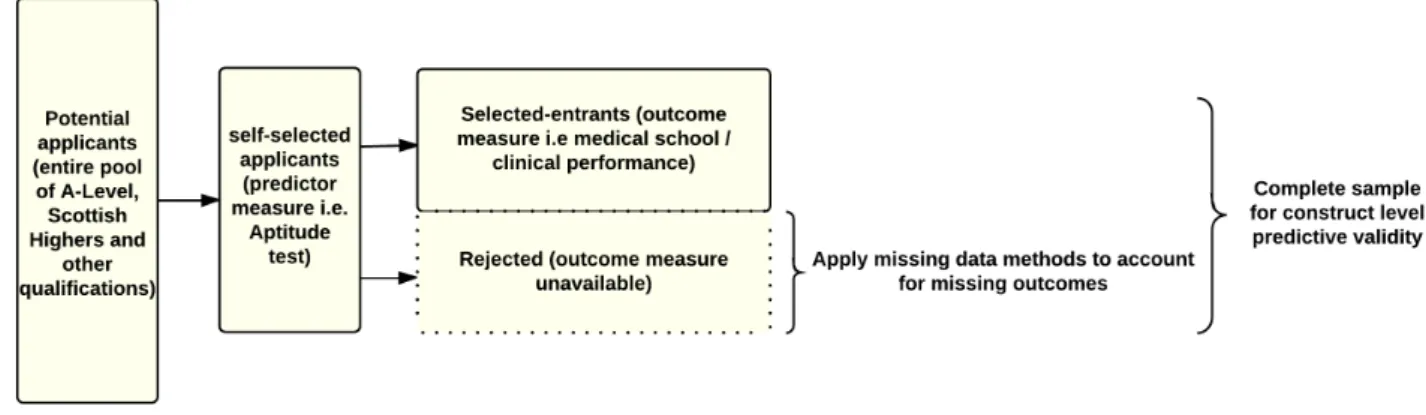
Recent proposals from continuing research for dealing with downward bias in the correla-tion coefficient due to range restriccorrela-tion have been treating the non-existent outcome (criterion) scores of the rejected (non-selected) applicants as a special case of missing data (Mendoza, Bard, et al., 2004; Pfaffel, Kollmayer, et al., 2016; Pfaffel, Schober, and Spiel, 2016; Pfaffel and Spiel, 2016; Wiberg and Sundstr¨om, 2009). Figure 1.1 is a schematic representation of the missing data paradigm for estimating construct-level predictive validity that makes use of the selection context in the UK.
Dealing with the effects of range restriction using missing data handling methods will lead to construct-level predictive validity (association, in this thesis correlation or regression coeffi-cient, between the selection test score (predictor) and outcome (criterion) measure of interest that is free of the effects of range restriction and/ or measurement error). Generally, the miss-ing data handlmiss-ing methods in the literature may be classified into five broad categories. These are deletion methods, filling-in (imputation) methods, weighing of observations, ignoring of the missing data process of the data and the more complex joint modelling of the missing data and measurement(observed) data process. The validity of these methods in estimating the construct-level predictive validity of selection tests under different selection designs and de-grees of strictness of the selection process are explored in chapter 4. The idea therefore will be to extend the statistical methodologies that exist in the literature for estimating construct-level predictive validity by viewing it as a special case of a missing data problem. In addition, view-ing uncertainty for NNR and explorview-ing the viability of PCR as other special cases of missview-ing data problems within the selection context, presents an opportunity to apply ,in a novel way, existing statistical methodology for handling missing data.
1.3. Aims
1. To extend statistical methodology for the more accurate appraisal of construct-level pre-dictive validity in selection tests, with the aid of a contrived example using the Profes-sional and Linguistic Assessments Board (PLAB) data.
2. Developing approaches to “nationalising” local outcome measures via “Peer Competition Rescaling (PCR)” using UKCAT as a motivating example.
3. Given aims (1) and (2) above, develop approaches to estimating uncertainty for the esti-mates of the Number Needed to Reject (NNR) for the UKCAT as a motivating example.
1Figure 1.1 and all other conceptual diagrams that do not show results of statistical analyses are constructed in
1.4. Objectives
1. Conduct reviews of the existing literature regarding
a) The predictors of undergraduate medical school performance used in the selection of medical school entrants.
b) The predictive validity and possibly construct-level predictive validity of the various aptitude tests used in medical selection internationally (restricted to cognitive tests of fluid intelligence and/or semantic knowledge).
c) Statistical methodologies for adjusting for attenuation observed in the association between predictors (selection test) and outcomes (criterion) in the selection context. 2. To compare and contrast a variety of approaches for the establishment of construct-level
predictive validity in selection tests by use of simulated data.
3. To apply these methods in a contrived example using real-world data in order to estab-lish their potential for predicting performance in medical school applicants, given the challenges of “missing data” especially related to unobserved outcomes in unsuccessful applicants.
4. To apply existing statistical methodology in a novel way in the estimation of the uncer-tainty for Number Needed to Reject (NNR) and Peer Competition Rescaling (PCR) by viewing them as special cases of “missing data modelling” within the selection context.
1.5. Chapter summary
In this preface, the statistical focus and scope of this thesis have been introduced. In particular, the statistical challenges of the estimation of construct-level predictive validity, NNR and PCR are covered. In the next chapter, the main methods used in the selection of medical school entrants worldwide are briefly summarised. In addition, findings of literature review conducted to meet objectives 1(a) and 1(b) outlined in section 1.4 will be discussed.
performance used in medical selection
and construct-level predictive validity
of aptitude tests
In this thesis chapter, findings of literature reviews conducted in line with objectives 1(a) and 1(b) of the objectives listed in section 1.4 are presented. The findings for objective 1(a) relat-ing to predictors of undergraduate medical school performance used to select medical school
entrants were notably similar to findings from a recent systematic review conducted by
Pat-terson, Knight, et al. (2016) entitled How effective are selection methods in medical educa-tion? A systematic review. In their publication,Patterson et al. summarised their findings into
two categories, namelyshort-listingandfinal-stageselection methods. Under the short-listing
methods, wereaptitude tests, prior academic attainment, personal statements, references,
Sit-uation Judgment Tests (SJTs)s, personality assessment and Emotional Intelligence (EI)while
final-stage methods consisted mainly of the different forms of interviews such as traditional,
structuredandMultiple Mini Interviews (MMIs). Therefore, the findings of the literature review for objective 1(a) in this thesis chapter are presented using the same categorisation in section 2.1 and 2.2 respectively. In addition, findings of the literature search for objective 1(b) relating to the construct-level predictive validity of the various aptitude tests used in medical selection are presented in section 2.3.
For the literature review related to objective 1(a), two sources,Google Scholar(Google Scholar,
2017) andWeb of Science (previously known as Web of Knowledge)(Clarivate Analytics, 2017)
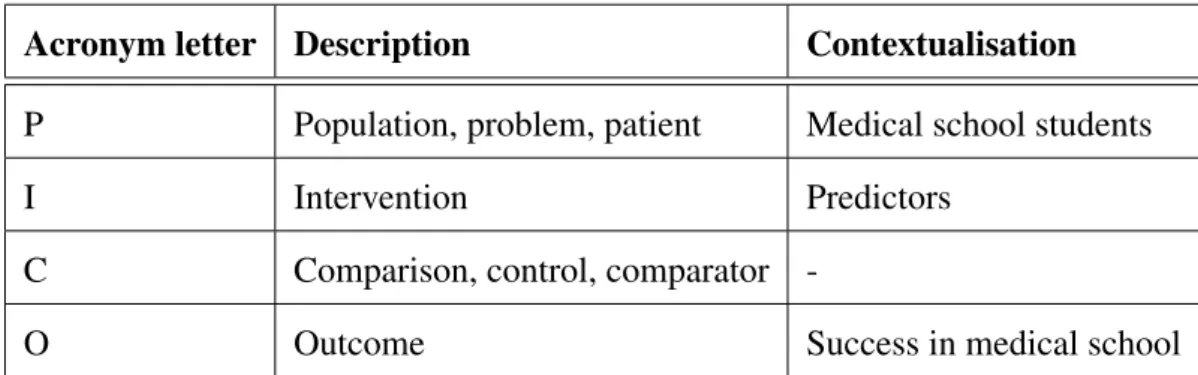
were selected. The “PICO” methodology (Centre for Reviews and Dissemination (CRD), 2008) was used to formulate the search terms as demonstrated in Table 2.1.
Acronym letter Description Contextualisation
P Population, problem, patient Medical school students
I Intervention Predictors
C Comparison, control, comparator
-O Outcome Success in medical school
Table 2.1.:The PICO methodology contextualised in the review of literature on predictors of
medical school performance
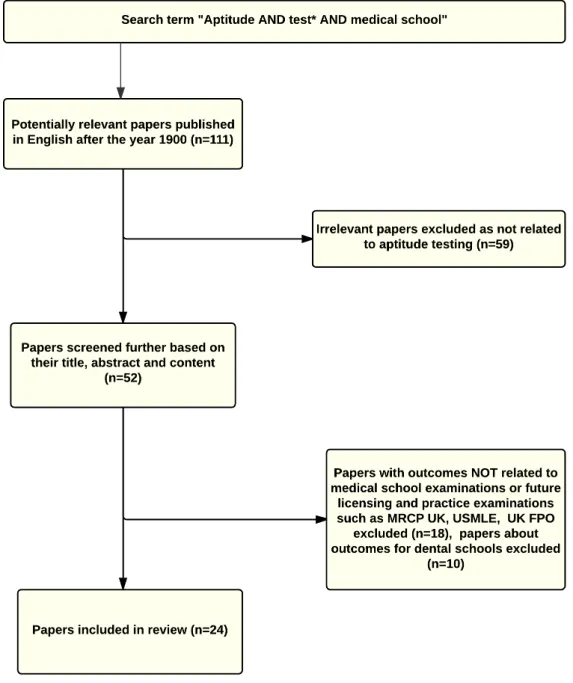
Figure 2.1 shows the search term, the inclusion and exclusion process for the review conducted for objective 1(a). In all, 97 papers were considered to be relevant for the review. The predictors identified in the review are summarised in following sections 2.1 and 2.2.
Figure 2.1.:Flow chart of papers included in the review of predictors of undergraduate medical school performance used in selection of medical school entrants
2.1. Predictors of undergraduate medical school
performance used in the short-listing stage of selection
2.1.1. Prior educational achievement
Examinations deemed to be a reliable measure of academic (or scholastic) ability of applicants are in use across many countries. In Australia, educational performance at secondary school has been shown to have predictive validity for medical school outcomes (Mercer and Puddey, 2011). This is collaborated by evidence from a different study in an Australian university that showed that an integrated selection procedure for medical school that utilised prior educational achievement was predictive of learning outcomes (Simpson et al., 2014). This is also supported by evidence from a South Korean study that reported that pre-admission GPA was a reliable predictor during medical school and postgraduate clinical performance (Kim, Chang, et al., 2016). An early study into the effect of prior educational achievement in the USA found that almost without exception, high achieving pre-medical students tend to be high achieving med-ical school students (Buehler and Trainer, 1962).
In the UK, General Certificate of Education Advanced Level (A-level) and General Certificate of Secondary Education (GCSE) have been demonstrated to have a strong and persistent but diminishing predictive validity for all the undergraduate and postgraduate medical school ex-aminations. A different study found that GCSE had greater predictive validity than A-level for undergraduate and postgraduate medical school examinations with incremental predictive va-lidity for clinical and post-graduate performance (McManus, Woolf, et al., 2013). In addition, the predictive validity of A-level and GCSE grades were found to be higher than that of aptitude tests (McManus, Dewberry, Nicholson, Dowell, et al., 2013) although the observed differences in ability of medical school entrants based on this exam disappeared or reduced during med-ical school (Thiele, Pope, et al., 2016). In India and the Czech republic, prior educational performance has also been found to be a good predictor of overall medical school performance (Gupta, Nagpal, and Dhaliwal, 2013; ˇStuka et al., 2012). A Saudi Arabian study found that final
high school exam scores were more predictive of medical school pre-clinical performance than aptitude tests (Al Alwan et al., 2013). A different study in Saudi Arabia found that high school scores were not predictive of medical school clinical performance (Salem et al., 2016). A study at Leicester-Warwick medical schools concluded that graduate entry students performed as well as their undergraduates counterparts in final examinations despite having lower General Certificate of Education Advanced Level (A-level) grades and a shorter four year accelerated course (Shehmar et al., 2010). A New Zealand study found that the pre-admission GPA had predictive validity for year two and three academic performances and was further predictive of whether or not a medical student would earn a “Distinction” rather than a “Pass” in year four (Shulruf et al., 2012).
The emerging evidence suggests that prior educational achievement is highly predictive of med-ical school performance and subsequent career outcomes, for this reason, prior educational achievement is an important predictor used in the medical school selection process. While this is defensible, caution has been advised by those who argue that prior educational achievement should be used in the selection process in a way that mitigates the barriers that exist against under-represented and disadvantaged groups (Patterson, Knight, et al., 2016).
2.1.2. Aptitude tests
Aptitude tests for medical school selection were first used in the USA in the late 1920s at a time in which concerns about medical school attrition rates of 5% to 50% were rife. Prior to this time, selection to medical schools in the USA had been based on undergraduate edu-cation and sometimes on a high school diploma together with biographical information and recommendation letters. The first aptitude test developed and implemented by physician and
psychologist F.A Moss, the Scholastic Aptitude Test for Medical Schools, was administered
between 1928 and 1946. By 1946, the aptitude test was credited with reducing the attrition rate to 7% based on selection of students purely on academic grounds. This aptitude test later
was administered between 1946 and 1962 (McGaghie, 2002). Thereafter, it later evolved into the Medical College Admissions Test (MCAT) which was sponsored and administered by the Association of American Medical Colleges (AAMC). Table 2.2 shows the timeline and evolu-tion of the MCAT (now used in the USA and Canada) for medical school selecevolu-tion (Eskander, Shandling, and Hanson, 2013).
Since the adoption of the MCAT in the USA, aptitude tests have come into widespread use across the world for medical school selection. For example, in the UK increase of medical applicants with top A-level grades made it difficult for medical schools to conduct selection. In addition, A-level performance had been shown to be biased in favour of female applicants and those from selective secondary schools. This led to the adoption the BioMedical Admis-sions Test (BMAT) and United Kingdom Clinical Aptitude Test (UKCAT), as selection tools in 2003 and 2006 respectively (Emery and Bell, 2009; Ferguson, James, and Madeley, 2002; James, Yates, and Nicholson, 2010; McManus, Powis, et al., 2005). Similar concerns were rife in Ireland about the fairness of selecting medical school applicants based on Irish Leaving Certificate Examination (or equivalent). In 2009 an aptitude test for selection, the Health Pro-fessions Admission Test-Ireland (HPAT-Ireland), was adopted (O’Flynn, Fitzgerald, and Mills, 2013). In Australia the Graduate Medical School Admissions Test (GAMSAT) was adopted as a selection tool into graduate-entry programs in medicine or dentistry in 1996 (Coates, 2008) while the Undergraduate Medical and Health Sciences Admission Test (UMAT) has been in use in New Zealand and Australia since 2003 for selection of applicants into medicine, den-tistry and health science degree programs at undergraduate level (Poole et al., 2012; Puddey and Mercer, 2013). Other examples of aptitude tests used for medical school selection include the Medical and Dental Colleges Entrance Testsin Pakistan, MCAT in Austria, HAM-Nat in
Germany,Saudi Aptitude Testin Saudi Arabia,Konkoorin Iran andEignungstest f¨ur das
Medi-zinstudium in der Schweiz (EMS)or Aptitude test for medical studies in Switzerland (Abbiati, Baroffio, and Gerbase, 2016; Farrokhi-Khajeh-Pasha et al., 2012; Habersack et al., 2015; Hiss-bach, Klusmann, and Hampe, 2011; Khan, Mukhtar, and Tabasum, 2014; Khan, Tabasum, and Mukhtar, 2013).
Predictors used in selection and construct-le v el predicti v e v alidity of aptitude tests
cal Schools and Medical College Admission Test
Test years 1928 to 1946 1946 to 1962 1962 to 1977 1977 to 1991 1991 to 2002 Sub-tests
1. Visual memory Verbal ability Verbal ability Science knowledge Verbal reasoning 2 Memory for content Quantitative ability Quantitative ability Science problems Biological sciences 3 Scientific vocabulary Science achievement Science achievement Skills analysis:reading Physical sciences 4 Scientific definitions Understanding modern society General information Skills analysis: quantitative Writing sample 5 Understanding of written materials
6 Premedical information 7 Logical reasoning
Score range 0-250, 0-275, 0-300, 0-385 200-800 200-800 1-15 1-13, 1-15, J to T for writing sample Question
type
True-False and Multiple choice Multiple choice Multiple choice Multiple choice Multiple choice and writing sample that elicits constructed response
Table 2.2.:The evolution of the first developed aptitude test, the Medical College Admissions Test (MCAT)
The factors that influence the performance of aptitude tests have been studied. In Pakistan, emerging evidence suggests that female and highly economically and academically developed
districts score higher in Medical and Dental Colleges Entrance Tests (Khan, Tabasum, and
Mukhtar, 2013). In the UK, the BMAT has been shown to have predictive validity for the pre-clinical years of medical school (Emery and Bell, 2009). It has been shown that the socio-demographic factors that predict A-level performance also predict UKCAT performance al-though compared to A-level, male and native English speakers fair much better in UKCAT suggesting that the UKCAT may be less sensitive to gender and secondary school type (Tiffin, McLachlan, et al., 2014). A study that examined the use of GAMSAT over a ten year period found it to have high reliability and slightly sensitive to age, gender, level and discipline of pre-vious academic study and language background of the applicant (Mercer, Crotty, et al., 2015). In Austria, it has been shown that male applicants tend to score higher than female applicants on the Austrian version of the MCAT upon completing secondary education (Habersack et al., 2015). In terms of the predictive validity of aptitude tests for medical school performance, the UMAT has less predictive power compared to the GPA although the UMAT has incremental predictive validity when used together with GPA (Poole et al., 2012). A different study on UMAT found that its predictive validity varied between schools, across medical school years, and within sections of the UMAT and socio-economic strata (Edwards, Friedman, and Pearce,
2013; Puddey and Mercer, 2013). The HAM-Nathas been found to be predictive of medical
school performance independent of high school performance although this predictive power is higher in females than in males (Hissbach, Klusmann, and Hampe, 2011).
In the USA, the MCAT has been found to have weak to moderate predictive validity for multiple choice based medical school assessments. The predictive validity of the MCAT was found to be stronger in early years of medical school with no predictive power in the clinical years (Saguil et al., 2015) while another study found that both undergraduate GPA and total MCAT scores were strong predictors in medical school performance throughout medical school (Dunleavy et al., 2013). Another study on the predictive validity of MCAT found that it explained twice as much variance in performance at medical school than undergraduate GPA (Julian, 2005).