Neural Correlates of Early-Stage Visual Processing Differences in Developmental Dyslexia
Lisa M. Levinson
Submitted in partial fulfillment of the requirements for the degree of
Doctor of Philosophy under the Executive Committee of the Graduate School of Arts and Sciences
COLUMBIA UNIVERSITY 2018
© 2018 Lisa M. Levinson All rights reserved
ABSTRACT
Neural Correlates of Early-Stage Visual Processing Differences in Developmental Dyslexia Lisa M. Levinson
Reading requires the successful recruitment and coordination of brain networks to translate visual symbols into phonemes, which are then sequenced to match speech sounds and matched onto semantic representations. Although phonemic awareness is understood to be a core deficit associated with reading disability, neuroimaging has demonstrated an association between poor reading and disruption to various interrelated areas in the brain. This includes one of the major visual pathways, the magnocellular pathway, which contributes to the dorsal pathway in the brain and the processing of motion. For at least two decades, researchers have observed
differences in motion processing, supported by the magnocellular pathway, between individuals with and without dyslexia (Eden et al., 1996; Gori et al., 2016; Livingstone et al., 1991; Wilmer, 2004). Further, psychometric studies report an association between reading ability and dorsal stream sensitivity in adults and in children before and after learning to read (Boets et al., 2011; Kevan & Pammer, 2009). Studies of the development of the major visual pathways have suggested that the magnocellular pathway follows a protracted course of development, which raises the possibility that it is vulnerable to pathological change during development and also has the potential for greater plasticity (Armstrong et al., 2002; Stevens & Neville, 2006).
To explore the potential differences in early-stage visual processing, this dissertation study investigated whether neurophysiological measures, as indexed by event-related potentials (ERP), may differ between adults with and without dyslexia to stimuli tailored to evoke a response from each of two major visual pathways: magnocellular and parvocellular. The P1 component was elicited in response to motion stimuli designed to probe magnocellular pathways,
and the N1 component was elicited in response to color stimuli designed for parvocellular processing. Group comparisons revealed statistically significant group differences in P1 amplitude for the motion/magnocellular condition, but no differences were found for N1 ERP measures for the parvocellular/color condition. Moderate to strong correlations between P1 measures in response to the magnocellular/motion condition were observed in relation to specific behavioral assessments: nonverbal reasoning and memory, orthographic choice, the word
identification subtest from the Woodcock Reading Mastery Test (3rd edition: WRMT-III, Woodcock, 2011), and the sight word efficiency subtest from the Test of Word Reading Efficiency (2nd edition: TOWRE-2, Wagner, Torgesen, & Rashotte, 2011).
These results are indicative of an early-stage visual processing disruption in individuals with dyslexia observable at the level of the brain. Due to the compounding impact of even small disruptions of sensory and cognitive processing on learning, refining our knowledge of the underlying neural mechanisms of reading may permit earlier identification and potentially more focused interventions that could yield better outcomes for struggling readers. Additionally, the association of those differences with measures of word decoding will inform further research into the underlying neural mechanisms that may contribute to dyslexia and skilled reading.
i TABLE OF CONTENTS LIST OF TABLES ... iv LIST OF FIGURES ... v ACKNOWLEDGEMENTS ... vii DEDICATION ... viii 1. INTRODUCTION ... 1 1.1 Developmental Dyslexia ... 1 1.2 Prevalence ... 2 1.3 Characteristics/Subtypes of Dyslexia ... 3
1.4 Co-Occurring Developmental Disorders ... 9
1.5 Evidence Across Languages... 10
1.6 Making Sense of Dyslexia ... 13
2. THE READING BRAIN ... 16
2.1 Anatomy of the Reading Brain ... 17
2.2 Brain Development—Neuroplasticity ... 27
2.3 Neurobiology of Dyslexia ... 30
2.3.1 Structural and Functional Regional and Connectivity Differences in Dyslexia ... 30
2.3.1.1 Post-mortem studies ... 32
2.3.1.2 Structural and functional imaging studies ... 34
2.3.1.3 Event-related potential studies ... 38
2.3.2 Subcortical Differences ... 40
2.3.3 Heritability and the Genetics of Reading Differences ... 42
2.3.3.1 Heritability... 44
2.3.3.2 Genetics ... 45
2.4 Theories of Dyslexia ... 49
2.4.1 The Phonological Deficit Theory of Dyslexia ... 50
2.4.2 Temporal Information Processing Deficit Theory ... 52
2.4.3 The Magnocellular Theory of Dyslexia ... 57
2.4.4 Overview of Cognitive and Biological Explanations ... 60
2.5 Reading and the Visual System ... 61
3. STUDY RATIONALE, RESEARCH QUESTIONS, HYPOTHESES, AND PREDICTIONS... 72
3.1 Research Question One ... 74
3.2 Research Question Two ... 75
4. RESEARCH METHODS AND DESIGN... 76
4.1 Experimental Design... 77
ii
4.2.1 Recruitment and Informed Consent ... 79
4.2.1.1 Verification of developmental dyslexia diagnosis ... 79
4.2.1.2 Statistical power and sample size ... 80
4.3 Measures ... 82
4.3.1 Screenings ... 82
4.3.1.1 Snellen chart ... 82
4.3.1.2 Ishihara Color Blindness Test ... 82
4.3.1.3 Contrast Sensitivity Function Test... 83
4.3.2 Qualitative Measures ... 83
4.3.2.1 Edinburgh Handedness Inventory... 83
4.3.2.2 Participant questionnaire ... 84
4.3.3 Quantitative Measures ... 84
4.3.3.1 Standardized assessments ... 84
4.3.3.1.1 Comprehensive Test of Phonological Processing ... 84
4.3.3.1.2 Woodcock Reading Mastery Test—Revised ... 85
4.3.3.1.3 Test of Word Reading Efficiency—Second Edition ... 85
4.3.3.1.4 Wechsler Adult Intelligence Scale—Fourth Edition ... 85
4.3.3.2 Non-standardized measures ... 85
4.3.3.2.1 Direction discrimination task ... 85
4.3.3.2.2 Orthographic and homophone choice tasks ... 88
4.3.3.2.3 Nonverbal visual reasoning/memory ... 88
4.3.3.3 ERP experimental stimuli... 89
4.3.3.3.1 Motion Null Task—Equiluminant color stimulus parameter calibration ... 90
4.3.3.3.2 EEG color stimulus for the color condition of the experiment ... 91
4.3.3.3.3 EEG motion stimulus for the motion condition of the experiment ... 92
4.4 Experimental Equipment and Procedures ... 94
4.4.1 Equipment and Data Recording ... 94
4.4.1.1 Peripheral equipment ... 94
4.4.1.2 Electrode nets ... 94
4.4.2 Participant Lab Visit and Data Collection Overview ... 95
5. DATA PROCESSING AND ANALYSIS ... 99
5.1 Pre-/Post-Processing ... 99
5.2 Data Analysis Protocol ... 100
6. RESULTS ... 103
6.1 Participants ... 103
6.2 Results ... 104
6.2.1 Visual Acuity, Color, and Contrast Screening Results ... 104
6.2.2 Qualitative Measures Results ... 104
6.2.2.1 Edinburgh Handedness Inventory... 104
iii
6.2.3 Quantitative Results ... 105
6.2.3.1 Assessment measures ... 105
6.2.3.2 Behavioral task results ... 109
6.2.3.2.1 Direction discrimination task ... 109
6.2.3.3 ERP results ... 112
6.2.3.3.1 Group analysis motion/magnocellular condition ... 114
6.2.3.3.1.1 P1 amplitude/latency mean measures for the magnocellular condition ... 115
6.2.3.3.1.2 P2 amplitude/latency magnocellular condition ... 115
6.2.3.3.2 Group analysis color/paravocellular condition ... 117
6.2.3.3.2.1 N1 amplitude/latency mean measures for the parvocellular condition ... 117
6.2.3.3.2.2 P2 amplitude/latency parvocellular condition ... 118
6.2.3.3.3 Neurophysiological correlations with behavioral measures ... 119
6.2.3.3.3.1 Pearson’s correlation analysis—Significant findings ... 122
6.2.3.3.3.2 Spearman’s correlation analysis—Significant findings ... 122
6.2.3.4 Summary of Study Findings ... 122
7. DISCUSSION ... 125 7.1 Study Limitations ... 133 7.2 Future Directions ... 134 7.3 Conclusions ... 135 REFERENCES ... 136 APPENDICES Appendix A – Further Explanation of the Motion Null Technique Used for Individual Equiluminant Color Parameter Calibration ... 166
Appendix B – IRB Approval Letter ... 168
Appendix C – What Participants Can Expert ... 169
Appendix D – Informed Consent ... 173
Appendix E – Participant Questionnaire and Responses ... 179
Appendix F – Orthographic Choice Task ... 189
Appendix G – Homophone Choice Task ... 190
Appendix H – Non-Verbal Visual Reasoning/Memory ... 196
iv
LIST OF TABLES Table
1 Cognitive Processes Associated With Dyslexia in the Literature ... 5
2 Dyslexia by Developmental Phase ... 7
3 Neurocognitive Model ... 20
4 Classical View of Reading Circuits in the Brain ... 21
5 Planned Group Comparison ... 78
6 Sample of Group Size in Related Studies ... 81
7 Parameters for the Direction Discrimination Task ... 87
8 Analyses Evaluating Between-Group Differences ... 110
9 Between-Group Differences on the Direction Discrimination Task ... 111
10 P1 and P2 Amplitude and Latency Group Measures for the Motion/ Magnocellular Condition ... 114
11 N1 and P2 Amplitude and Latency Group Mean Measures and Standard Deviations for the Parvocellular/Color Condition ... 117
12 R-squared Values Derived From Scatterplots to Determine Linearity ... 120
13 Relationships Between Behavioral Measures and Amplitude/Latency Reported... 121
14 Summary of Mean Amplitude/Latency Measures for All Components/Conditions, by Group ... 124
v
LIST OF FIGURES Figure
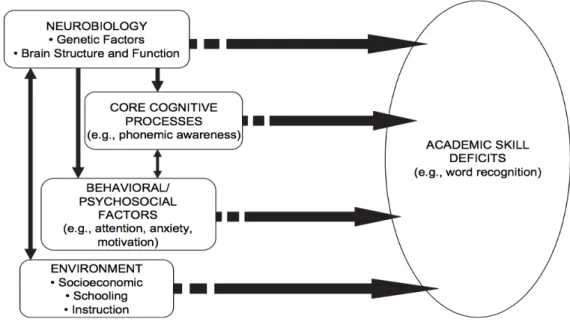
1 Influences on academic deficits ... 16
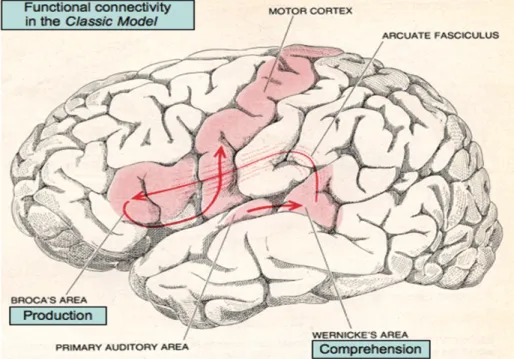
2 Classic language network model ... 18
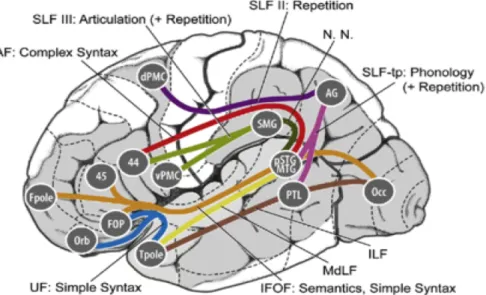
3 Neurocognitive model of neural patterns supporting auditory language in the brain, upon which networks for reading are superimposed ... 20
4 Cortical brain areas associated with dyslexia ... 31
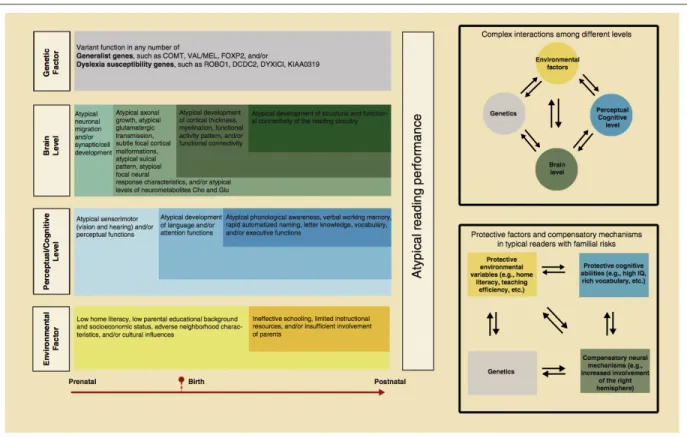
5 Prenatal to postnatal developmental timeline that summarizes the multiple levels of risk factors thought to contribute to atypical reading performance ... 49
6 How lower gamma frequency ranges facilitate top-down attentional mechanisms ... 57
7 Visual processing ... 63
8 Interactive Model ... 65
9 Disrupted magnocellular processing ... 70
10 Direction discrimination task ... 87
11 Steps for delivering the EEG color stimulus... 92
12 Step for delivering the EEG motion stimulus ... 93
13 Sensor layout of the 128-channel hydrocel geodesic sensor net ... 101
14 Questionnaire responses ... 105
15 Group differences for the orthographic choice task ... 106
16 Group differences for the TOWRE-2 SWE assessment ... 107
17 Group differences for the TOWRE-2 PDE assessment ... 108
18 Group differences for the Woodcock Reading Mastery Test Word Identification assessment ... 109
19 Time window for the P1 component ... 112
vi Figure
21 Time window for the P2 component ... 113 22 The P1/P2 waveform for the magnocellular/motion condition ... 116 23 The N1/P2 waveform for the parvocellular/color condition ... 118
vii
ACKNOWLEDGMENTS
From my very first class with Dr. Gordon, I have been given the opportunity to challenge my thinking, expand my perspectives and hone both skills that I had, as well as skills newly acquired. Many, many people have helped me along the way. The generosity of others, sharing their time and insights, is beyond all expectations. I only hope to pay it forward, supporting others who choose to travel this road.
Early on, as I struggled to create the stimuli for this experiment, I miraculously found my way to Dr. Norma Graham. I am ever grateful for her mentorship, infinite wisdom and practical
problem-solving. Gaelen Hadlett and I spent countless hours working to generate the stimuli in Python and it almost worked. Ultimately, it was Psykinematix that delivered the stimuli and I am forever grateful for the assistance I received from the technical support team all the way from Japan.
I have been so lucky to go through the ranks with some amazing people. Through all our endeavors, it was incredible to be at such a stage of discovery with so many like-minded individuals including Trey Avery, Fel Garcia, Paula Garcia, Heather Green, Reem Khamis-Dakwar, Airey Lau, Chaille Maddox, Dayna Moya, Mel Randazzo, Guannan Shen, Lauren Shuffrey, Laura Sanchez, and Grace Kwak Wang. There have also been a number of interns over the years who I would be remiss not to mention, for they help to make it all happen. I have so enjoyed working with you in the lab; a big thank you to Alexis Becerra, Mary “Molly”
Cosgrove, Meriah DeJoseph, Raleigh Edelstein, Alanoud Fetis, Stephanie Fritz, SuWon Jung, Sushma Narayan, Neke Nsor, Sutha Raman, Andreysis Rodriguez and Sarah Ximena-Rojas. This journey included some key individuals. Dr. Trey Avery has fixed more issues than I can count. Dr. Heather Green, from the day we selected your first pair of sneakers, I have cherished our friendship! Dr. Dayna Moya Sepulveda, my go-to tech person. Dr. Chaille Maddox, I will travel with you anywhere. Dr. Molfese, thank you for navigating the world of ERP data analysis with me. Dr. Lauren Shuffrey, where do I begin? Thank you all for seeing me through.
I have had the incredible privilege to eavesdrop on the brains’ of the wonderful souls who participated in my pilot and dissertation study. To every participant who arrived in the lab, shared a bit of their story -- I have endless gratitude for your time and patience.
This work would not have been possible without the support of our dedicated staff in the Department of Biobehavioral Sciences. Maria Lamadrid, Erynn Lowery, and Yvonne Wallace thank you for the baked goods, Excedrin, friendship and support.
A special thanks to my dissertation committee members: Dr. Karen Froud, Dr. Peter Gordon, Dr. Norma Graham, Dr. Carol Scheffner Hammer, and Dr. Peter Molfese.
Finally, I want to thank Dr. Karen Froud. You welcomed me into the world of research and gave me time and space to learn more than I could have imagined. Your patience when things failed and enthusiasm when they worked helped me to reach this goal. It was, however, the journey that transformed me, and your influence will be with me always.
viii DEDICATION
"Biology gives you a brain. Life turns it into a mind."
Jeffrey Eugenides (American Pulitzer Prize-winning novelist; 1960 -)
For me, the biology started with my mom and dad, Janet E. Rosenthal and Robert E. Paul, who were also fairly influential in nurturing my mind. I am forever grateful for the time we shared and miss them every day. I am grateful to them for cultivating my curiosity, unconditional love, and emphasizing the importance of searching out the things in life that fill it with meaning. My siblings have traveled many years with me. Through thick and thin, we have been there for each other and this endeavor of mine is no exception. Alec B. Paul, Elaine P. Schaefer, Emily C. Pawlikowski and their wonderful families have in big and small ways kept me sane and helped me to power on. A special call out to my niece Isabel, and nephews Ellis and Matty, who showed a level of support for my work that makes me forever their biggest fans.
Many individuals have become family along the way, my step father George Rosenthal, my step mother Chris Hammil-Paul, my in-laws Bernice and Norman Levinson and my husband’s siblings, Richard and Dale and their amazing families. I got lucky for sure.
My two incredible children, Drew A. Levinson & Remi E. Levinson, have inspired me to work hard to be the change I wish to see in the world. It is through them that I realized the most profound sense of love. I am so proud of who they are becoming, and thank them for all of their tremendous support.
And then there is my husband and long-time partner in crime, Joel A. Levinson. Who when he said, “through sickness and health,” had no idea it would also include a Ph.D. Your patience, sacrifices, sense of humor and boundless love is exactly why, “when I fell in love it would be forever.”
While I am not sure anyone in my family or my friends understands why I did this, or even exactly what I did, I dedicate this colossal amount of work to you all, because without you, I would just be a blob of biology.
1
1. INTRODUCTION 1.1 Developmental Dyslexia
The heterogeneous nature of dyslexia and lack of consensus regarding the underlying cause(s) have resulted in a definition of this developmental disorder that focuses on symptoms. This complicates both early identification of those with the disorder and provision of effective interventions for affected individuals. A definition of dyslexia was proposed by the Board of Directors of the International Dyslexia Association (IDA) and adopted by the National Institute of Children’s Health and Human Development (NICHD) in 1994 for use in research. In 2002, it was revised and revisited in 2016 at the IDA conference (Dickmen, 2017); however, the
definition from 2002 stands and states:
Dyslexia is a specific learning disability that is neurobiological in origin. It is characterized by difficulties with accurate and/or fluent word recognition and by poor spelling and decoding abilities. These difficulties typically result from a deficit in the phonological component of language that is often unexpected in relation to other cognitive abilities and the provision of effective classroom instruction. Secondary consequences may include problems in reading comprehension and reduced reading experience that can impede growth of vocabulary and background knowledge. (https://dyslexiaida.org/definition-of-dyslexia/)
Similarly, the Diagnostic and Statistical Manual of Mental Disorders—Fifth Edition (DSM-V) (American Psychiatric Association, 2013) also indicates that the term dyslexia is “used to refer to a pattern of learning difficulties characterized by problems with accurate or fluent word recognition, poor decoding, and poor spelling abilities” (p. 37).
The DSM-V does not attribute observed symptoms of dyslexia to specific causes beyond a neurodevelopmental basis, whereas IDA and NICHD’s definitions attribute the symptoms to deficits in the phonological component of language and consider the consequences of such deficits on academic skill growth. While these kinds of clinical definitions serve the primary
2
purpose of identification for remediation, the symptoms identified may have multiple causes. Additionally, both definitions either indirectly or directly indicate that a child must be
performing below expectations or poorly relative to peers. One of the goals of identification and remediation should be the identification of at-risk children before they have experienced reading failure. This would minimize the consequences of such failures, which often include poor self-esteem and low academic confidence resulting from limited reading experience and access to curriculum (Humphrey & Mullins, 2002; Ingesson, 2007; Ridsdale, 2005; Stanovich, 1986).
Word level reading is a complex behavior, sub-served by many sensory processes and cognitive skills (see Schlaggar & McCandliss, 2007; Wandell, Rauschecker, & Yeatman, 2012). According to Peterson and Pennington (2012) and Shaywitz, Escobar, Shaywitz, Fletcher, and Makuch (1992), reading ability exists on a continuum such that individuals with dyslexia constitute the lower end of a normal distribution. To better understand reading and reading disability towards the goal of a fully literate citizenry, it is essential to continue to build our collective knowledge of the underlying neural mechanisms that support reading.
1.2 Prevalence
Prevalence rates for dyslexia vary, largely due to how the disorder is defined as well as the criteria and purposes of identification (clinical or research). It is estimated that 13-14% of students nationwide qualify for special education services; of those students, half are classified with a learning disability; and 85% of those have a primary disability related to language/reading processing (Moats & Dakin, 2008). Up to 15-20% of the U.S. population is thought to struggle with slow reading speed, poor spelling, and poor writing (Moats & Dakin, 2008). Shaywitz and
Shaywitz (2005) suggest that, from an epidemiological perspective, dyslexia fits a dimensional
3
population, with the lower end of the continuum representing those who struggle to learn to read.
Prevalence is, therefore, hard to measure as there is limited understanding of how individual
differences interact with formal education (Butterworth & Kovas, 2013). Estimates of the prevalence of dyslexia are calculated based on a variety of sources including epidemiological studies, survey, child count, and research, often varying state to state and sometimes school to school (Interagency Committee on Learning Disability, 2011). The typical prevalence figure reported is between 5-17% (Shaywitz et al., 1998); however, without consistent criteria for identification, reported prevalence rates can be challenged.
1.3 Characteristics/Subtypes of Dyslexia
Over 20 years of research have made it clear that dyslexia is not a unitary phenomenon. Accordingly, a variety of skills are evaluated to identify children with dyslexia. These include measures of phonological ability (phonemic awareness, phonic decoding); fluency (slow, error-prone reading aloud); processing speed (rapid automatized naming); orthographic skills
(misspellings, distinguishing legal and illegal letter strings); working memory (nonword repetition, memory span tasks); and language skills (vocabulary, syntax, stress, and intonation when reading aloud) (Seidenberg, 2017).
Scores on specific assessments tend to reveal patterns of discrepancies between verbal skills and reading comprehension, or difficulties in both areas, and frequently also involve challenges in focusing and attending (Kilpatrick, 2015). While phonological awareness and phonic decoding are typically amenable to intervention (e.g., Bhat, Griffin, & Sindelar, 2003; Truch, 1994), problems with rapid automatized naming and phonological working memory are not usually directly remediated and are associated with poor outcomes (Kilpatrick, 2015).
4
Elliott and Grigorenko (2014) pointed out that many additional symptoms or
characteristics of dyslexia have been described in the research literature, including poor verbal memory, ordering/sequencing, sense of rhythm, concentration, and phonic skills. Individuals with dyslexia are frequently identified as having impairments in rapid information processing and verbal fluency as well as difficulties with speech, language, and mental calculations. Inconsistent hand preference and letter reversals are also associated with dyslexia (Elliot & Grigorenko, 2014). The research on reading and reading disability covers a range of cognitive processes that have been used to index the problems associated with dyslexia. Table 1 (following page) highlights some of this research, which seeks to understand how a number of underlying cognitive processes might contribute to dyslexia.
The heterogeneity observed in dyslexia can be explored from a top-down, hypothesis-driven perspective, where subtypes are identified through the collection of standardized assessments that compare individuals with and without dyslexia and provide support for
theoretical models of reading disability (King, Giess, & Lombardino, 2007). It is also possible to take a bottom-up, data-driven approach that looks at collected data to identify clusters that account for the participants with dyslexia. Using a resampling and gap statistic, King et al. (2007) identified four subtypes of dyslexia from standardized measures of phonological awareness, rapid naming, phonological memory, word attack, word identification, spelling, passage comprehension, and verbal ability. Data were collected from 93 children serving as controls, matched on gender and age to 93 children with developmental dyslexia. Participants were 7-16 years of age and all had similar nonverbal intelligence scores. Children without developmental dyslexia did not reveal any significant patterns of performance on these
5 Table 1
Cognitive Processes Associated With Dyslexia in the Literature Cognitive
Processes Study Authors/Year/Findings
Attention Bosse, Tainturier, & Valdois (20070
Visual attention span plays a role in identification/parsing of relevant sub-lexical orthographic units; contributes to reading performance independently of phonological skills in French children in primary school.
Stoet, Markey, & López (2007)
Shifting attention impaired at the perceptual level, not at the level of central executive cognitive system.
Lallier, Thierry, Tainturier, Donnadieu, Peyrin, Billard, & Valdois (2009) “Sluggish attentional shifting” (SAS) associated with phonological processing deficits.
Regardless of age or language (French/English), individuals with dyslexia demonstrated SAS in auditory modality; SAS in visual system only observed in English adults.
Auditory and Visual Processing
Schulte-Körne & Bruder (2010)
Review of basic auditory and visual processing differences in dyslexia evident across lifespan. Speech processing deficits observed for all ages, affecting spectral/temporal transitions in both active and passive paradigms. Comparison of studies of visual processing complicated by variability across designs. Differences observed in functioning of fast processing transient pathway—magnocellular pathway—likely contributing to visual attention/visuospatial attention.
Automatization Nicolson, Fawcett, Brookes, & Needle (2010)
Speeded single-word reading, long-term response learning, and overnight skill consolidation; studies reviewed concluded procedural learning takes longer in some children with dyslexia. Propose skill automatization, supported by the corticocerebellar language-based procedural learning system, is the primary neural system affected, with additional issues present in some children.
Short-term
Memory De Jong (1998) Working memory (WM) deficits not limited to language tasks and general WM deficits not attributable to processing efficiency or verbal memory span deficits. Individuals with dyslexia exhibit a general WM deficit for parallel processing/storage of verbal information.
Maehler & Schuchardt (2016)
Findings suggested differing working memory deficit patterns across learning disabilities: dyslexia associated with deficits in the phonological loop; dyscalculia with deficits in visual-spatial sketchpad; ADHD with deficits in the central executive. Co-occurring disorders lead to additive working memory deficits.
Majerus & Cowan (2016)
Mini-review of short-term memory (STM) deficits in dyslexia. All but one study found verbal STM deficits persist into adulthood. Serial order STM impairment appears to occur for the retention of both verbal and visuospatial sequence information. Serial order STM impairment not observed in all participants with dyslexia and is not specific to dyslexia.
Speed of
Processing Breznitz & Meyler (2003) Explored speed of processing (SOP) in nonlinguistic and sub-lexical linguistic auditory and visual oddball tasks using EEG. In each modality and with cross-modal tasks, visual processing was slower than auditory. Individuals with dyslexia showed slower SOP to low-probability stimuli (oddballs) than controls. SOP is most evident at the processing stage associated with working memory. Proposed deficit in SOP may affect ability to integrate information. Rapid Naming Norton & Wolf (2012)
Rapid automatized naming (RAN) thought to index the ability to integral multiple neural processes. Phonological awareness and RAN are both strong predictors of reading ability and distinct constructs.
6
that included both phonological and rate scores one standard deviation below the mean, whereas 26% (19/93) demonstrated results that placed them either in a phonological or rate-depressed cluster or subtype (King et al., 2007). King et al. noted that standardized measures limit what subtypes can emerge and that other subtypes are very likely to exist.
Both prospective and longitudinal studies have helped to describe the phenotype associated with dyslexia—that is, the individual observable characteristics thought to be a product of interactions between genes and the environment. Pennington (2006), Menghini et al., (2010), and Di Filippo and Zoccolotti (2012) all considered a multi-cognitive deficit model to help account for factors like co-occurring disorders and individual differences. Based on their exploratory and confirmatory factor analyses of the potential underlying cognitive features of dyslexia, Tamboer, Vorst, and Oort (2016) put forward a multi-cognitive deficit model of dyslexia, suggesting such a conceptualization was more appropriate than framing dyslexia as a disorder resulting from one deficit with various behavioral outcomes, or as co-occurring
disorders with similar symptoms. Tamboer et al. (2016) recruited 446 psychology students, aged 17-25 years (114 males), from Amsterdam University in the Netherlands. Based on the
consistency between two independent methods of identification, a process intended to reduce selection bias, the researchers established two study groups: individuals with dyslexia (n = 63; 14%) and individuals without dyslexia (n = 345; 77%). Thirty-eight students (9%) could not be grouped due to inconsistencies between the two identification methods. Using principal
component analysis, Tamboer et al. found that five factors of dyslexia (spelling, phonology, short-term memory, rhyme/confusion, and whole-word processing/complexity) accounted for 60% of the variance in scores on standardized assessments of cognitive and linguistic processing. While they were not able to identify subgroups, Tamboer et al. found that spelling deficits were
7
the most common problem, seen in over 78% of the individuals with dyslexia. However, the severity of dyslexia was better predicted by a combination of factors rather than just this one most frequently observed deficit (Tamboer et al., 2016).
Table 2 below highlights the signs of dyslexia by developmental phase (Rose, 2009) and indicates how the characteristics tend to change across development.
Table 2
Dyslexia by Developmental Phase
Developmental Phase Signs of Dyslexia
Preschool Delayed or problematic speech
Poor expressive language Poor rhyming skills
Little interest/difficulty learning letters Early School Years Poor letter-sound knowledge
Poor phoneme awareness Idiosyncratic spelling Problems copying
Middle School Years Slow reading
Poor decoding skills when faced with new words Phonetic or non-phonetic spelling
Adolescence and Adulthood Poor reading fluency Slow speed of writing
Poor organization and expression in work Adapted from the Rose Report with permission from Snowling (2008a). Developmental phases and associated characteristics of dyslexia.
Gallagher, Frith, and Snowling (2000) explored the phenotypes associated with dyslexia by recruiting 63 children from families with a history of dyslexia, and an additional 34 children from families with no history of dyslexia, for a longitudinal study that assessed participants at two time points: 3.9 and 6 years of age. Groups were matched for maternal education, SES, age, and sex. Children were grouped based on assessments at the first-time point into at-risk impaired,
8
at-risk unimpaired, and control groups. At-risk impaired children revealed widespread language delay (receptive/expressive language skills plus vocabulary), whereas the profiles of the at-risk unimpaired and control children were very similar to one another, with the exception of scores on a non-word repetition task that was similar between both at-risk groups. At the second time point (6 years of age), the at-risk impaired group continued to demonstrate weakness across multiple measures. While the at-risk unimpaired group performed better than the at-risk impaired group, the at-risk unimpaired group scores were weaker than the controls. A re-evaluation of the same children at a third time point, 8 years of age, revealed that 66% of the children identified as at-risk scored more than 1.5 standard deviations below the control group on reading measures but not on measures of nonverbal ability (Snowling, Gallagher, & Frith, 2003). These findings suggested an increased risk of literacy problems in children presenting with risk factors, including having at least one parent with dyslexia. That risk extends beyond phonological deficits to behavioral outcomes related to language skills (Snowling, 2000). The final phase of this study (Snowling, Muter, & Carroll, 2007) included 50 at-risk students and 20 control students, 12 to 13 years of age, all of whom had participated in the earlier studies (Snowling, 2000; Snowling et al., 2003). While all students in the at-risk group (impaired and unimpaired) made reading and spelling gains, 42% of the at-risk impaired group scored within range for reading and spelling disability, demonstrating persistent literacy problems. The observations made across studies (Snowling, 2000; Snowling et al., 2003; Snowling et al., 2007) pointed to the interrelationships between reading, language, and attention as well as between genetic and environmental influences, resulting in differing outcomes.
To understand the broader phenotype of dyslexia observed in these studies involving groups of at-risk children, Snowling (2008b) considered how relative strengths and weaknesses
9
of specific cognitive skills contribute to reading skill across participating individuals. Composite scores for phonological abilities, visuospatial skills, attention control, and oral language were compiled for 48 at-risk students (20 at-risk impaired/28 at-risk unimpaired) and controls. The at-risk impaired students were further defined as those with reading and spelling impairments and those with only spelling impairments. A negative correlation between literacy skills and number of deficits was observed, and the at-risk impaired group was observed to be more likely to have multiple deficits (Snowling, 2008b). The most frequently observed issues in the at-risk impaired group were phonological and attentional deficits; within this sample (n = 20), just one case presented with only a phonological deficit. Of those at-risk but unimpaired, attentional control was the most frequently observed deficit (9 out of 28 cases). Hence, while a child meeting the diagnostic threshold for dyslexia is more likely to have a phonological deficit, the severity of the disorder may be associated with more than one cognitive deficit (Snowling, 2008b).
1.4 Co-Occurring Developmental Disorders
The co-occurrence of neurodevelopmental disorders identified by the DSM-V is more “the rule rather than the exception” (Boada, Willcutt, & Pennington, 2012, p. 274). Studies of individuals diagnosed with attention deficit hyperactivity disorder (ADHD) have noted that 70-90% of individuals meeting criteria for ADHD will also meet criteria for an additional co-occurring disorder (Faraone, Biederman, Weber, & Russell, 1998; Willcutt, Pennington, Chhabildas, Friedman, & Alexander, 1999). The rate of co-occurrence between specific learning disability (SLD) and ADHD—and in particular dyslexia, a sub-type of SLD—is as high as 25 to 40%, which suggests co-occurrence is greater than chance (Willcutt & Pennington, 2000). Dyslexia frequently co-occurs with other disorders in addition to ADHD, such as specific
10
language impairment (SLI) and speech sound disorder (SSD) (Peterson & Pennington, 2012). While many theories of language impairment, speech sound disorder, and reading disability all identify phonological deficits as an underlying cause, each of these disorders varies in its phenotypes (see Peterson & Pennington, 2012). Evidence for interactions involving multiple cognitive deficits has led to the articulation of the “multiple overlapping risk factors” model (Pennington & Bishop, 2009, p. 301). This model predicts that a single cognitive deficit, such as a phonological deficit, is not sufficient to cause a disorder. Rather, risk factors both specific to and shared between disorders result in phenotypes recognized as reading disability, specific language impairment, or speech sound disorder (Pennington & Bishop, 2009).
1.5 Evidence Across Languages
While dyslexia exists across all languages, its characteristics are thought to differ in their impact on reading development based on the transparency1 of the orthography (Peterson & Pennington, 2012). English is considered an opaque orthography due to the many
correspondences between a single letter, or a specific letter combination, and associated sounds (grapheme/phoneme correspondence). This contrasts with transparent orthographies, such as Finnish, where letters are consistently pronounced the same across contexts. Cross-cultural findings suggested that for alphabetic languages with more transparent orthographies, such as German, difficulties with reading accuracy tend to be less severe than in opaque languages such as English (Landerl, Wimmer, & Frith, 1997). Caravolas, Volín, and Hulme (2005) compared phonemic awareness in readers of Czech, a transparent language, and English, an opaque language. Their findings suggested that in both Czech and English, alphabetic languages with
1The transparency of an orthography is based on the consistency (transparent) or the inconsistency (opaque) of the letter/sound mapping. For example, in English, considered to be an opaque orthography, the letter “a” can be pronounced multiple ways such as in apple, was, made, and far (Ziegler et al., 2010).
11
differing degrees of orthographic transparency, phonemic awareness is a strong predictor of reading ability.
Chinese orthographies use characters associated with monosyllabic morphemes.
Morphemes differ from phonemes in that a morpheme represents the smallest meaningful parts of words, whereas a phoneme is simply a distinct sound in a language represented by a grapheme (character/letter). Most characters in Chinese orthography are compounds, with one component (radical) conveying the meaning of the word and the other component (phonetic) providing a cue for pronunciation (Hanley, 2005). Eighty percent of contemporary Chinese characters are
compounds containing radicals and phonetics, so the majority of characters convey both lexical-semantic and phonetic information (Hanley, 2005). Research on dyslexia in Chinese students is limited, though a few studies (Chan & Seigel, 2001; Ho & Ma, 1999) have suggested that Chinese children with dyslexia have less difficulty with regular characters (consistent phonetic cues) than with irregular or low-frequency characters. However, their performance on semantic tasks is significantly worse compared with age-matched controls, yet similar to younger readers matched for reading level (Hanley, 2005). According to Chan and Siegel (2001), early reading in Chinese depends more on visual skills, whereas phonological processing becomes a crucial skill as students continue through school.
Across languages, the orthographic transparency of a script does seem to affect the rate of reading acquisition for all readers, and for those with dyslexia, irregular features present
obstacles to fluent reading (Caravolas, 2005). According to Caravolas (2005), evidence points to several underlying cognitive deficits common across languages in dyslexia, including
12
Cross-cultural brain imaging studies have suggested that, although dyslexia may present differently across languages, the same brain regions—the left middle, inferior, and superior temporal cortex as well as the middle occipital gyrus—reveal differences between readers with and without dyslexia, regardless of orthography (Paulesu, Danelli, & Berlingeri, 2001; Silani et al., 2005). Using positron emission tomography (PET), Paulesu et al. (2001) explored the relationship between various measures of literacy-related skill in adults with and without dyslexia who were readers of opaque (English and French) and transparent (Italian) languages. They compared measures from the Wechsler intelligence test scale (WAIS) for adults and other reading and phonology tasks. Individuals with dyslexia across languages performed significantly worse than controls on subtests of the WAIS such as digit span, arithmetic, and digit symbol manipulation; however, on other measures not associated with phonological short-term memory, performance was similar between readers with and without dyslexia. On measures of phonology and reading, speakers of Italian with dyslexia outperformed speakers of English or French with dyslexia, making fewer errors on words and nonwords. All individuals with dyslexia performed significantly worse than non-dyslexic readers, regardless of language, on measures of reading and phonology. The PET findings demonstrated reduced activation in areas strongly associated with word reading, such as the perisylvian cortex, the left middle and inferior temporal gyri, and the fusiform gyrus, in individuals with dyslexia across languages as compared to controls. These findings provided evidence for a common neuroanatomical basis for dyslexia, despite differences in behavioral outcomes between transparent and opaque orthographies.
Silani et al. (2005) extended the findings from Paulesu et al. (2001) by conducting a voxel-based morphometry (VBM) analysis to determine potential differences in grey and white matter density in areas previously associated with reduced activation in individuals with dyslexia
13
in English, French, and Italian. Findings suggested a structural cortical disorganization associated with dyslexia, including areas with reduced grey matter (e.g., left middle temporal region) and areas with increased grey matter densities (including posterior temporal and inferior temporal cortices). Individuals with dyslexia from all three language backgrounds showed this same pattern and additionally showed a reduction in white matter density in the arcuate
fasciculus. Silani et al. (2005) speculated that, while the areas observed to differ between individuals with and without dyslexia across the three languages studied are associated with phonological processing and decoding, the findings suggested a disruption to local regions and connectivity within the language network. This potentially relates to the integration of visual, phonological, and articulatory information required for reading (Silani et al., 2005).
1.6 Making Sense of Dyslexia
Stein (2001) suggested that individuals with dyslexia have atypical brains. A recent Norwegian longitudinal structural MRI study compared seven children with dyslexia and 10 children without dyslexia, following them from pre-literacy to 11 years of age, when in some instances a diagnosis of dyslexia was made (Clark et al., 2014). The study revealed
neuroanatomical abnormalities in pre-readers, not in the reading network but in regions supporting auditory and visual processing (Clark et al., 2014). The Interagency Committee on Learning Disability (2011) stated there is a basic consensus that learning disabilities are
attributable to atypical cognitive and linguistic processes. Where consensus breaks down is in the assessment, identification, and nature of specific learning disabilities.
Reading is a complex cognitive task, one that engages multiple sensory and cognitive systems. The current consensus in favor of the phonological deficit theory of dyslexia is the product of research undertaken during the 1980s, derived from replicated findings that children
14
with dyslexia struggle to process individual sounds, the constituent components of words (Nicolson, Fawcett, Brookes, & Needle, 2010). Advances in brain imaging, including electroencephalography (EEG), positron emission tomography (PET), magnetic resonance imaging (MRI), functional magnetic resonance imaging (fMRI), magnetoencephalography (MEG), diffusion tensor imaging (DTI), and near-infrared spectroscopy (NIRS), have added significantly to our understanding of the structural and functional factors contributing to the development of a functional neural network for reading as well as observed differences in the reading networks of individuals with dyslexia. However, it has proven difficult to disambiguate the underlying mechanisms that contribute to reading disability from possible factors resulting from differential reading experiences (Olulade, Napoliello, & Eden, 2013). This makes it more difficult to reach an understanding of reading disability in terms of the distinctions between potential causes, observed symptoms, and possible treatments (Nicolson et al., 2008).
Furthermore, multiple neurological substrates could likely contribute to dyslexia and observed symptoms, suggesting there are potential subtypes that correspond to different abnormalities within the brain systems supporting reading. The fundamental challenge for researchers across multiple disciplines is to construct an explanatory account of the contributing sensory and cognitive systems that can contribute to reading disability and different disability profiles within a developmental neurobiological framework.
Against this background, the goals of this dissertation study can be summarized as follows: (a) to explore the neural correlates of early-stage visual processing differences in developmental dyslexia, possibly indexed by EEG event-related potential (ERP) components; and (b) to investigate whether such ERP components are associated with behavioral measures of orthographic skill as well as other key sub-skills related to reading. The intent is to contribute to
15
the growing body of knowledge suggesting that differences in visual information processing may contribute to reading difficulties (e.g., Lawton, 2016).
This dissertation is organized as follows: Chapter 2 provides an overview of the anatomy of the reading brain, the neurobiology of reading, and theoretical models. Chapter 3 provides the research questions and hypotheses for the dissertation study, followed by Chapter 4, which details the methodology. Chapter 5 outlines the data recording procedures, pre- and post-processing parameters, as well as the data analysis strategy. Chapter 6 summarizes results from the study. Finally, Chapter 7 discusses the findings within the context of the current research and provides thoughts on future directions as well as study limitations and delimitations.
16
2. THE READING BRAIN
Many factors contribute to academic skill development. Fletcher et al. (2009) provided a framework for understanding the potential interactions between factors (see Figure 1 below). This framework illustrates the complexity involved in disentangling the source(s) of observed academic skill deficits. Implicit in this framework is the dynamic nature of development. The constellation of brain systems that eventually come to support efficient reading did not evolve for the purpose of reading. Dehaene’s (2009) Neuronal Recycling Hypothesis suggested that
neuronal networks that evolved to accomplish other essential skills, such as language and object recognition, are co-opted through instruction to develop an additional functional system, one that recognizes written symbols in such a way that language can be perceived through a visual
medium (Dehaene, 2009).
Figure 1. Influences on academic deficits
17
Each brain is the product of biological constraints, including individual genetics and how those “instructions” unfold during development in response to environmental factors, reflecting neuroplasticity (Berninger & Richards, 2002). In this section, we will consider the anatomy of the brain in relation to models of language and reading; brain development and neuroplasticity; the neurobiology and theories of dyslexia; and finally, how the vision system contributes to reading.
2.1 Anatomy of the Reading Brain
Language is typically accessed through the auditory system; reading, by contrast, typically involves accessing language through the visual system (Richardson & Price, 2009). Word recognition in skilled readers engages the inferior occipito-temporal and fusiform areas extending anteriorly in the middle and inferior temporal gyri (ventral network), the temporo-parietal area including the angular gyrus and suprmarginal gyrus (dorsal network), and posterior portions of the inferior frontal gyrus (anterior network), all primarily in the left hemisphere of the brain (Sandak, Mencl, Frost, & Pugh, 2004). These networks each play a unique role in skilled reading. The ventral system, in support of reading, develops slowly (Shaywitz et al., 2002), with the more posterior areas thought to function in a pre-semantic way (visual word form area; Cohen et al., 2002) while the more anterior parts of the ventral system (middle and inferior temporal gyri) are tuned for semantics (Sandak et al., 2004). The dorsal system is thought to be responsible for mapping language symbols (graphemes) onto the corresponding phonological and semantic components of language (Borowsky et al., 2006). More generally, its role seems to involve “attentionally controlled processing” (Sandak et al., 2004, p. 275). The anterior network, often engaged when reading low-frequency rather than
18
high-frequency words (Fiedback et al., 2002), is thought to support reading through phonological recoding (Sandak et al., 2004).
This overview focuses on word-level reading since this is a prerequisite for fluent reading. We begin with a brief overview of the language system on which the reading system develops.
The Broca-Wernicke-Lichtheim-Geschwind model (see Figure 2 below) was the first neurobiological model of language, based on 19th century lesion studies conducted by Carl Wernicke and Paul Broca, which provided evidence for a brain structure-function relationship (see Ben Shalom & Poeppel, 2008; Tremblay & Dick, 2016). Given the accumulation of research since, it has been argued that this “Classic model” needs to be expanded (e.g., Ardila, Bernal, & Rosselli, 2016; Ben Shalom & Poeppel, 2008; Gierhan, 2013; Poeppel, Emmorey, Hickok, & Pylkkänen, 2012; Tremblay & Dick, 2016).
Figure 1. Classic language network model (Geschwind, 1979).
This diagram illustrates the very basic anatomical areas and functional roles of the language. With permission from Ben Shalom & Poeppel (2008).
19
One approach has built on observations from sensory (specifically, visual) processing. Ungerleider and Mishkin (1982) proposed a framework, later modified by Goodale and Milner (1992), that described functional roles for visual processing that were sub-served by dorsal and ventral visual pathways. Language and reading tasks each drive different patterns of brain activation across a diffuse network of structures, a finding that has been replicated with a good degree of consistency (see Price, 2012). Brain circuitry for reading is superimposed on the brain circuitry for speech and language processing (see Figure 3 and Table 3 below for a summary overview) and includes three major circuits: left dorsal temporo-parietal, ventral occipital-temporal, and the inferior frontal circuit (e.g., Pugh et al., 2000). Within these systems, both lateralized to the left hemisphere, the phonological system has an anterior and a posterior component. The anterior component (inferior frontal gyrus/BA 44 and premotor cortex BA 6) is associated with speech production and analysis of phonological components of words (Martin, Schurz, Kronbichler, & Richlan, 2015; Seidenberg, 2017). The posterior component consists of the perisylvian region including the supramarginal gyrus (BA 40) and the angular gyrus (BA 39), part of the posterior superior temporal cortex, an area thought to support the integration of letters and sounds. The ventral circuits include the orthographic system, associated with the extrastriate area in the occipito-temporal cortex, frequently referred to as the visual word form area
(VWFA), a region thought to process letter patterns as prelexical representations of words (Martin et al., 2015; Schlagger & McCandliss, 2007; Seidenberg, 2017). See Table 4 below for a summary of this classical view of reading circuits in the brain.
20
Figure 3. Neurocognitive model of neural pathways supporting auditory language in the brain, upon which networks for reading are superimposed.
With permission from Gierhan (2013). See Table 3 for explanation.
Table 3
Neurocognitive Model based on Gierhan (2013)
Likely Pathways of Fiber Tracts Associated With Language Processing
Pathway Regions and Connections Associated Language AFspects of unction Dorsal BA 44 (Broca’s Area) connects to the posterior Superior Temporal
Gyrus/Middle Temporal Gyrus via Arcuate Fasicicle (RED) Complex syntax
Dorsal
Angular Gyrus connects to posterior Superior Temporal Gyrus/Middle Temporal Gyrus and Posterior Temporal Lobe via
Superior Longitudinal Fasicicle I or temporo-parietal (PINK) Phonology and repetition Angular Gyrus connects to dorsal Pre-Motor Cortex via
Superior Longitudinal Fasicicle II (PURPLE) Repetition Dorsal Pre-motor cortex via Superior Longitudinal Fasicicle III (GREEN) Supramarginal Gyrus connects to BA 44 (Broca’s Area) and ventral Articulation and repetition Ventral Orbitofrontal cortex, Frontal Operculum, Temporal Pole are connected via the Uncinate Fascicle (BLUE) Simple syntax Ventral Temporal Pole via the Inferior Longitudinal Fascicle (BROWN) Occipital Cortex connects with Posterior Temporal Lobe and
Ventral Posterior Superior Temporal Gyrus/Middle Temporal Gyrus connects to Temporal Pole via Middle Longitudinal Fascicle (MUSTARD) Ventral Occipital Cortex connects with BA 45, Frontal Pole, Orbitofrontal cortex, Frontal Operculum via Inferior Fronto-occipital Fascicle
(IFOF—TAN) Semantics, simple syntax
Supramarginal Gyrus connects to the Posterior Superior Temporal Gyrus/Middle Temporal Gyrus via an unnamed tract
21 Table 4
Classical View of Reading Circuits in the Brain based on Pugh et al. (2000)
Evidence from fMRI (e.g., Borowsky et al., 2006) has supported the existence of the functional dissociation between lexical (ventral/automatic) and sub-lexical
(dorsal/non-automatic) processing streams, with both streams utilizing the lateral extrastriate (occipital lobe). However, this study also indicated that the insular cortices contribute to sub-lexical spelling-to-sound processing, as was suggested by Posner and Raichle’s (1994) automaticity model. In a recent meta-analysis, Martin et al. (2015) examined fMRI reading studies to contrast reading processes in children and adults. They compiled two groups: the first included 20 fMRI studies involving children 7 to 12 years of age, and the second included 20 fMRI investigations
involving adults, aged 23 to 34 years. This analysis revealed a common network for reading that included the left ventral occipito-temporal circuit, left inferior frontal gyrus, left posterior parietal cortex, and bilateral supplementary motor area. Observed differences between
participant age were not related to regions, but to the consistency of activation clusters between groups. Activation was observed to be more consistent across the studies involving children for areas including the bilateral supplementary motor area (BA 6) and the left superior temporal
22
gyrus (BA 38), whereas for the adult studies, there was more consistency bilaterally within the cerebellum and in the left middle frontal gyrus, pericentral gyrus, and middle occipital gyrus. The review also demonstrated the importance of the left ventral occipito-temporal circuit for reading in both children and adults; however, early readers appeared to rely on greater engagement of the left anterior and middle occipito-temporal region, while skilled readers engaged the posterior occipito-temporal region (Martin et al., 2015). The consistency of
observed activation levels within the studies for children, and separately for adults, led Price and Devlin (2011) to suggest that the left ventral occipito-temporal cortex supports the integration of bottom-up sensory input with top-down predictions based on prior experience. In this view, referred to as the “Interactive Account,” orthographic specialization emerges without tuning to orthographic features but from regional interactions (Price & Devlin, 2011). Within the ventral occipito-temporal region, visual-sensory input activates visuospatial features that integrate with higher-level associations (actions, speech sounds, meaning). Therefore, the function of the ventral occipito-temporal region may change in relation to the regional interaction involving a hierarchy of feedforward and feedback connections—which develop based on experience (Martin et al., 2015). The Interactive Account stands in contrast to, for example, the Local Combination Detectors model of reading developed by Dehaene, Cohen, Sigman, and Vinckier (2005), which suggested that there could be a change in sensitivity to increasingly larger word components from posterior to anterior areas along the ventral visual pathway that occurs during development.
Castro-Caldas, Petersson, Reis, Stone-Elander, and Ingvar (1998) used positron emission tomography (PET) to investigate how learning to read may change the functional organization of the brain in adults. They compared measures of activation between illiterate and literate
23
individuals performing an auditory repetition task with words and pseudowords. Six literate and six illiterate women, all in their 60s, participated. All were from the same sociocultural
environment, were right-handed, and performed within one standard deviation of one another on a short battery of qualifying assessments. The literate group was further evaluated on reading comprehension and writing skills and determined to perform typically (that is, no reading disorders were identified). The behavioral results revealed a significant difference between groups on word repetition accuracy, but a much greater difference in pseudoword repetition accuracy (84% literate group average correct repetitions; 33% illiterate group). The errors made in the pseudoword repetition task were categorized as either lexicosemantic or phonological. There were fewer lexicosemantic errors (2 made by the literate group, 53 made by the illiterate group) than phonological errors (117 made by the literate group, 475 made by the illiterate group). Patterns of brain activation observed during word vs. pseudoword repetition were similar between groups. The superior/inferior parietal regions (BA 7, 39, and 19) were activated in both groups, with the literate group demonstrating greater activation in the left inferior parietal area (BA 40) than the illiterate group. Patterns of activation for pseudowords vs. words revealed much more differentiated engagement of areas. Literate participants showed significantly greater activation bilaterally in the anterior insular (BA 14 and 15) and right frontal opercular cortices (BA 44, 45, 47, and 49), left perigenual anterior cingulate cortex (BA 24 and 32), left basal ganglia, anterior thalamus/hypothalamus, and midline cerebellum. The only significant area of greater activation during pseudoword repetition observed in the illiterate group was the middle frontal/frontopolar region (BA 10), a region associated with episodic memory tasks (Rugg, Fletcher, Frith, Frackowiak, & Dolan, 1996). These findings are meaningful because they demonstrate that unlike the literate group, who through literacy instruction appeared to have
24
developed a network that can support the accurate repetition of pseudowords (essentially a phonological coding task), the illiterate group seemed to rely on episodic memory rather than a phonological coding network in order to carry out the same task. Castro-Caldas et al. (1998) concluded that learning to read and write facilitates the experience-driven organization of a neural network.
Critical to learning to read is the mapping of letters (graphemes) on to speech sounds (phonemes) (e.g., Hulme, Goetz, Gooch, Adams, & Snowling, 2007). Different sensory channels contribute to this integrative process, and the brain is thought to construct a multisensory
interpretation of a “letter” (Raij, Uutela, & Hari, 2000). Raij et al. (2000) explored the neural correlates of an audiovisual integration mechanism for the association of graphemes and phonemes. The stimuli consisted of capital letters that corresponded to 20 auditory letters, and altered letter parts (nonletters) presented sequentially, either on screen (capital letter), through earpieces (digital recording of Finnish phonemes), or simultaneously as an audiovisual stimulus and matched with unrecognizable symbol/sound control stimuli. Using MEG, Raij et al.
identified five cortical areas that were engaged when processing integrated audiovisual linguistic stimuli: the left and right fronto-parietal and superior temporal sulci, and the right temporo-occipito-parietal junction. This finding supported the role of the superior temporal sulcus as the site of an audiovisual integration mechanism for letters. The left superior temporal sulcus response for all participants was weaker to audiovisual than control stimuli, which the authors concluded reflects a neural network that has “learned” the presented letter/sound associations.
The emergence during development of a brain network for reading brings together lower-level perceptual processes and higher-lower-level language systems (Posner, Petersen, Fox, & Raichle, 1988). A 20-year review and synthesis of PET and fMRI studies by Price (2012) identified
25
multiple replicated findings that permit the demarcation of distributed patterns of activation involving multiple areas for specialized purposes—for example, the integration of visual processing, articulation, and semantics in support of orthographic processing. Studies have repeatedly demonstrated that activation of the ventral occipito-temporal cortex is associated with skilled reading (Price, 2012). This area, however, can be further parceled with posterior regions that contribute to feature extraction, and more anterior areas contributing to lexico-semantic whole word processing. Each of these regions is further thought to contribute separately to distinct pathways. One proposed pathway connects the left ventral occipito-temporal cortex and ventral inferior frontal gyrus, creating the lexico-semantic route; another connects the superior temporal and ventral inferior parietal cortices to the dorsal precentral gyrus, supporting the non-semantic phonological decoding route (Price, 2012). Over decades, and despite inconsistent findings from studies of brain activation due to subtle experimental design differences, consistent patterns can be observed for visual word form processing across individuals (Price, 2012).
However, whether the left ventral occipito-temporal cortex becomes specialized specifically for visual word forms, as proposed by Cohen et al. (2000), is still debated (Price & Devlin, 2003; 2004).
The research reviewed above has suggested that a reading network emerges as a result of explicit instruction. Dehaene and Cohen (2007) contended that specific brain areas, such as the VWFA, become tuned to specific classes of stimuli such as words. While a network of brain regions important to reading, such as the VWFA (BA 37), the supramarginal gyrus (BA 40), the angular gyrus (BA 39), and the inferior frontal gyrus (BA 44) are consistently observed to activate in response to reading and reading-related tasks (Price, 2012), questions remain as to how they are functionally related. In contrast to Dehaene and Cohen (2007), others have
26
suggested those areas involved in reading are not dedicated to reading but rather sub-serve more general processing tasks (Price & Devlin, 2003; 2004; Vogel, Petersen, & Schlaggar, 2014).
Vogel, Petersen, and Schlagger (2012) used fMRI to explore the proposition that the left occipito-temporal area or VWFA becomes specialized for words. In a study involving 27 English speaking adults with above average IQ and reading level, participants responded to different visual stimuli including same-different word pairs, single words, phonotactically legal
pseudowords, illegal nonwords, consonant strings, Amharic strings, and line drawings matched for visual complexity. Activation in the left occipito-temporal region (VWFA) was greater in response to Amharic characters than English, consistent with a more general processing performed in that region. Vogel et al. suggested that the VWFA may be most responsive to specific characteristics of visual stimuli such as complexity, spatial frequency, and contrast (e.g., Fiset, Gosselin, Blais, & Arguin, 2006; Kveraga, Boshyan, & Bar, 2007; Woodhead, Wise, Sereno, & Leech, 2011). It has further been suggested that the VWFA may be
cytoarchitectonically subdivided into two regions, FG1 and FG2, both of which sub-serve visual processing for cognitive tasks (object recognition and visual attention, for example), but one of which (FG2) also serves specialized functions (Caspers et al., 2013). A connectivity analysis indicated that FG1 reflects a “transitional” area between early and higher-level processing, while FG2 shows hemispheric specialization for emotion and face processing lateralizing to the right hemisphere (fusiform face area); in the left hemisphere, FG2 is specialized for visual processing related to language (hence, the visual word form area) (Caspers et al., 2014).
In summary, the ability to read is only acquired after the brain areas associated with language and vision are recruited for solving the particular problem of associating visual symbols (graphemes) with speech sounds (phonemes), which then provide access through the
27
visual system to the language system. This requires training and extensive practice that
ultimately results in reorganization of characteristic brain networks and activations—a process that relies on neuroplasticity.
2.2 Brain Development—Neuroplasticity
Development is a dynamic process reflecting a complex cascade of genetic and
environmental factors that progress over time such that earlier-developing systems often become the precursors for later-developing sub-systems (e.g., Stiles, 2017). Connections not functionally relevant are “pruned” to minimize crosstalk and enhance the metabolic and functional efficiency of brain circuitry (Berninger & Richards, 2002). Learning from experiences is understood to result in physical changes to the brain, and such changes are thought to be a critical aspect of brain development across the lifespan (e.g., Hübener & Bonhoeffer, 2014).
Plasticity can be independent, expectant, and experience-dependent (Schatz, 1992). Experience-inexperience-dependent plasticity is a mechanism that allows the refinement of functional connections from genetic instructions driven by internal or external events, primarily during prenatal development (Kolb, Mychasiuk, Muhammad, & Gibb, 2013). The effects of experience-expectant input can be seen in studies of individuals who experience sensory deprivation in one modality during their development. For example, it has been observed that hearing-impaired individuals who experience congenital auditory deprivation, as opposed to hearing-impaired individuals who acquire American Sign Language (ASL), exhibit increased detection of peripheral motion (Neville, 1995). The possibility that the development of the dorsal visual pathway, which contributes to motion processing, is altered due to auditory deprivation was investigated by Armstrong, Neville, Hillyard, and Mitchell (2002) using EEG. Armstrong et al. developed visual stimuli that were designed to stimulate one of two major sensory input
28
pathways for the visual system: the magnocellular pathway, that originates in the retina and projects to the lateral geniculate nucleus, V1, and then the dorsal visual pathway in the parietal lobe; or the parvocellular pathway, that contributes to the ventral pathway in the temporal lobe (Armstrong et al., 2002). Participants included normally hearing and congenitally deaf adults, who viewed stimuli that appeared on a monitor simultaneously in four peripheral positions and one center position. For a 100-millisecond duration, the stimuli in one of the five positions would change in color—a trigger for the parvocellular pathway—or would change from a static grating to a moving grating—to evoke a response from the magnocellular pathway. Responses from the parvocellular/dorsal pathway were similar between groups; but responses recorded from the magnocellular/dorsal pathway were greater in their amplitude and had a more anterior scalp distribution for congenitally deaf participants than for normally hearing adults. This finding indicated that auditory deprivation might have a more pronounced effect on the magnocellular vs. the parvocellular pathway. It is hypothesized that within the visual system, neuronal
populations supporting high acuity, for example, rely on a precision of connections dictated by a “developmental blueprint,” while less precise sub-systems supporting depth perception, for example, depend more on activity-mediated interactions (Chalupa & Dreher, 1991). Stevens and Neville (2014) suggested that within the visual system, the different sub-systems display
different degrees of neuroplasticity, possibly attributable to different developmental trajectories and acting to enhance or disrupt processing. Evidence has suggested the magnocellular pathway (dorsal pathway) has a longer developmental trajectory than the parvocellular (ventral pathway) (Coch, Skendzel, Grossi, & Neville, 2005; Mitchell & Neville, 2004).
One major reconceptualization in developmental neuroscience in recent years has been the acknowledgment that, in addition to local neural networks shaped by Hebbian learning