ABSTRACT
We provide evidence that UGC1382, long believed to be a passive elliptical galaxy, is actually a giant low surface
brightness(GLSB)galaxy that rivals the archetypical GLSB Malin1 in size. Like other GLSB galaxies, it has two
components: a high surface brightness disk galaxy surrounded by an extended low surface brightness(LSB)disk.
For UGC1382, the central component is a lenticular system with an effective radius of 6 kpc. Beyond this, the
LSB disk has an effective radius of∼38 kpc and an extrapolated central surface brightness of∼26 mag arcsec−2.
Both components have a combined stellar mass of∼8×10¹⁰Me, and are embedded in a massive(1010Me)
low-density (<3Mepc−2) HI disk with a radius of 110 kpc, making this one of the largest isolated disk galaxies
known. The system resides in a massive dark matter halo of at least 2×10¹²Me. Although possibly part of a
small group, its low-density environment likely plays a role in the formation and retention of the giant LSB and HI
disks. We model the spectral energy distributions and find that the LSB disk is likely older than the lenticular
component. UGC1382 has UV–optical colors typical of galaxies transitioning through the green valley. Within the
LSB disk are spiral arms forming stars at extremely low efficiencies. The gas depletion timescale of∼1011years
suggests that UGC1382 may be a very-long-term resident of the green valley. Wefind that the formation and
evolution of the LSB disk in UGC1382 is best explained by the accretion of gas-rich LSB dwarf galaxies.
Key words:galaxies: individual(UGC1382)
1. INTRODUCTION
Giant low surface brightness (GLSB)galaxies are the most
extreme low surface brightness(LSB)disk galaxies and are the
largest isolated galaxies known to exist. Although they are massive(L∼L*)and gas-rich(Mgas>1010Me), because they
have disk scale lengths in excess of 10 kpc, they also have low
gas surface densities and star formation efficiencies (
Spray-berry et al. 1995; Impey & Bothun 1997; Matthews
et al. 2001). Their rotation curves flatten near Vmax∼
300 km s−1 and are dark matter (DM) dominated with DM
fractions >0.7 (Lelli et al. 2010; Buta 2011). Despite the
enormous size and luminosity of GLSB galaxies, their diffuse
nature makes them difficult to detect and they are assumed to
be highly underrepresented in catalogs(Impey & Bothun1997). Their contribution to the luminosity density of the universe remains unclear. Their origins have implications for the success
of ΛCDM and hierarchical formation at low densities.
GLSB galaxies are not simple“pure”low surface brightness
(LSB) systems. Rather, a defining characteristic is that they
have both a normal high surface brightness (HSB) central
component(typically an early-type disk), which is embedded in
a massive extended diffuse disk component (Sprayberry et al.
1995; Barth2007; Lelli et al.2010). Because star formation is usually present in the extended disks of GLSB galaxies
(Boissier et al.2008), they can be considered larger versions of
the more recently defined category of Type1 XUV disk
galaxies(Thilker et al.2007), in which UV emission is seen at
distances well beyond the classical star formation threshold
surface density. GLSB galaxies, but for their large scale, are also similar to the population of low-mass early-type galaxies
(i.e., elliptical and lenticular galaxies)that show low levels of star formation in the outer regions, which may be the result of
recent accretion of lower mass galaxies(Salim & Rich 2010;
Moffett et al.2012).
There is no definitive formation scenario for GLSB galaxies,
but most agree that a low-density environment is required in order to build and keep such enormous, organized, tenuous, and seemingly undisturbed extended disks. Although often described as simply unevolved gas-rich disks due to their low
star formation efficiency (Bothun et al. 1987; Hoffman
et al. 1992), the dual HSB inner region and LSB extended
disk suggest a more complicated history, which may involve both a rapid disk formation and a late collapse of a
low-amplitude density perturbation(Impey & Bothun1997)or the
tidal disruption of dwarf galaxies(e.g., Peñarrubia et al.2006). There are likely several mechanisms at work simultaneously. However they form, the relative isolation and low star
formation efficiency suggests that they are not evolving rapidly
at present.
The prototypical GLSB galaxy, Malin1, discovered by
Bothun et al.(1987), has an extrapolated disk central surface
brightness of μR(0)=24.7 mag arcsec−2, a staggering disk scale length of 57 kpc(forh=70; Moore & Parker2006)and an absolute magnitude ofMV=−22.9(Pickering et al.1997).
Malin1ʼs HI disk has a mass of 1011Me and extends to a
Using Hubble Space Telescope imaging, Barth (2007)
confirmed that the inner 10 kpc of Malin1 hosts an SB0/a
disk of normal size and surface brightness. Boissier et al.
(2008)has classified Malin1 as having a Type1 XUV disk.
Although more than a dozen systems are now considered
to be GLSB galaxies (Bothun et al. 1990; Sprayberry et al.
1995; Matthews et al. 2001), no other system has been
reported with properties as extreme as the prototypical Malin1.
In this article, we describe UGC1382, which is nearly
identical in terms of scale and other physical properties to
Malin1. However, at less than one-fourth the distance to
Malin1, it is significantly closer. This allows a detailed
multiwavelength investigation of a true Malin1-like GLSB
galaxy at much smaller spatial scales, with the goal of constraining the formation and evolution of these extreme systems.
UGC1382 has been classified as an elliptical in many
optical surveys(Tonry & Davis1981; Laurikainen et al.1994;
Huchra et al. 1999; Doyle et al. 2005; Sánchez Almeida
et al. 2011; Huchra et al. 2012). Several surveys looking for
morphological features, such as stellar rings and bars, did not detect anything other than a simple bulge-dominated galaxy
(Meyer et al. 2004; Nair & Abraham 2010; Baillard
et al. 2011). It has spectroscopically measured recession
velocities ranging between 5550 and 5770 km s−1 (Huchra
et al. 1983, 1999; Meyer et al. 2004; Garcia-Appadoo
et al. 2009; Aihara et al. 2011). We find a 21 cm systemic
radial velocity of 5591 km s−1(see Section 3.3) and adopt a
distance of 80 Mpc (Wright 2006) in this paper; this gives a
scale of about 380 pc arcsec−1or 23 kpc arcmin−1. UGC1382
may be in a small group; there are three known galaxies within
1.5 Mpc. UGC1382 was found to have 5×10⁹Meof HI gas
(Garcia-Appadoo et al.2009), which is approximately 13% of
the stellar mass(West et al.2010). The only hint that it may be more noteworthy was the suggestion of an extended HI disk
(Garcia-Appadoo et al.2009), though no analysis of such a disk
was undertaken.
UGC1382 came to our attention during an investigation of
star formation in early-type galaxies. We noticed that it
contained a set of very extended spiral arms in ultraviolet(UV)
imaging from theGalaxy Evolution Explorer(GALEX; Martin
et al. 2005). Further investigation revealed that this system is
not an elliptical galaxy, but is in fact a GLSB galaxy composed of an HSB lenticular core and an 80 kpc radius LSB disk. In order to better understand this unusual galaxy, we have assembled a set of multiwavelength data, ranging from radio to
far-ultraviolet, which we present in Section2. In Section3, we
discuss the galaxyʼs morphology, surface brightness profiles,
HI gas content, star formation efficiency, LSB characteristics,
and environment. We derive the dark matter content of the
galaxy in Section 4. We then use the multiwavelength
photometric data to model the spectral energy distribution
(SED) of the galaxy, its HSB lenticular component, and its
extended LSB disk in Section5. In Section6, we examine the
past and future evolution of UGC1382 based on both its
morphology and modeled physical parameters. We present
possible formation scenarios in Section 7. Finally, we
summarize our results in Section 8. We use flat ΛCDM
cosmology with ΩΛ=0.7, ΩM=0.3, and H0=
70 km s−1Mpc−1throughout.
2. DATA
UGC1382 has been observed with GALEX, the Sloan
Digital Sky Survey(SDSS)Stripe 82 (optical photometry and
nuclear spectrum; Abazajian et al.2009; Alam et al.2015), the
Two Micron All-Sky Survey(2MASS; Cohen et al.2003), and
the Wide-field Infrared Survey Explorer (WISE; Wright
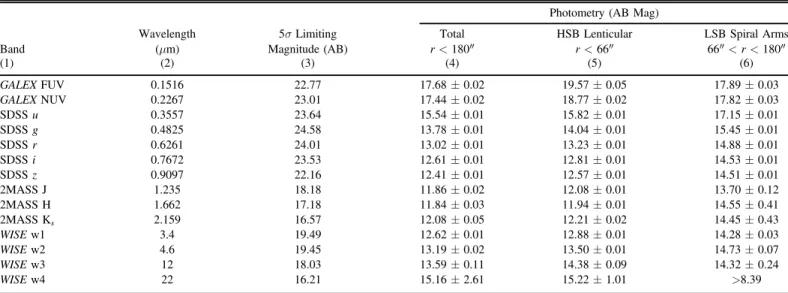
et al.2010). Central wavelengths of each bandpass are listed
in Table1. Images of the galaxy in each of the fourteenfilters
between 0.15 and 22μm are shown in Figure 1, and a color
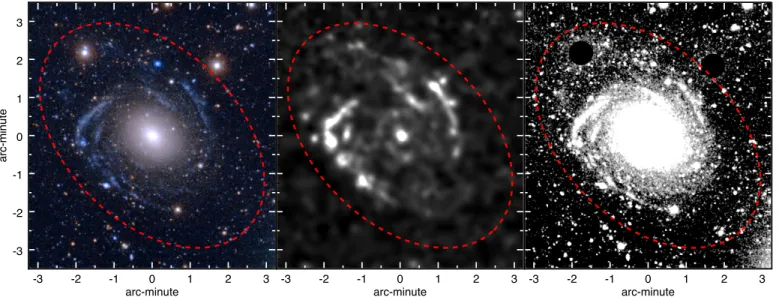
composite is shown in the left panel of Figure2.
Photometry is performed and surface brightness profiles are
generated using the WISE Nearby Galaxy Atlas and GALEX
Large Galaxy Atlas pipeline(M. Seibert & J. D. Neill 2016, in
preparation). Foreground stars and background galaxies were
masked prior to analysis. Nok-corrections were made because
the galaxy is sufficiently local. A summary of the photometry is
in Table1. The magnitudes shown in Table1are not corrected
for the foreground galactic reddening of E(B−V)=0.032
(Schlegel et al.1998), though corrections are applied prior to
analysis. The magnitudes are calculated withinfixed apertures
of sizes listed in Table 1, which correspond to the HSB and
LSB galaxy components.
In addition to the SDSS nuclear spectrum, an optical spectrum of an outer spiral arm was obtained with the 2.5 m
duPont Telescope at Las Campanas Observatory using the
Wide Field CCD Camera in long-slit spectroscopy mode. The
instrument was configured with a grism providing a
wave-length coverage of 3650–8500Å with 375 km s−1 FWHM
resolution. The data were obtained on 2013 October 10, with an
exposure time of 3×1200 s at an airmass of 1.2. The knot
spectrum was extracted over 6 3 along the 1 65 slit,
representing an area of 1.5 kpc2at the distance of UGC1382.
Finally, UGC1382 was previously observed with the
NRAO9 Very Large Array (VLA) in the D-configuration on
2007 March 31(project ID: AY177). The VLA correlator was
configured with a total bandwidth of 6.3MHz divided into 64
channels centered on HI at the systemic velocity of the galaxy. The total integration time on the science target was three hours.
Observations of UGC1382 were preceded and followed by
observations of the phase reference calibrator, J0149+0555,
every 30 minutes over a switching angle of 6°. The positional
accuracy of the phase calibrator was <0 002. The calibrator
3C48 was used to set the amplitude scale to an accuracy of 3% and calibrate the bandpass. Data calibration and image processing were carried-out with the 2008 December 31
release of the Astronomical Image Processing System(AIPS)
following standard procedures. Our final image cube has an
rms noise of 0.7 mJy beam−1 per channel, channel width of
97.66 kHz (20.52 km s−1), and a synthesized beam with
dimensions 76 93×50 86. The HI column density map,
velocity map, and spectrum are shown in Figure3.
3. PHYSICAL DESCRIPTION AND CLASSIFICATION
Despite its relatively small distance(80 Mpc) and relatively
large angular size (3arcmin), UGC1382 is a clear case of a
morphologically misclassified system. In the near-IR and optical,
the HSB bulge component—so easily detected in shallow
surveys—left the impression that UGC1382 was a typical
9
The National Radio Astronomy Observatory is a facility of the National Science Foundation operated under cooperative agreement by Associated Universities, Inc.
quiescent elliptical galaxy. As such, it has fallen into many
samples classified as an elliptical. The power of multiwavelength
observations and deeper surveys reveals it to be a much more complicated system. It is unlikely that this is the only nearby
system that suffers from such a misclassification.
In this section, we discuss the detailed UV/optical and HI
morphology of UGC1382. We also address the broad
characteristics of the optical spectra. We calculate the star
formation efficiency and place its LSB disk in the context of
XUV disks. Finally, we look at its galactic environment, and
place the galaxyʼs physical size into context with other large
galaxies. Many of the quantities referenced here are
summar-ized in Table2.
3.1. Optical and Ultraviolet Morphology
A careful inspection of the annularly averaged radial profiles
(Figure4), along with a detailed decomposition of ther-band
± ± ± 2MASS Ks 2.159 16.57 12.08±0.05 12.21±0.02 14.45±0.43 WISEw1 3.4 19.49 12.62±0.01 12.88±0.01 14.28±0.03 WISEw2 4.6 19.45 13.19±0.02 13.50±0.01 14.73±0.07 WISEw3 12 18.03 13.59±0.11 14.38±0.09 14.32±0.24 WISEw4 22 16.21 15.16±2.61 15.22±1.01 >8.39
Note.These data are not corrected for foreground galactic extinction.
Figure 1.Multiwavelength images of UGC1382. The morphology is dominated by the LSB spiral arms in the UV, whereas the central lenticular component is most dominant in the optical and IR. Each image is logarithmically scaled to bring out the most detail. The images are each 5 8(130 kpc)wide.
profile (Figure 5), suggests that UGC1382 consists of three
morphological components: (1)a classical HSB bulge
embedded in (2)an HSB inner disk, which also contains a
small and weak set of spiral arms, all of which are surrounded
by(3)a very extended LSB disk with spiral arms.
To quantify ther-band surface brightness profile(Figure5),
we fit Sérsic (1963) functions using GALFIT (Peng
et al. 2002,2010). Specifically, we use GALFIT to fit a
two-dimensional image generated from the one-two-dimensional radial
profile with the assumption of a constant axial ratio and
position angle. We attempt both two- and three-componentfits,
each with an axial ratio of 0.69 and a position angle of 45°. For
each fit, we calculate the Akaike information criteria (AIC;
Akaike 1974). The AIC is used to determine which model
should be utilized, and is a dimensionless value taking into
account both the goodness of fit and the number of model
parameters. Wefind that the three-componentfit is favored by
Figure 2.Multiwavelength view of the LSB disk and spiral arms in UGC1382. In each panel, the ellipse has a semimajor axis of 80 kpc and represents the largest radius at which we detect stellar light. Left: color composite image of UGC1382. The red channel isi, the green channel isr, and the blue channel is a combination of
gand NUV. Patchy blue light to the northeast traces a faint spiral arm. Middle: the FUV image adaptively smoothed (adaptive smoothing utilizedasmooth, described in the“Users Guide to theXMM-NewtonScience Analysis System,”Issue 11.0, 2014(ESA:XMM-NewtonSOC))to a signal-to-noise of 10 to reveal the extended LSB disk while minimizing foreground and background contamination. Right: ther-band image smoothed with a four-pixel(1 6)boxcar kernel to highlight the patchy northeastern spiral arm. The two bright stars to the northeast and northwest were masked prior to smoothing.
Figure 3.21 cm column density and velocity maps. Left panel: HI column density map. The 10 contours are spaced linearly from 2.9×10¹⁹to 2.9×1020cm−2. The
synthesized beam is shown in the lower-left corner of the image. Middle panel: opticalr-band image(grayscale)with the HI column density contours overlaid in red. The dashed lines represent the two HI knots described in Section3.3. Right panel: velocity map and spectrum.
Table 2
Selected Properties of UGC1382
Quantity Value R.A.(J2000) 28°. 671011 decl.(J2000) −0°. 143342 Distance 80 Mpc UV/Optical Radius 80 kpc HI Radius 110 kpc SFR 0.42-+0.170.30Meyr− 1 Radial Velocity 5591±2 km s−1 Vrotat 110 kpc 280 km s−1 HI Mass 1.7(±0.1)×1010Me Stellar Mass(r<70 kpc) 8×10¹⁰Me Dynamical Mass(r<110 kpc) 2×10¹²Me
Dark Matter Fraction(r<110 kpc) 0.95
many orders of magnitude, and the relative likelihood of the
two-component fit is essentially zero. The three Sérsic
functions correspond directly to the three morphological components.
The central component of UGC1382, which has been
classified by numerous authors as an elliptical galaxy, is in fact
composed of a classical bulge and disk. Photometry for this
inner component is in Column5 of Table 1. The bulge has a
Sérsic index of n=3.5 and an effective radius of re=3 4 (1.3 kpc), while the inner disk has a Sérsic index of n=1.4 and an effective radius of re=15 8(6.0 kpc). The Sérsicfits
are summarized in Table 3. Comparing the fluxes of the two
fits, the bulge-to-disk ratio is 0.70. All of these values indicate
that the central component is consistent with a lenticular galaxy.
In Figure 6, we subtract the Sérsic fit to the inner disk
component, which clearly reveals a set of tightly wound spiral arms. This feature is coincident with an inner ring-like structure
seen in the far- and near-UV(FUV and NUV)images, which is
Figure 4. Radial surface brightness profiles of UGC1382, divided(top to bottom)into UV (GALEX), optical (SDSS), near-IR (2MASS), and mid-IR (WISE)panels. The offset applied to each profile(in magnitudes)is listed at the right in each of the panels. Dotted lines denote the divisions between the morphological components discussed in the text, and are identified in the top panel.
Figure 5.Three-componentfit to ther-band surface brightness profile. The bulge, inner disk, and outer LSB disk(which includes the spiral arms)have Sérsic indices of 3.5, 1.4, and 0.5, respectively. The bulge and inner disk together make the HSB component.
Table 3
Summary of Sérsic Fits for UGC1382 Morphological Component Quantity Bulge Inner Disk Outer LSB Arms
Sérsic Index,n 3.5 1.4 0.5
Effective Radius(kpc),re 1.3(3 4) 6.0(16″) 38(100″) Centralr-band Surface 17.5 20.1 25.8
Brightness(mag arcsec−2)
Totalmr(mag) 14.3 13.9 14.6
Figure 6. UGC1382 r-band image with the inner disk Sérsic component subtracted. A set of tightly wound spiral arms can easily be seen within a 1′ radius of the center.
also apparent in their radial profiles(labeled in the top panel of
Figure 4); therefore, these spiral arms are currently forming
stars at a low level (discussed further in Section 5). We
conclude that the HSB center of UGC1382 is a classic
lenticular galaxy with evidence for weak spiral structure and recent star formation.
Surrounding the normal lenticular galaxy, starting at a radius
of 66″(25 kpc), there is an extended LSB disk with prominent
spiral arms that we confidently detect to a radius of 3 5
(80 kpc). Photometry for the spiral arms is in Column6 of
Table1. We note that the photometry extends to 3′, but only
about 2% of the galaxyʼs light comes from the far outskirts, so
conclusions we draw using the data in Table1are valid for the
whole LSB component. This component contributes the
majority of the FUV and NUV flux (82% and 70%,
respectively) from the galaxy. Their blue color (FUV
−NUV=0.07 mag) implies current star formation. In the
optical, these spiral arms are more difficult to detect with
standard SDSS imaging, but with the deeper Stripe82 imaging,
we can convincingly quantify theirflux. The full extent of the
LSB disk and spiral arms can be seen in both the FUV andr
-band imaging, shown in Figure 2.
The Sérsicfit to the outer LSB disk in ther-band yields an
index ofn=0.5 and an effective radius ofre=100″(38 kpc). This is shallower than the exponential decline(n=1)typically seen in spiral galaxies. Furthermore, the inner disk-subtracted
image in Figure 6 hints that the inner spiral arms may form a
continuous structure with the outer spiral arms; we will return
to this point in Section 7.
Finally, for comparison with the GLSB literature, wefit an
exponential profile to the LSB disk forr>100″. We measure
the extrapolated central surface brightnesses in the g- andr
-band images and follow Jester et al. (2005) to transform the
results to Johnson B-band. This results in
μB(0)=26.2 mag arcsec−2 and an r-band scale length of
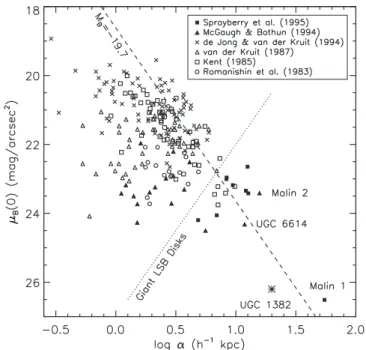
α=28.5±1.9 kpc (75″). Sprayberry et al. (1995) compare
these same quantities for a variety of LSB disks and define a
cutoff between normal and giant LSB disks using the
“diffuseness index,” where GLSB systems have
( )
mB 0 +5 loga>27 (for h=100). The“diffuseness index”
of UGC1382 is 32.7, so it is most certainly a GLSB galaxy.
This comparison, with the addition of UGC1382, is shown in
Figure7, confirming not only that it is a GLSB galaxy, but that
it is the system most comparable to the extreme nature of
Malin1. In addition, Figure 8 compares the radial profile of
UGC1382 to those of Malin1 and Malin2 (Bothun
et al. 1990), the two other most extreme GLSB systems. This
also highlights that the exponential scale length of UGC1382
is similar to that of Malin2, whereas its physical extent and
extrapolated central surface brightness are similar to those of Malin1.
3.2. Optical Spectroscopy
We have obtained spectra of one of the knots on the eastern side of the galaxy. The resulting spectrum, shown in the bottom
left of Figure 9, displays a prominent Hαline. It is redshifted
by about +200 km s−1relative to the systemic velocity of the
galaxy and is consistent with the value of the HI velocity map
at that position. The presence of the Hαline confirms that the
spiral arms are actively forming stars.
Also in Figure 9 is the SDSS fiber spectrum (r=1 5 or
570 pc)of the nucleus of UGC1382. It is typical of a bulge or
early-type galaxy. The nucleus consists of an old stellar population, with no evidence for nuclear star formation or AGN activity. The UV emission from the nucleus is, as
expected, a result of old stellar populations (e.g., Brown
et al.2000).
Figure 7.Relation between the B-band central surface brightnessμand scale lengthαof LSB disks, as recreated from Sprayberry et al.(1995). Galaxies with noteworthy GLSB disks are individually labeled. The dashed line represents a constant disk luminosity ofMB=−19.7(corresponding to anL*
disk), and the dotted line is the Sprayberry et al. division between normal and GLSB disks. UGC1382 is clearly in the regime of GLSB disks.Data sources: Romanishin et al.(1983), Kent(1985), van der Kruit(1987), de Jong & van der Kruit(1994), McGaugh & Bothun(1994), and Sprayberry et al.(1995).
Figure 8.Comparison of ther-band radial profiles of UGC1382, Malin1, and Malin2. Both the physical extent and the extrapolated central surface brightness of UGC1382 are similar to those of Malin1. UGC1382 has an exponential scale length similar to that of Malin2.Data sources: Barth(2007; Malin1, r<10 kpc), Moore & Parker (2006; Malin1, r>10 kpc),
3.3. Neutral Hydrogen Content
The HI in UGC1382, shown in Figure3, is distributed as a
disk with a major axis of 9 6 (220 kpc)and an apparent axial
ratio of 0.6. It is centered on the UV/optical galaxy and is
clumped in the two most prominent spiral arms. The mass of the HI disk is calculated as
( )= ´
ò
( ) ( )MHI M 2.36 105D2 S v dv, 1
whereDis distance in Mpc and
ò
S v dv( ) is the integral of theline flux density in Jy km s−1. We find an HI mass of 1.7
(±0.1)×1010Me, which is a factor of three larger than the
previous estimate of 5.6×10⁹Me(Garcia-Appadoo
et al. 2009). We attribute this difference to our higher
sensitivity and spatial resolution. Due to the lower sensitivity of the Garcia-Appadoo et al.(2009)spectrum, the linefit to that spectrum only picks out the narrow peak that is visible at
redshifted velocities in Figure3.
The HI column density map, seen in the left panel of
Figure 3, contains two bright knots, located to the east and
northwest of the nucleus. The knots together comprise 25% of
the HI flux. The masses of the eastern and northwestern knots
are approximately 1.8×10⁹Me and 2.6×10⁹Me,
respec-tively. As seen in the middle panel of Figure3, these knots are
coincident with the brightest regions of the spiral arms, where
the UV emission—and thus the star formation rate (SFR)—is
the highest. The HI disk extends further to the northeast of the galaxy center than to the southwest, similar to the stellar disk
highlighted in Figure2.
The HI velocity map, shown in the right panel of Figure3, is
consistent with a smoothly rotating disk with possible evidence for a slight warp. The projected peak-to-peak velocity
difference is ∼450 km s−1. The HI is clumped around the
spiral arms, and there is a hint that the spiral arms may continue
into the lenticular part of the galaxy (Figure 6), thus it is
possible that the lenticular component may not be kinemati-cally distinct from the spiral arms. However, a more detailed analysis of the kinematics of the lenticular part would be
necessary to confirm this. The HI velocity map also rules out
the presence of tidal streams, since we probe −500 km s−1
(blueward) and +800 km s−1 (redward) of the systemic
velocity.
The velocity spectrum, displayed in the inset of Figure3, is
slightly asymmetric. Ordinarily, this asymmetry indicates that the disk may be warped. The eastern knot, which is located on
the edge of the rotating disk, may also be enhancing theflux at
the redshifted end of the spectrum.
Although the HI is concentrated in the vicinity of the spiral arms, the otherwise smooth distribution of HI gas and the uniformity of the HI velocity map imply that the HI disk is smoothly rotating and relatively undisturbed. From this, we
infer that UGC1382 has not recently been affected by a
significant merger event.
3.4. Star Formation Efficiency and XUV Disk Classification
We compare the annular radial profiles of HI gas surface
density (SHI; not corrected to include helium) and the SFR
surface density (SSFR)in Figure 10. The annular averages of
SHI are less than 2Mepc−2, while the two HI knots (see
Figure 3) each have peak values of ∼3Mepc−2. The SHI
profile monotonically declines from the center to the edge of
the inner disk(atr=25 kpc), then modestly increases again in the regions where the outer spiral arms become strong
(25<r<45 kpc), and finally declines more rapidly beyond 45 kpc.
Figure 9.Spectra of the nucleus and a spiral arm/knot in UGC1382. Upper left: SDSS spectrum of the nucleus. Lower left: spectrum of a knot in the spiral arm. Vertical lines denote the wavelengths of several lines at the galaxyʼs systemic velocity. The+200 km s−1velocity offset(with respect to the systemic velocity of UGC1382)is consistent with the HI velocity at that location. Right: image of UGC1382 with the locations of the extracted spectra marked with red diamonds.
Figure 10.HI and SFR surface density profiles for UGC1382. Upper limits (3σ)are shown for data detected at less than 2.5σ. Morphological divisions are marked as in Figure4. The two profiles follow each other closely.
The SSFR profile was derived from the FUV surface
brightness profile, where the FUV has been corrected for
intrinsic attenuation using the HI column density map (Bigiel
et al.2010). This attenuation correction takes advantage of the
spatial distribution of the gas(and presumably dust)instead of
assuming a single or annularly averaged attenuation value. This
yields a maximum attenuation ofAFUV=0.26 mag within the
HI knots and a mean (median) value of AFUV=0.05
(0.07)mag over the entire HI disk. We then performed annular
photometry on the attenuation-corrected UV maps and applied an MW Galactic attenuation correction. In order to derive the
SSFR profile shown in Figure 10, we used the Salim et al.
(2007)FUV-to-SFR conversion. This profile is very similar to
the simple FUV profile shown in Figure4since the attenuation
is so low.
TheSSFR profile mirrors the shape of theSHI profile fairly
closely. The highestSSFRalso occurs at the galaxyʼs center and
declines very rapidly over 10 kpc; however, this is likely due to a highly evolved population of low-mass stars rather than recent star formation. Within the disk of the lenticular
component, the inner spiral arms cause a rise inSSFR between
10<r<25 kpc. A corresponding bump inSHIis not seen in
this region. Beyondr=25 kpc,SSFRincreases modestly out to
50 kpc, about 5 kpc beyond theSHIpeak. This is also seen in
the middle panel of Figure3, in which the spiral arms lead the
HI peaks in the direction of rotation. We are able to reliably detect star formation out to 80 kpc, whereSHI=0.6Mepc−2.
Just like Malin1, UGC1382 also has much in common with
the class of objects known as extended ultraviolet(XUV)disk
galaxies. UGC1382 can be classified as having a TypeI XUV
disk because it has structured UV-bright emission beyond the
expected location of the star formation threshold (μFUV=
27.25 mag arcsec−2 or SSFR =3 ´10-4Meyr−1kpc−2), as
defined by Thilker et al. (2007). The HI and SFR surface
densities of UGC1382 are typical of the low-star formation
efficiency found in the outer regions of spirals and dwarf
galaxies (Bigiel et al. 2010). In Figure 11, we plot the
distributions of pixel-by-pixelSSFRandΣgasof inner and outer
regions of spiral galaxies from Bigiel et al. (2010). The red
contours are the distribution of values forr<r25and the blue
contours represent the distribution for r>r25. The radial
annular values of UGC1382 forr>10 kpc(the regions where
FUV represents star formation)lie completely within the outer
region distribution of Bigiel et al. (2010). Even the lenticular
disk of UGC1382 is consistent with the outer regions of
spirals; this is not surprising given the generally low SFR and
gas density throughout UGC1382. The upturn of our data
points atlogSgas=0.35is due to the fact that our HI data have lower spatial resolution than the spirals in Bigiel et al.(2010).
3.5. Environment
Environment plays a significant role in the evolution of
galaxies, and in this section, we review the details about the
environment in which UGC1382 resides. To do this, we use
the NED (NASA/IPAC Extragalactic Database) environment
search tool10 to find all galaxies within 7°. 3 (10 Mpc at the
distance of UGC1382) and±2000 km s−1 within the NED
holdings. One must keep in mind that the numerous surveys compiled by NED are not homogeneous, so it is likely that this set of galaxies is incomplete.
Figure12shows the distribution of nearby galaxies in both
physical and velocity space. Thefirst panel(top left)represents the physical extent of its LSB disk with a radius of 100 kpc and
a velocity difference of±250 km s−1. One neighboring galaxy
satisfies these conditions. The second panel increases the
physical separation to 200 kpc and the velocity difference to
±500 km s−1, and yields an additional two neighboring
systems.
These three closest galaxies warrant further discussion. The
closest, SDSSJ015436.03-000922.7, is a tiny red galaxy that is
projected within the LSB disk of UGC1382. It was targeted by
SDSS despite its faintr-band magnitude(mr=18.4)because it
was originally classified as a high-redshift quasar. Its spectrum
is suggestive of an old stellar population typical of a bulge. Its morphology is a simple spherical bulge, and following Bell et al.(2003), we estimate a stellar mass of 5×10⁸Me. It has
an r-band Petrosian radius (Blanton et al. 2001) of 2 69
(1 kpc), which makes it either a dwarf galaxy or the tidally
stripped core of a larger system. It is 1.5arcmin(34 kpc)to the
southwest of the center with a radial velocity of 5495 km s−1,
which is 100 km s−1 blueward of the systemic velocity of
UGC1382. This relative velocity is consistent with the rotation
velocity of the HI disk at that location. We therefore believe
that the galaxy(or remnant)is embedded within the LSB disk.
Its physical significance is discussed further in Section7.
Two galaxies, SDSSJ015436.40-000417.2 and CGCG
386-053, have projected distances of 100 and 130 kpc with Figure 11.Comparison of the SFR and gas surface densities for UGC1382. Data points are from 6″-wide annuli in the galaxy, divided into whether they came from the inner disk(yellow circles), outer LSB spiral arms(red squares) or beyond the spiral arms (purple diamonds). The gas surface density is calculated by scaling the HI surface density by a factor of 1.36. Contours represent the distributions for nearby spiral galaxies from Bigiel et al.(2010): the upper(red)contours are forr<r25and the lower(blue)contours are for
r25<r<2r25. The 3σdetection limit for the contour data is marked with a dotted line. The dashed lines indicate gas depletion timescales of 109–1012 years.
10
velocity differences of+95 and−95 km s−1, respectively. The
former is a small galaxy, with a Petrosian radius of r=3 4
(1.3 kpc) and stellar mass of 109Me, and likely has not
played a significant role in the evolution of UGC1382. The
latter, however, is significantly larger, with a radius of 11 5
(4.4 kpc) and a stellar mass of 1.4×10¹⁰Me. This is
just under 20% of the UGC1382 stellar mass, so it is plausible
that CGCG386-053 has influenced the evolution of
UGC 1382.
We quantitatively measure the environment of UGC1382
following Blanton & Moustakas(2009). They use three criteria to select neighboring galaxies: a velocity within±600 km s−1,
a projected distance within 500/hkpc, and a brightness
- <
-MR 5 logh 18.5. The number of galaxies N that meet these criteria indicates whether the galaxy is isolated(N=0), in a poor group(1N3), in a rich group(4N9), or
in a cluster (N 10). Around UGC1382, only CGCG
386-053 has the required proximity and brightness, suggesting that
it is in anN=1 poor group. We conclude that UGC1382 is in
a low-density environment, possibly in a group with
CGCG386-053. Furthermore, there is likely a small
bulge-like system within its LSB disk.
3.6. The Physical Extent of UGC1382 in Context
It is interesting to compare the size of UGC1382 to that of
other giant galaxies. As summarized in Table2, UGC1382 has
HI gas disk measured out to a diameter of 220 kpc, with optical light detected to a diameter of 160 kpc.
The largest known galaxy is IC1101, a cD galaxy in Abell
2029, for which Uson et al. (1990) measured an R-band
diameter of ∼600 kpc. However, as a cD galaxy, IC1101 is
surrounded by tidal debris from the accretion of a multitude of smaller galaxies; it is not clear how to separate this intra-cluster
light from the extended envelope of the galaxy (Covone
et al. 2006). Therefore, it is likely that the diameter is much
smaller than 600 kpc, but still considerably larger than
UGC1382.
NGC262 is a tidally disturbed spiral galaxy with HI
dimensions of 216 kpc×274 kpc(adjusted toh=0.7; Simkin et al.1987). Due to the tidal interactions, it is not in a state of Figure 12.Environment of UGC1382. Cone: galaxies with radial velocities within±2000 km s−1of UGC1382 and within a 7°. 3 radius(10 Mpc at UGC1382).
Galaxies with higher declination than UGC1382 are marked with orange squares, and those with lower declination are marked with purple diamonds. This view is much wider than those in the circles, and shows a larger-scale view of the galaxyʼs environment. Circles: galaxies within 100 kpc to 1 Mpc projected separation and within±100 to±1000 km s−1of the radial velocity of UGC1382. Dotted lines are the distances from the previous circle. Galaxies with smaller radial velocities than UGC1382 are marked with blue diamonds, and those that have larger radial velocities are marked with red triangles. Galaxies are positioned based on their location in the plane of the sky. The upper-left circle has radial and velocity cuts corresponding to the size and rotation of the LSB disk of UGC1382; the single neighboring galaxy is likely embedded in the LSB disk.
equilibrium, and it is therefore difficult to compare its size to an undisturbed system.
The optical disk of Malin1 extends to a diameter of 220 kpc,
with HI also detected to 220 kpc. There is evidence that the outer LSB component is the result of interaction with
neighboring galaxies (Mapelli et al. 2008; Reshetnikov
et al. 2010). Malin1 is currently considered to be the largest
disk galaxy. Malin2 is a GLSB galaxy of similar scale to
Malin1, with an optical diameter of 120 kpc and HI diameter
of 220 kpc, and may also be interacting with a low-mass
satellite (Kasparova et al. 2014). Due to the similar size of
UGC1382 and NGC262, Malin1, and Malin2, we conclude
that UGC1382 is the among the largest known disk galaxies.
4. DYNAMICAL MASS AND DARK MATTER We have constructed a rotation curve from the HI velocity
map using velfit(version 2.0; Spekkens & Sellwood 2007;
Sellwood & Sánchez2010). The velocity map has 12″(4.6 kpc) pixels, so we cannot accurately probe the inner 10 kpc of the rotation curve. Outside of this radius, we measure the rotation
curve at 3 pixel (14 kpc) increments, which is approximately
the same scale as the beam size. We do not attempt to model the disk as a warped disk. The resulting curve is plotted in
Figure13.
In order to measure the dark matter profile, we must first
account for the mass profiles of stars and gas. We calculate the
mass of the stellar component using the r-band surface
brightness profile. We assume a radius-independent
mass-to-light ratio of 2.66, which we calculated using the modeled stellar mass in Table4(see Section5)and the totalr-band light
in Table1. For the mass contribution of the gas, we scaled the
HI mass profile by 1.36 to account for helium; regardless of this
factor, however, the gas only constitutes a tiny fraction(1%)of
the systemʼs total mass.
We fit the remaining dark matter with NFW (Navarro
et al. 1997)and Einasto (Einasto 1965) profiles. The bestfits
are shown as dashed blue and red lines, respectively, in
Figure13. The Einasto profile is a marginally betterfit than the
NFW profile beause it captures the decreasing velocity at large
radius. We find that UGC1382 is already dark matter
dominated at a radius of 5–10 kpc, just outside the bulge
component of the lenticular portion of the galaxy. At the
outermost point in our measured rotation curve (110 kpc), we
find that the total enclosed mass is 2×10¹²Me, which
corresponds to a dark matter fraction of 0.95 and an r-band
mass-to-light ratio of∼65.
5. SED MODELING
We now use SEDfitting to explore the physical parameters
of UGC1382. Wefit the SEDs of the whole galaxy as well as
those of the HSB lenticular and LSB spiral arm components. To check the robustness of our physical parameter results, we
have utilized two different fitting codes: GalMC (Acquaviva
et al. 2011) and LePHARE (Arnouts et al. 1999; Ilbert
et al. 2006). By using two fitting procedures, we can make
better estimates of the physical parameters(Hayward & Smith
2015; Santini et al.2015), which allows us to infer the past and future evolution of the system.
5.1. GalMC
GalMC utilizes a Markov-Chain Monte Carlo (MCMC)
approach, avoiding the problems of Chi-squarefitting routines,
which can miss degeneracies orfind local instead of global best
fits. GalMC fits over a range of 0.15–3μm, and does not
include low-energy dust physics.
We used Charlot and Bruzual 2007 stellar population
synthesis models (Bruzual & Charlot 2003) and adopted the
Salpeter (1955) initial mass function (IMF) with
Mmin=0.1Me and Mmax=100Me. We use the Calzetti
et al.(2000)reddening law and account for absorption by the
intergalactic medium using Madau(1995). The metallicity was
fixed at solar. Five percent photometric errors were added in
quadrature to the known errors in order to account for the error in absolute calibration.
We chose four free parameters: stellar mass, the time since the onset of star formation,E(B−V), and the exponential star
formation timescale τ, whereSFRµexp(-t t). The current
SFR is calculated as ( ) t = -t t - t e e M e SFR 1 , 2 A A A
whereAis the age(onset of star formation)and Mis the total
mass. We included nebular emission lines and nebular
continuum only when fitting the spiral arms. Although the
HSB lenticular component has active star formation as well, the
addition of emission lines to the HSB fits caused only a
negligible change in the physical parameters.
For the LSB disk component,τwas several gigayears, so we
also considered a constant SFH. To determine whether the exponential or constant SFH model was best, we calculated
their corrected Akaike information criterion(AIC; Akaike1974;
Hurvich & Tsai1989). The ratio of the exponential SFH AIC to
the constant SFH AIC was∼1015, meaning that the exponential
SFH is the superior model.
A major concern when using MCMC methods is checking convergence. We ran four chains from randomly chosen starting locations in parameter space to help ensure
conv-ergence (Acquaviva et al. 2011). We used CosmoMCʼs
program GetDist(Lewis & Bridle2002)to analyze the chains.
Since we have multiple chains, we use the Gelman & RubinR
statistic to test for convergence (Gelman & Rubin 1992;
Figure 13.HI-derived rotation curve and contributing mass components. The black points are the measured rotation curve. The measured stellar and gaseous components are black and green lines, respectively. Two models of the remaining dark matter—NFW and Einasto profiles—are shown by blue and red dashed lines. The combined rotation curves, using each of the dark matter models, are plotted with solid blue and red lines.
Brooks & Gelman1998). All of ourR−1 values were0.02, which shows convergence; the standard value for convergence isR−1<0.1.
5.2. LePHARE
The LePHARE FUV to near-IR SEDfitting was done using
a grid of Bruzual & Charlot (2003) stellar evolution models
with a Chabrier (2003) IMF with Mmin=0.15 Me and
Mmax=120Me. The grid was constructed from 13
exponen-tial SFH models with timescales ranging from 0.1 to 30 Gyr
and metallicities of Zeand 0.4Ze. For each of these models,
SEDs were computed for ages(time since formation)ranging
from 0 to 13 Gyr. Dust attenuation is applied for three different
extinction laws: SMC (Prevot et al. 1984), starburst galaxy
(Calzetti et al.2000), and a power law with a slope of 0.9. We
used 13 discrete values ofE(B−V)ranging from 0.0 to 0.6.
The code returns best-fit values for physical parameters
including stellar mass, SFR, specific SFR(sSFR), and age, as
well as median values based on their probability distributions. The extinction law andE(B−V)are best-fit values only.
5.3. SED Modeling Results
The model SEDs are overlaid on the photometric data in
Figure14, and the associated physical parameters(stellar mass,
Note.The physical parameters found for UGC1382 and its components using the GalMC and LePHARE SEDfitting routines. 1σerrors are included when calculated by each routine.
Figure 14.Photometric data from Table1overlaid with SEDfits, shown in blue, for the whole galaxy, the HSB lenticular component, and the LSB disk. Data not used forfitting are marked with open circles. Top row: GalMC results. Bottom row: LePHARE results, divided into the stellar and dusty components(gray lines).
age, reddening, SFR timescale, SFR, and sSFR) are given in
Table 4. The processed mass (from GalMC modeling only)
includes the current stellar mass plus the mass that has been processed through previous generations of stars. The inter-pretation of age is ambiguous; mathematically, it is the time of
the onset of star formation, but its physical meaning is difficult
to determine, primarily due to degeneracies with other parameters. The errors for the parameters account for statistical
errors in the fitting process, and do not include systematic
effects due to the models themselves.
Comparing the model parameters for each of the physical
components, we find that the masses, SFRs, and timescales τ
are logically consistent, i.e., combining the HSB and LSB model values yields something equivalent to the values found for the whole galaxy. The parameters generated by GalMC and LePHARE are reasonably consistent, and we attribute most of the differences to the use of different stellar libraries.
Wefind that the stellar mass of the galaxy is approximately
8×10¹⁰Me. Both the GalMC and LePHARE values are
consistent with the previous estimate of
-+
5.0 3.814.9×1010Me(West et al. 2010), which used the Bell et al. (2003)stellarfitting models. It is important to note that the choice of IMF affects the stellar mass measurement.
Converting the LePHARE stellar mass to a Salpeter (1955)
IMF increases the mass by about 0.2dex (Chabrier 2003),
making it even more similar to that measured by GalMC. The models agree that the lenticular portion of the galaxy contributes about 80% of the total stellar mass, and the extended LSB spiral arms provide the remaining 20%. The current stellar mass comprises 70% of the total mass processed over the galaxyʼs lifetime.
The reddening within UGC1382 is low in both the HSB
lenticular component and LSB spiral arms. GalMC finds that
all are consistent with zero. LePHARE only measures modest reddening in the LSB arms, and none in the lenticular component. Given the ongoing star formation within both the inner disk of the lenticular component and in the spiral arms, we would expect to see at least some reddening in both components. However, since the HSB lenticular bulge and disk are modeled as a single component, the low-dust older stellar populations within the bulge likely dominate the reddening estimate.
The SFR of UGC1382 is extremely low in the HSB
lenticular portion. LePHARE computes the LSB disk SFR to be greater than that of the whole galaxy; this may be an artifact of combining two distinct populations into one model. Taking the SFRs from GalMC, the LSB spiral arms dominate with
rates of 0.2–0.3Meyr−1, which is 85% of the total SFR.
The SFR can also be determined directly from the galaxyʼs
UV flux. We used the HI-based FUV attenuation correction
from Bigiel et al. (2010), which assumes (1)MW-like
attenuation, (2)the FUV originates from the midplane so that
only half of the dust/gas contributes to the attenuation, and
(3)AFUV/E(B−V)=8.24 (Wyder et al. 2007). Combined
with the SFR law from Salim et al.(2007), the LSB spiral arms
have an SFR of0.37-+0.17
0.30M
eyr−1, which is consistent with the SFRs found with both GalMC and LePHARE. In addition, we
canfind the SFR of the tight inner arms within the lenticular
disk seen in Figure6, since they are minimally contaminated by
UV bulgeflux. Including only theflux between radii of 30 and
66 arcsec (11 and 25 kpc; labeled in Figure 4), its SFR is
-+
0.05 0.020.04Meyr−1, which is also very similar to the GalMC and
LePHARE SFRs. The total UV-derived SFR of UGC1382 is
therefore0.42-+0.170.30Meyr−1.
The exponential SFH timescale (τ) is strongly degenerate
with age, so one must be careful to not over-interpret either of them. Therefore, we only make broad comparisons between components. From both GalMC and LePHARE, we can deduce that the lenticular component formed rapidly compared to the
LSB spiral arms, as both models suggest a shorter τ.
Interestingly, both methods also suggest that the lenticular component is about 4 Gyr younger than the LSB spiral arms, so
the spiral arms have likely been present in UGC1382 for a
significant amount of time, which is difficult to explain by
standard inside-out secular evolution.
6. EVOLUTION THROUGH THE GREEN VALLEY
The UV/optical color–magnitude diagram (CMD) of
galaxies from Wyder et al. (2007) is an excellent diagnostic
for separating red (passive) and blue (star-forming) galaxies
due to both the long wavelength lever arm and utilizing UV as
a direct tracer of SF. The position of UGC1382 is shown in
Figure15. The lenticular component, considered alone, aligns
with the red sequence of galaxies. Once the LSB spiral arms are
included, it shifts to the green valley. This places UGC1382
among the galaxies considered to be transitioning between the blue and red sequences.
The long exponential star formation timescale of
τ∼2.5 Gyr found by the SEDfitting indicates that the spiral
arms have been forming stars for a long time. If the arms are Figure 15. Galaxy CMD from Wyder et al. (2007) with the position of UGC1382(filled green triangle), which is in the green valley. The positions of just the lenticular component(filled red diamond)and just the LSB spiral arms (filled blue square)are also marked. The unfilled symbols refer to the location of each component at 1, 2, and 3 Gyr in the past and future, going from past to future as indicated by the arrows, assuming the exponentially declining SFH derived from our modeling. The dotted lines represent the locations of the red and blue sequences found in Wyder et al.(2007).
old (∼10 Gyr according to the SED modeling), it is plausible
that the spiral arms have been present for most of the galaxyʼs
history, and the galaxy is very slowly moving away from the blue sequence.
This is confirmed by simulating the galaxyʼs evolution.
Individually for the lenticular component and LSB spiral arms, we set ages of 1, 2, and 3 Gyr into the past and future. Using the associated GalMC exponential star formation timescale in
Table4, wefind the SFR and stellar mass at each age, with the
assumption that the dust extinction does not evolve. We extract
the FUV, NUV, and r photometry from the corresponding
SEDs. At each age, we add the extracted flux from the bulge
and spiral arms to represent the entire galaxy. The photometry
for each of these is plotted in Figure 15, with the younger
versions to the bottom left and the aged versions to the upper right. The evolution of the whole galaxy indicates that
UGC1382 was much bluer and brighter in the past, so much
so that it may have been in the blue sequence as recently as 2 Gyr ago.
The HSB lenticular component of the UGC1382 is what one
would expect—old, nearly quenched, and relatively quiescent.
It resides on the red sequence (Figure15), lies well below the
galaxy main sequence(Figure16), and has an sSFR typical of
non-star-forming bulge systems. The outer LSB spiral arm
region would be a blue sequence galaxy by itself(Figure15)
and lies within 2σ of the galaxy main sequence (Figure 16)
with an sSFR for normal disks.
The fact that UGC1382 is in the green valley implies that
UGC1382 is either evolving from the blue to red sequence as
star formation shuts off(i.e., secular evolution)or that it was a red sequence galaxy that has been recently rejuvenated either
The idea that UGC1382 is a recently rejuvenated red
sequence galaxy is unlikely to be true for three reasons.(1)The outer LSB spiral arms, which are actively forming stars at a modest rate, appear to be at least as old as the central lenticular portion.(2)The outer spiral arms appear to be a continuation of the weak inner arms and disk, and hence are not a recently accreted system.(3)The HI is distributed in a large, uniformly
rotating disk and shows no obvious signs of significant
interaction. All of this points to the LSB spiral arms and disk not being a recent addition.
If, on the other hand, UGC1382 is transitioning from the
blue cloud to the red sequence, it is unlikely to complete the transformation very quickly. At best, if the SFR is exponen-tially decaying, it may reach the red sequence within 3 Gyr. However, it is just as likely that, if undisturbed, the current modest SFR will continue at a constant rate. Using our estimate of the total HI mass, if all of the HI gas were converted to stars at the GalMC and UV-derived SFRs, the gas depletion timescales are 64-+44181Gyr and41-+1729Gyr, respectively. Under
a constant star formation scenario, UGC1382 will effectively
be a permanent green valley resident. The truth probably lies somewhere in between.
7. FORMATION SCENARIOS
The formation of GLSB galaxies is not well understood, and there are a number of possible formation scenarios. The most widely accepted theories involved either major collision perturbations(e.g., Mapelli et al.2008), the evolution of disk galaxies within a massive dark matter halo in isolated environments(e.g., Hoffman et al.1992), or the tidal disruption
and accretion of gas-rich dwarf galaxies (e.g., Peñarrubia
et al. 2006). The physical properties of UGC1382 are more
consistent with the dwarf tidal disruption scenario.
Most major galaxy interactions will likely result in the
destruction of disks(Wilman et al. 2013). However, Mapelli
et al.(2008)propose that collisional ring galaxies may be the
precursors of GLSB galaxies. TheirN-body simulations show
that the expanding rings can redistribute both mass(stellar and
gas)and angular momentum out to 100 kpc or more from the
center of a galaxy while leaving a normal stellar bulge
component at the center of(or slightly offset from)the system.
The ring structure dominates for thefirst 100 to 200 Myr after
the collision but will fade and become indistinguishable from
the rest of the disk after 0.5–1 Gyr. As the disk expands, its
surface density decreases by an order of magnitude. The
surface brightness profiles of Malin1, Malin2, UGC6614,
and NGC7589 can be well matched to this model.
Figure 16.Position of UGC1382(green triangle)relative to the star-forming galaxy main sequence, displayed in terms of both SFR(top panel)and sSFR (bottom panel). The gray regions are the 1σand 2σspread in the main sequence as found in Elbaz et al.(2007)for local SDSS galaxies(0.015z0.1). The HSB lenticular(red diamond)and LSB spiral arms(blue square)of UGC1382 are also included. The UGC1382 SFR is calculated from the FUVflux, though the Elbaz et al. relation is derived from Hα.
The collisional ring scenario is not well supported by
UGC1382 for two reasons. First, the simulations predict
relatively smooth LSB disks without the spiral arm structures
that are obvious in UGC1382(as well as several other GLSB
galaxies). Mapelli et al.(2008)suggest that the lack of spiral arm structure in the models may be a consequence of numerical resolution. Second, because the ring structure would have an intense burst of star formation, one would expect the resultant extended LSB disk to be characterized by a stellar population with an average age younger than the bulge component. The
UGC1382 LSB disk is at best the same age as the bulge and
very possibly older than the bulge. Furthermore, one would
expect the exponential star formation timescale (τ) for an
expanding ring to be short because the ring phase is less than
∼0.2 Gyr, but for the LSB disk of UGC1382,τ3 Gyr.
In contrast to a major collision, another formation scenario proposes secular evolution in a low-density environment. LSB disk galaxies of any size tend to be found in low-density
environments near the outer parts of cosmological filaments
and even in voids (Rosenbaum & Bomans 2004; Rosenbaum
et al.2009). Isolation from interactions and major mergers may
be a crucial element in the survival of LSB systems (Galaz
et al. 2011). GLSB galaxies have the additional property of
being dominated by massive (>1012Me) dark matter halos,
which may protect against disk instabilities (e.g., Ostriker &
Peebles 1973; Mayer & Wadsley 2004; Das2013). Hoffman
et al. (1992) theorize that when rare, large 3σ density
perturbations occur within voids, the cooling time is shorter than the dynamical time only in the central regions. This leads to fast bulge formation while the outer regions form a thin, self-gravitating centrifugally supported disk over a Hubble time. They conclude that this is a natural formation scenario for GLSB galaxies. However, in this pure secular evolution theory, one would expect the LSB disk to have a mean age that is
younger than the central HSB component. UGC1382 conflicts
with this scenario because the LSB disk is likely older than the HSB central region.
Noguchi(2001)proposes another method to create a GLSB
galaxy through secular evolution. In this scenario, a normal HSB galaxy creates a bar, which induces radial mixing and moves material to the galaxy outskirts. Over the course of several gigayears, the central surface brightness decreases by
1.5 mag arcsec−2and the disk scale length doubles. This model
predicts spiral arm features in the outer disk, which we observe, but it also requires the presence of a large bar, for which we see no evidence. We therefore rule out this model as the way
UGC1382 formed. As a final pathway for secular evolution,
one can imagine a scenario in which the isolated halo initially formed a normal disk, then something triggers a disk
instability, driving significant amounts of gas toward the center
region. This would form an HSB lenticular component in a relatively short period of time, while the outer portions continue their slower evolution. However, what would limit the size of the lenticular disk to what we see today is a mystery.
The final option we consider for the formation of a GLSB
extended disk is the tidal disruption and accretion of dwarf galaxies. In an effort to explain the extended disk of M31,
Peñarrubia et al.(2006)model the accretion of co-planar dwarf
galaxies and find that the mechanism can generate LSB
exponential disks as large as r=200 kpc depending on the
stellar concentration of the accreted system. Although it depends on the initial orbit and stellar density of the satellite,
an exponential disk about the host can develop as quickly as 3 Gyr after accretion for a 2:1 mass ratio. Furthermore, spiral-like features in the extended disk are also predicted. Another prediction of the model is that the extended LSB disk will have
a circular velocity 30–50 km s−1 lower than the host if the
initial satellite orbit was circular and 100–200 km s−1lower if it is initially eccentric. The rotation curve of UGC1382 hints at a
modest turnover in the outer regions of 44±16 km s−1
relative to the peak value. Higher precision kinematic information, especially of the stellar component, is required to confirm this difference.
If the LSB disk of UGC1382 originates from tidal
disruption of dwarf galaxies, the model also needs to explain the high HI gas mass in the outer regions. Only 10% of the
neutral gas of UGC1382 resides inside the central HSB
lenticular component. This corresponds to a gas mass fraction
of fg =Mgas (Mgas+M*)=0.03. For the LSB disk,
fg=0.58. Although the LSB disk is gas-rich, it falls within
the typical range of LSB dwarf galaxies, which are the most
gas-rich systems known with fg=0.4–0.8 (Schombert
et al. 2001). If the accretion event was 3 Gyr ago, following
the star formation history of the LSB disk modeled in Section5,
the accreted material would have had fg=0.63. Hence the
accretion of a single large-mass or several moderate-mass
systems are sufficient to provide the stellar and gas material
found in the extended disk of UGC1382. LSB dwarfs are
preferentially located in low-density environments(Rosenbaum
& Bomans 2004; Rosenbaum et al. 2009) such as that of
UGC1382, so accretion of one or more would be feasible. By
allowing independent evolutionary histories for the HSB central component and the extended LSB disk, the relative ages of the stellar populations can be easily explained. That is,
the age of the LSB disk should reflect the age of the accreted
satellite(s), which can be older than the central HSB disk. It is interesting to consider that one of the projected systems,
SDSSJ015436.03-000922.7, which appears to be a low-mass
bulge-type system, may be a candidate for a remnant core of an LSB dwarf galaxy. If the HI disk truly has a slight warp, it may be attributed to the accretion of a dwarf system. The only discrepancy with the dwarf accretion scenario is in the
morphology of UGC1382. We have presented imaging
evidence that the inner HSB lenticular spiral arms may connect
directly to the outer LSB spiral arms (see Figure 6); this
suggests that the LSB and HSB components might not be kinematically distinct. If so, this may contradict an accretion scenario.
Because there are no strong inconsistencies between
UGC1382 and the dwarf satellite accretion build-up of its
LSB disk, we favor this formation scenario. Further observa-tions exploring the stellar and gas metallicity and kinematics of the HSB component and the LSB disk in detail will help
confirm or refute this formation mechanism.
8. SUMMARY AND CONCLUSIONS
We have presented observations and analyses of UGC1382,
a GLSB galaxy that has previously been mistaken for an elliptical galaxy. Below are our conclusions about this unique system.
1. Morphologically, UGC1382 can be described as being
composed of an HSB lenticular galaxy surrounded by an LSB disk. This LSB disk has a spiral arm structure that
3. UGC1382 resides in a low-density environment; it has a
dwarf system/remnant embedded in its LSB disk, and the
nearest large galaxy is about 1.6 Mpc away. Like other
GLSB galaxies, UGC1382 is dark matter dominated
with a dark matter fraction of 0.95, and it has a
dark-matter halo mass of 2×10¹²Me. It is therefore
unsurprising that we find no evidence for recent major
galaxy interactions. It is likely that the LSB disk
component of UGC1382 could only exist in this type
of environment.
4. From modeling the SEDs of both the inner lenticular component and outer LSB spiral arms, we have
determined that the total stellar mass of UGC1382 is
8×10¹⁰Me, 20% of which is in the LSB component.
Both components are nearly dust-free. The overall SFR is
∼0.4Meyr−1, 85% of which is in the LSB disk. The LSB
disk is about 4 Gyr older than the central lenticular component and has a characteristic star formation
time-scale that is significantly longer; this makes it unlikely
that the disk is a recent acquisition.
5. UGC1382 resides in the “green valley” of the galaxy
CMD. Based on the SED modeling result that the star formation is exponentially declining, the galaxy appears to be transitioning from the blue to the red sequence. However, with its low SFR and huge HI reservoir, it has the capacity to stay in the green valley for several Hubble times.
6. The properties of UGC1382 are most consistent with the
formation scenario following Peñarrubia et al. (2006). In
this scenario, the core lenticular galaxy accretes one (or
more)gas-rich dwarf galaxies, which are responsible for
both forming the disk and for providing the fuel for the subsequent and ongoing low-level star formation. This quantitatively agrees with our observations of a gas-rich disk that is older and has a longer star formation timescale than the lenticular core, as well as with the presence of a tiny dwarf galaxy in the LSB disk.
The detection of the extended, LSB stellar component
surrounding UGC1382 and subsequent classification of this
system as a GLSB galaxy has implications on our
under-standing of other seemingly“normal”early-type galaxies. The
increasing availability of sensitive optical, UV, and HI observations of early-type galaxies may reveal additional cases
similar to UGC1382. A census of the low surface brightness
stellar and gas content of early-type galaxies would help place interesting constraints on star formation properties in bulge-dominated galaxies as well as the importance of different processes in the evolution of galaxies.
Computer and Cyberinfrastructure Unit of Information Tech-nology Services at The Pennsylvania State University for providing computational support and resources. In particular, we appreciate the very helpful William Brouwer. The Institute for Gravitation and the Cosmos is supported by the Eberly
College of Science and the Office of the Senior Vice President
for Research at the Pennsylvania State University. Observa-tions are based in part on data obtained at the duPont 2.5 m telescope at the Las Campanas Observatories of the Carnegie Institution for Science.
REFERENCES
Abazajian, K. N., Adelman-McCarthy, J. K., Agüeros, M. A., et al. 2009, ApJS,182, 543
Acquaviva, V., Gawiser, E., & Guaita, L. 2011,ApJ,737, 47 Aihara, H., Allende Prieto, C., An, D., et al. 2011,ApJS,193, 29 Akaike, H. 1974, ITAC,19, 719
Alam, S., Albareti, F. D., Allende Prieto, C., et al. 2015,ApJS,219, 12 Arnouts, S., Cristiani, S., Moscardini, L., et al. 1999,MNRAS,310, 540 Baillard, A., Bertin, E., de Lapparent, V., et al. 2011,A&A,532, A74 Barth, A. J. 2007,AJ,133, 1085
Bell, E. F., McIntosh, D. H., Katz, N., & Weinberg, M. D. 2003, ApJS, 149, 289
Bigiel, F., Leroy, A., Walter, F., et al. 2010,AJ,140, 1194
Blanton, M. R., Dalcanton, J., Eisenstein, D., et al. 2001,AJ,121, 2358 Blanton, M. R., & Moustakas, J. 2009,ARA&A,47, 159
Boissier, S., Gil de Paz, A., Boselli, A., et al. 2008,ApJ,681, 244 Bothun, G. D., Impey, C. D., Malin, D. F., & Mould, J. R. 1987,AJ,94, 23 Bothun, G. D., Schombert, J. M., Impey, C. D., & Schneider, S. E. 1990,ApJ,
360, 427
Brooks, S. P., & Gelman, A. 1998, Journal of Computational and Graphical Statistics, 7, 434
Brown, T. M., Bowers, C. W., Kimble, R. A., Sweigart, A. V., & Ferguson, H. C. 2000,ApJ,532, 308
Bruzual, G., & Charlot, S. 2003,MNRAS,344, 1000 Buta, R. J. 2011, arXiv:1102.0550
Calzetti, D., Armus, L., Bohlin, R. C., et al. 2000,ApJ,533, 682 Chabrier, G. 2003,PASP,115, 763
Cohen, M., Wheaton, W. A., & Megeath, S. T. 2003,AJ,126, 1090 Covone, G., Adami, C., Durret, F., et al. 2006,A&A,460, 381 Das, M. 2013, JApA,34, 19
de Jong, R. S., & van der Kruit, P. C. 1994, A&AS,106, 451
Doyle, M. T., Drinkwater, M. J., Rohde, D. J., et al. 2005,MNRAS,361, 34 Einasto, J. 1965, TrAlm,5, 87
Elbaz, D., Daddi, E., Le Borgne, D., et al. 2007,A&A,468, 33
Galaz, G., Herrera-Camus, R., Garcia-Lambas, D., & Padilla, N. 2011,ApJ, 728, 74
Garcia-Appadoo, D. A., West, A. A., Dalcanton, J. J., Cortese, L., & Disney, M. J. 2009,MNRAS,394, 340
Gelman, A., & Rubin, D. B. 1992, StaSc, 7, 457
Hayward, C. C., & Smith, D. J. B. 2015,MNRAS,446, 1512 Hoffman, Y., Silk, J., & Wyse, R. F. G. 1992,ApJL,388, L13 Huchra, J., Davis, M., Latham, D., & Tonry, J. 1983,ApJS,52, 89 Huchra, J. P., Macri, L. M., Masters, K. L., et al. 2012,ApJS,199, 26
Huchra, J. P., Vogeley, M. S., & Geller, M. J. 1999,ApJS,121, 287 Hurvich, C. M., & Tsai, C.-L. 1989,Biometrika, 76, 297
Ilbert, O., Arnouts, S., McCracken, H. J., et al. 2006,A&A,457, 841 Impey, C., & Bothun, G. 1997,ARA&A,35, 267
Jester, S., Schneider, D. P., Richards, G. T., et al. 2005,AJ,130, 873 Kasparova, A. V., Saburova, A. S., Katkov, I. Y., Chilingarian, I. V., &
Bizyaev, D. V. 2014,MNRAS,437, 3072 Kent, S. M. 1985,ApJS,59, 115
Laurikainen, E., Salo, H., Teerikorpi, P., & Petrov, G. 1994, A&AS,108, 491 Lelli, F., Fraternali, F., & Sancisi, R. 2010,A&A,516, A11
Lewis, A., & Bridle, S. 2002,PhRvD,66, 103511 Madau, P. 1995,ApJ,441, 18
Mapelli, M., Moore, B., Ripamonti, E., et al. 2008,MNRAS,383, 1223 Martin, D. C., Fanson, J., Schiminovich, D., et al. 2005,ApJL,619, L1 Matthews, L. D., van Driel, W., & Monnier-Ragaigne, D. 2001,A&A,365, 1 Mayer, L., & Wadsley, J. 2004,MNRAS,347, 277
McGaugh, S. S., & Bothun, G. D. 1994,AJ,107, 530
Meyer, M. J., Zwaan, M. A., Webster, R. L., et al. 2004,MNRAS,350, 1195 Moffett, A. J., Kannappan, S. J., Baker, A. J., & Laine, S. 2012,ApJ,745, 34 Moore, L., & Parker, Q. A. 2006,PASA,23, 165
Nair, P. B., & Abraham, R. G. 2010,ApJS,186, 427
Navarro, J. F., Frenk, C. S., & White, S. D. M. 1997,ApJ,490, 493 Noguchi, M. 2001,MNRAS,328, 353
Ostriker, J. P., & Peebles, P. J. E. 1973,ApJ,186, 467
Peñarrubia, J., McConnachie, A., & Babul, A. 2006,ApJL,650, L33 Peng, C. Y., Ho, L. C., Impey, C. D., & Rix, H.-W. 2002,AJ,124, 266 Peng, C. Y., Ho, L. C., Impey, C. D., & Rix, H.-W. 2010,AJ,139, 2097 Pickering, T. E., Impey, C. D., van Gorkom, J. H., & Bothun, G. D. 1997,AJ,
114, 1858
Prevot, M. L., Lequeux, J., Prevot, L., Maurice, E., & Rocca-Volmerange, B. 1984, A&A,132, 389
Reshetnikov, V. P., Moiseev, A. V., & Sotnikova, N. Y. 2010, MNRAS, 406, L90
Romanishin, W., Strom, K. M., & Strom, S. E. 1983,ApJS,53, 105 Rosenbaum, S. D., & Bomans, D. J. 2004,A&A,422, L5
Rosenbaum, S. D., Krusch, E., Bomans, D. J., & Dettmar, R.-J. 2009,A&A, 504, 807
Salim, S., & Rich, R. M. 2010,ApJL,714, L290
Salim, S., Rich, R. M., Charlot, S., et al. 2007,ApJS,173, 267 Salpeter, E. E. 1955,ApJ,121, 161
Sánchez Almeida, J., Aguerri, J. A. L., Muñoz-Tuñón, C., & Huertas-Company, M. 2011,ApJ,735, 125
Santini, P., Ferguson, H. C., Fontana, A., et al. 2015,ApJ,801, 97 Schlegel, D. J., Finkbeiner, D. P., & Davis, M. 1998,ApJ,500, 525 Schombert, J. M., McGaugh, S. S., & Eder, J. A. 2001,AJ,121, 2420 Sellwood, J. A., & Sánchez, R. Z. 2010,MNRAS,404, 1733 Sérsic, J. L. 1963, BAAA,6, 41
Simkin, S. M., van Gorkom, J., Hibbard, J., & Su, H.-J. 1987,Sci,235, 1367 Spekkens, K., & Sellwood, J. A. 2007,ApJ,664, 204
Sprayberry, D., Impey, C. D., Bothun, G. D., & Irwin, M. J. 1995, AJ, 109, 558
Thilker, D. A., Bianchi, L., Meurer, G., et al. 2007,ApJS,173, 538 Thilker, D. A., Bianchi, L., Schiminovich, D., et al. 2010,ApJL,714, L171 Tonry, J. L., & Davis, M. 1981,ApJ,246, 666
Uson, J. M., Boughn, S. P., & Kuhn, J. R. 1990,Sci,250, 539 van der Kruit, P. C. 1987, A&A,173, 59
West, A. A., Garcia-Appadoo, D. A., Dalcanton, J. J., et al. 2010,AJ,139, 315 Wilman, D. J., Fontanot, F., De Lucia, G., Erwin, P., & Monaco, P. 2013,
MNRAS,433, 2986
Wright, E. L. 2006,PASP,118, 1711
Wright, E. L., Eisenhardt, P. R. M., Mainzer, A. K., et al. 2010,AJ,140, 1868 Wyder, T. K., Martin, D. C., Schiminovich, D., et al. 2007,ApJS,173, 293