Analysis of the impact of sampling on NetFlow traffic
classification
Valent´ın Carela-Espa˜nola,∗, Pere Barlet-Rosa, Albert Cabellos-Aparicioa, Josep Sol´e-Paretaa
aDept. Arquitectura de Computadors, Universitat Polit`ecnica de Catalunya
(UPC), Campus Nord, Edif. D6, C. Jordi Girona, 1-3, 08034 Barcelona, Spain
Abstract
The traffic classification problem has recently attracted the interest of both net-work operators and researchers. Several machine learning (ML) methods have been proposed in the literature as a promising solution to this problem. Sur-prisingly, very few works have studied the traffic classification problem with Sampled NetFlow data. However, Sampled NetFlow is a widely extended mon-itoring solution among network operators. In this paper we aim to fulfill this gap. First, we analyze the performance of current ML methods with NetFlow by adapting a popular ML-based technique. The results show that, although the adapted method is able to obtain similar accuracy than previous packet-based methods (≈90%), its accuracy degrades drastically in the presence of sampling. In order to reduce this impact, we propose a solution to network operators that is able to operate with Sampled NetFlow data and achieve good accuracy in the presence of sampling.
Keywords: Traffic classification, Machine Learning, Network Management
1. Introduction
Traffic classification is crucial for classic network management tasks, such as traffic engineering and capacity planning. However, traffic classification is a difficult problem that requires the use of very complex identification techniques due to the ever-changing nature of Internet traffic and applications. Conse-quently, this problem has increasingly attracted the interest of both network operators and researchers. In particular, a new class of applications (e.g., P2P, VoIP and video streaming) has significantly increased its presence in the In-ternet. These applications are particularly difficult to identify and, typically, have severe resource demands, either in terms of bandwidth (e.g., P2P) or QoS
∗Corresponding author (Tel: +34 934017182, Fax: +34 934017055)
Email addresses: [email protected](Valent´ın Carela-Espa˜nol),[email protected]
(Pere Barlet-Ros),[email protected](Albert Cabellos-Aparicio),[email protected] (Josep Sol´e-Pareta)
requirements (e.g., low delay and jitter for VoIP applications), which pose an additional challenge to network operators and to the classification problem.
Traditionally, the port numbers were used to classify the network traffic (e.g., well-known ports registered by the IANA [1]). Nevertheless, nowadays it is widely accepted that this method is no longer valid due to its inaccuracy and incompleteness of its classification results [2–5].
The first alternatives to the well-known ports method relied on the inspection of the packet payloads in order to classify the network traffic [3–6]. These meth-ods, usually called deep packet inspection (DPI) techniques, consist of looking for characteristic signatures (or patterns) in the packet payloads. Although this solution could potentially be very accurate, its high resource requirements and limitations with encrypted traffic make its use unfeasible in current high-speed networks. In addition, some applications have started to implement sophisti-cated protocol obfuscation techniques in order to camouflage their traffic, apart from using non-standard ports or ports of other well-known applications, in an attempt to evade detection or traverse firewalls.
In order to address these limitations, the research community has recently proposed several machine learning (ML) techniques for traffic classification [7– 31]. Nguyen et al. survey and compare the complete literature in the field of ML-based traffic classification in [32]. In general terms, most ML-based methods study in an offline phase the relation between a pre-defined set of traffic features (e.g., port numbers, flow sizes, interarrival times) and each application. This set of features is used to build a classifier, which is later used to identify the network traffic online.
Although there is a wide related work in the field of traffic classification, there are some important issues that still remain unsolved. As a result, most ML-based techniques had relatively limited success among network operators. For example, most popular network monitoring systems still use the port numbers or DPI techniques to classify the network traffic [33–35]. Some of these open issues include the following:
1. Most ML-based techniques only operate with packet-level traces, which requires the deployment of additional (often expensive) monitoring hard-ware, increasing the burden on network operators.
2. The impact of sampling in traffic classification still remains unknown, although traffic sampling (e.g., Sampled NetFlow) is a common practice among network operators.
3. Most ML-based techniques rely on a costly and time-consuming train-ing phase, which often involves manual inspection of a large number of connections.
4. The lack of publicly available traffic traces makes it hard to understand and compare the actual performance of existing traffic classification meth-ods.
As a result, existing traffic classification techniques are seldom used by net-work operators, which usually rely on Sampled NetFlow data for its monitoring
infrastructure. Surprisingly, the traffic classification problem with Sampled Net-Flow has been scarcely investigated by the research community.
In this paper we aim to fulfill this gap by considering the four aforementioned issues:
• We study the classification problem using NetFlow data instead of packet-level traces (open issue 1). NetFlow is a widely extended protocol devel-oped by Cisco to export IP flow information from routers and switches [36]. The main challenge when using NetFlow is the limited amount of infor-mation available to be used as features of ML classification methods. • We use the well-known C4.5 decision tree technique in order to analyze
the impact of traffic sampling on the classification accuracy with Sam-pled NetFlow (open issue 2). The main limitation in this case is the low sampling rates typically used by network operators (e.g., 1/1000) to allow routers to handle worst-case traffic scenarios and network attacks. We analyze this problem, both empirically and using sampling theory, and find that packet sampling has a severe impact on the performance of the classification method.
• We propose an automatic ML solution that does not rely on any human intervention and significantly reduces the impact of traffic sampling on the classification accuracy (open issues 2and3). The main novelty of our solution is that our training set consists of sampled instances that can better capture the properties of the sampled traffic that will be processed in the classification phase. In contrast, previous works used the same training set for both sampled and unsampled scenarios.
• We evaluate the performance of the method using a wide set of traffic traces collected in a large research and education network (4 hours) and validate the results using traces from different environments (CAIDA [37] and WITS [38]). In addition, we have published our traces [39] in order to allow the research community to evaluate their classification techniques using a common, publicly available base-truth (open issue 4).
The remainder of this paper is organized as follows. Section 2 describes the NetFlow-based methodology and our publicly available traces. Section 3 presents an experimental evaluation of the traffic classification method with Sampled NetFlow. Section 4 provides a theoretical analysis of the impact of sampling using sampling theory. Section 5 proposes a variant of the classification technique to reduce the impact of sampling. Section 6 reviews in greater detail the related work. Finally, Section 7 concludes the paper.
2. Methodology
This section describes a ML-based classification method for Sampled Net-Flow and its automatic training phase. We also present the methodology and datasets used in the evaluation.
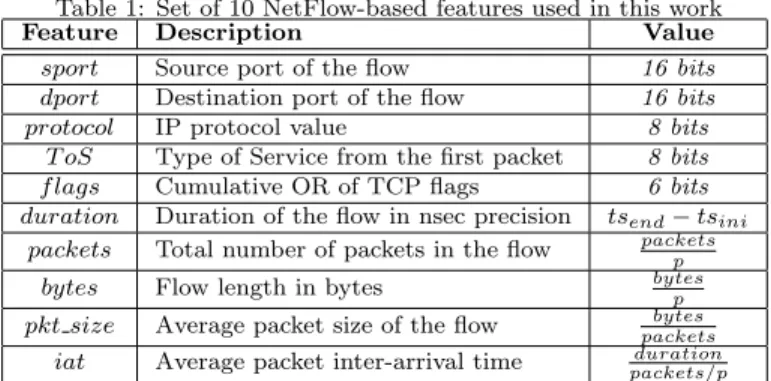
Table 1: Set of 10 NetFlow-based features used in this work
Feature Description Value
sport Source port of the flow 16 bits
dport Destination port of the flow 16 bits
protocol IP protocol value 8 bits
T oS Type of Service from the first packet 8 bits
f lags Cumulative OR of TCP flags 6 bits
duration Duration of the flow in nsec precision tsend−tsini
packets Total number of packets in the flow packetsp
bytes Flow length in bytes bytesp
pkt size Average packet size of the flow packetsbytes
iat Average packet inter-arrival time packets/pduration
2.1. Traffic Classification Method
We decided to use the C4.5 supervised ML method [40] given its high ac-curacy and low overhead compared to other ML techniques as will be further discussed in Section 6. The C4.5 algorithm builds in an offline phase a decision tree from a set of pre-classified examples (i.e., training set). The training set consists of pairs<flow, application>, where theflow is represented as a vector of features and theapplicationis a label that identifies the network application that generated the flow. In our case, the training set contains real traffic flows collected at a large university network (described in Section 2.5), and the vec-tor of features includes those features of a flow that are relevant to predict its application.
The main difference between our method and those proposed in previous works is that, when using Sampled NetFlow data, the potential number of fea-tures is significantly reduced due to the limited amount of information available in NetFlow version 5 records (i.e., the most extended version). Table 1 presents the set of features used in this work. Based on this basic information, we also compute some additional features, such as the average packet size or average inter-arrival time, resulting in 10 features in total. Unlike in some previous works (e.g., [10]), we do not use information about the IP addresses. This deci-sion can negatively impact the final accuracy of the classification method but it allows us to build a classification model less dependent on the particular network scenario used in the training phase. In addition, in the presence of sampling, we correct some features (e.g., number of packets and bytes) by multiplying their sampled values by the inverse of the sampling rate. Table 1 shows how each feature is computed according to the sampling rate (p) being applied. In Section 4, we provide a theoretical analysis of the error in the estimated features under sampling.
2.2. Training Phase and Base-truth
One of the main limitations of existing ML methods is that they require a very expensive training phase, which usually involves manual inspection of a potentially very large number of connections. In order to automatize the
training phase, we developed an automatic training tool based on filter. L7-filter [41] is an open source DPI tool that looks for characteristic patterns in the packet payloads and labels them with the corresponding application. This computationally expensive process is possible during the training phase given that it is executed offline. Finally, the training phase ends with the generation of a C4.5 decision tree as described in Section 2.1. Although the training phase must be performed using packet-level traces, only the NetFlow traffic features listed in Table 1 are considered to build the decision tree and to evaluate its performance.
The establishment of the base-truth is one of the most critical phases of any ML traffic classification method, since the entire classification process relies on the accuracy of the first labeling. Although L7-filter is probably not as accurate as the manual inspection methods used in previous works, it is automatic and does not require human intervention. This is a very important feature given that manual inspection is often not possible in an operational network. For example, each of the traces used in this paper contains more than 2 million flows (see Table 3). However, our method can also be trained using manually labeled datasets if more accurate results are needed or to avoid the limitations of DPI techniques.
In order to reduce the inaccuracy of L7-filter we use 3 rules:
• We apply the patterns in a priority order depending on the degree of over-matching of each pattern (e.g., skype patterns are in the latest positions of the rule list).
• We do not label those packets that do not agree with the rules given by pattern creators (e.g., packets detected asNTP with a size different than 48 bytes are not labeled).
• In the case of multiple matches, we label the flow with the application with more priority, based on the quality of each pattern reported in the L7-filter documentation. If the quality of the patterns is equal, the label with more occurrences is chosen.
As already proposed in previous works (e.g., [15]), we also perform a saniti-zation process in order to remove incorrect or incomplete flows that may confuse or bias the training phase. The sanitization process removes those TCP flows that are not properly formed (e.g., without TCP establishment or termination, and flows with packet loss or with out-of-order packets) from the training set. However, no sanitization process is applied to UDP traffic. Finally, because of the limitations of L7-filter already mentioned, we removed those flows labeled as
unknownfrom the training set, assuming that they have similar characteristics to other known flows. This assumption is similar to that of ML clustering meth-ods, where unlabeled instances are classified according to their proximity in the feature space to those that are known. More sophisticated labelling methods have recently appeared [35, 42], which could be also used to reduce the number ofunknownflows.
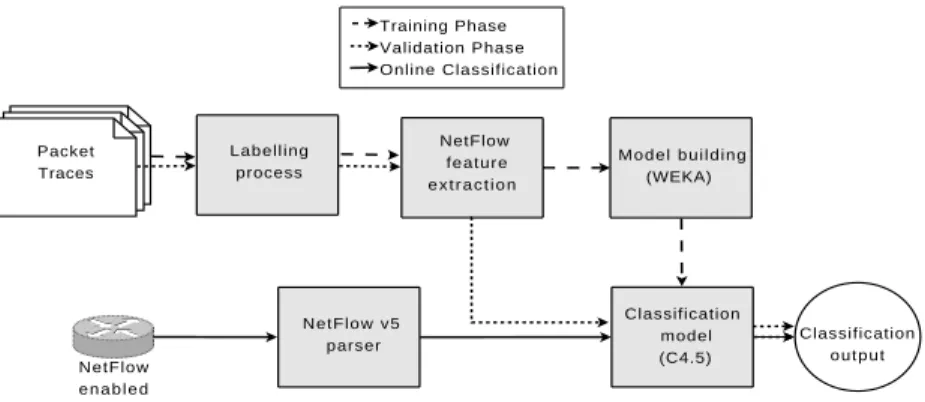
Labelling process NetFlow feature e x t r a c t i o n Model building (WEKA) Classification model (C4.5) NetFlow v5 parser Packet Traces NetFlow e n a b l e d r o u t e r Classification o u t p u t Training Phase Validation Phase Online Classification
Figure 1: Overview of the machine learning and validation process
2.3. Machine Learning and Validation Process
Figure 1 summarizes the training phase presented in Section 2.2 and the validation process used in the evaluation. First, we use a labeled dataset to train our ML method. This dataset establishes the base-truth of our system and is obtained with L7-filter as described in Section 2.2. Next, theNetFlow feature extraction module extracts, from each flow in the dataset, the set of NetFlow-based features listed in Table 1. After applying the sanitization pro-cess described in Section 2.2, we obtain the training set. This training set is then processed by theModel building module to generate the C4.5 decision tree that will be used in the validation phase (classification model). We use the WEKA ML software suite [43] to build the J48 decision tree, an open source java extension of the original C4.5.
In the validation phase, we evaluate the performance of the classification model obtained in the training phase. We included the resulting decision tree in the SMARTxAC network monitoring system [44] and processed a large set of traces described later in Section 2.5. Although these traces also contain the application label, this information is only relevant to validate the accuracy of our method. After extracting the NetFlow-based features from the evaluation traces similarly to NetFlow, we classify each flow using the C4.5 decision tree generated in the training phase. The quality of the model is measured by comparing the output of the decision tree and the label obtained with L7-filter, according to the performance metrics presented in Section 2.4.
2.4. Performance Metrics
In the evaluation, we use three representative performance metrics: overall accuracy,precision andrecall. In order to simplify the exposition of the results, we show all performance results broken down by application group, according to the groups presented in Table 2, which are based on those defined in the L7-filter documentation [41].
Table 2: Application groups used by L7-filter
Group Applications
P2P File-sharing applications based on peer-to-peer architecture (e.g.,
Bit-torrent, Edonkey)
HTTP HyperText Transfer Protocol applications (e.g, http, httpcachemiss,
httpcachehit)
VoIP Voice communications applications (e.g., Skype, TeamSpeak, Ventrilo)
Network Network applications (e.g, BGP, DHCP, Netbios, SSH, Telnet, VNC, X11)
Streaming Stream media applications (e.g., Shoutcast, PPLive, Itunes, Quick-Time)
DNS Domain Name System traffic
Others CVS, Hddtemp, IPP, LPD, Subversion, TSP...
Chat Instant messaging applications (e.g, Aim, IRC, Jabber, MSN
Messen-ger, Yahoo Messenger)
Email Email traffic (e.g, IMAP, POP3, SMTP)
FTP File transfer applications (e.g., FTP, Gopher, Tftp, UucP)
Games Massively multiplayer online games (e.g, Battlefield, Counter-Strike Source, Day of Defeat Source, WoW)
Theoverall accuracy andprecision are defined as T PT P+F P, where TP (True Positives) is the number of correctly classified flows and FP (False Positives) is the number of incorrectly classified ones. The difference between overall accuracyandprecisionis that, whileprecision refers to a particular application group,overall accuracyconsiders the classification accuracy of the complete set of flows. On the other hand, the recall of a particular application group is defined as T PT P+F N, where FN (False Negatives) stands for those flows of the application group under study that are classified as belonging to another group. Intuitively, this metric indicates how well the classification method identifies the instances of a particular application group within a trace.
A flow is defined as the 5-tuple consisting of the source and destination IP addresses, ports and protocol. In the evaluation we also present the accuracy of the classification method per packets and bytes.
2.5. Evaluation Datasets
Our evaluation dataset consists of seven full-payload traces collected at the Gigabit access link of the Universitat Polit`ecnica de Catalunya (UPC), which connects about 25 faculties and 40 departments (geographically distributed in 10 campuses) to the Internet through the Spanish Research and Education network (RedIRIS). This link provides Internet access to about 50000 users. The traces were collected at different days and hours trying to cover as much diverse traffic from different applications as possible.
Table 3 presents the details of the traces used in the evaluation. Besides, Table 4 shows the estimations of the percentage of elephant flows and the traffic they generate. As we will show later in Section 3, this parameter has a significant impact on our classification results. In order to identify elephant flows, we use the metric proposed in [45], where a flow is considered as elephant when its size
Table 3: Characteristics of the traffic traces in our dataset
Name Date Day Start Time Duration Packets Bytes Avg. Util UPC-I 11-12-08 Thu 10:00 15 min 95 M 53 G 482 Mbps UPC-II 11-12-08 Thu 12:00 15 min 114 M 63 G 573 Mbps UPC-III 12-12-08 Fri 16:00 15 min 102 M 55 G 500 Mbps UPC-IV 12-12-08 Fri 18:30 15 min 90 M 48 G 436 Mbps UPC-V 21-12-08 Sun 16:00 1 h 167 M 123 G 279 Mbps UPC-VI 22-12-08 Mon 12:30 1 h 345 M 256 G 582 Mbps UPC-VII 10-03-09 Tue 03:00 1 h 114 M 78 G 177 Mbps
Table 4: Elephant flow distribution in our dataset Name Flows Elephant Flows
% flows % bytes UPC-I 2985 K 0.035818% 52.17% UPC-II 3369 K 0.048619% 61.45% UPC-III 3474 K 0.041587% 59.58% UPC-IV 3020 K 0.048149% 59.79% UPC-V 7146 K 0.014151% 66.08% UPC-VI 9718 K 0.042271% 54.51% UPC-VII 5510 K 0.014075% 72.44%
is greater than the mean flow size observed in the trace plus three times the standard deviation.
Figure 2 plots the application breakdown according to L7-filter of the traces in our evaluation dataset. The breakdown reflects the academic nature of the monitored environment, with a large portion ofHTTP andnetwork traffic. We can also observe that L7-filter is not able to classify about 20% of the traffic (labeled asunknown). This is a common problem of the current tools available to establish the ground-truth, as already reported in previous works (e.g., [42]). In order to improve the completeness of the classification, we remove the unknown instances from the training set as discussed in Section 2.2. Therefore, those flows that L7-filter would label as unknown can be classified with our model assuming that they share similar characteristics with the flows that L7-filter can identify, as described in Section 2.2.
Among the different traces in our dataset, we selected a single trace (UPC-II) for the training phase, which is the one that contains the highest diversity in terms of instances from different applications. We limit our training set to one trace in order to leave a meaningful number of traces for the evaluation that are not used to build the classification model.
The set of seven labeled traces presented in Table 3 are publicly available in an anonymized form to the research community at [39].
Figure 2: Traffic breakdown of the traces in our evaluation dataset
3. Results
In this section, we first evaluate the performance of the traffic classification method with unsampled NetFlow. These results are then used as a reference to analyze the impact of traffic sampling on our method. In all experiments, we use the UPC-II trace in the training phase, as described in Section 2.5, and evaluate the accuracy of our method with the seven traces presented in Table 3, using the performance metrics described in Section 2.4.
3.1. Performance with Unsampled NetFlow
Table 5 presents the overall accuracy (in flows, packets and bytes) broken down by trace without applying traffic sampling. Compared to the related work [7–31], our traffic classification method obtains similar accuracy to previous packet-based machine learning techniques, despite the fact that we are only using the features provided by NetFlow.
The C4.5 decision tree obtained in the training phase classifies in average 22057 flows/second with unsampled data using a 3GHz machine with 4GB of RAM. This high classification speed is also reported in other works [27–29, 31]. While the overall flow accuracy is 90.59% in average, the classification accu-racy in packets and bytes is, as in the related work, significantly lower (69.83% and 60.32%, respectively). This is a common phenomenon with supervised learning due to the heavy-tailed nature of current Internet traffic. This results in much more instances of mice flows in the training set than of elephant flows, which hinders the identification of a small number of flows that carry a large fraction of the traffic. Table 3 confirms that, although the percentage of ele-phant flows is less than 0.1%, they represent more than 50% of the traffic in our traces. This explains the lower performance achieved in terms of packets and bytes compared to that obtained in terms of flows. However, this effect can be solved by artificially increasing the number of instances of elephant flows in the training set, as we discuss in Section 5.3.
Table 5: Overall accuracy of our traffic classification method (C4.5) and a port-based technique for the traces in our dataset
Overall accuracy
Name C4.5 Port-based
Flows Packets Bytes Flows UPC-I 89.17% 66.37% 56.53% 11.05% UPC-II 93.67% 82.04% 77.97% 11.68% UPC-III 90.77% 67.78% 61.80% 9.18% UPC-IV 91.12% 72.58% 63.69% 9.84% UPC-V 89.72% 70.21% 61.21% 6.49% UPC-VI 88.89% 68.48% 60.08% 16.98% UPC-VII 90.75% 61.37% 40.93% 3.55%
Figure 3: Precision (mean with 95% CI) by application group (per flow) of our traffic classi-fication method (C4.5) with different sampling rates
Table 5 shows that the overall accuracy is similar for all traces. As expected, results for the UPC-II trace are slightly better than for the rest, given that this trace was the one used in the training phase. However, the accuracy per byte with the UPC-VII trace is significantly lower than with the other traces, since this trace was collected at night, when the aggregated traffic mix was more different than that of the training set (e.g., backup and file transfer applications). An example of this different traffic profile can be observed in Table 3, which shows that the percentage of elephant flows for those traces collected during weekends (UPC-V) or at night (UPC-VII) is significantly lower (about 0.01%) but, in contrast, they carry a much larger fraction of the traffic (between 60-70%).
Table 5 also compares the overall accuracy of our method to a simple tech-nique based on the destination port numbers [1]. As expected, even when using only NetFlow-compatible features, the accuracy of supervised learning methods is significantly higher than that of port-based techniques. It is also important to note that, while in previous works the accuracy of port-based techniques was in the 50-70% range [10], the accuracy of this method in our traces is only around 10%, which shows the important differences between the traces used in different
Figure 4: Recall (mean with 95% CI) by application group (per flow) of our traffic classification method (C4.5) with different sampling rates
studies.
Figure 3 presents the precision by application group. When sampling is not applied (p= 1), the precision is around 90% for most application groups. Fig-ure 4 also shows similar results for the recall by application group. Nevertheless, the performance for some applications (e.g., Streaming, Chat and Others) is sig-nificantly lower because L7-filter detected very few flows of these applications in the training set (see Figure 2, UPC-II trace). As a result, this inaccuracy has a very limited impact on the overall performance of our method. In order to improve the classification accuracy for these groups, we could always include more instances of these applications in the training set, as we further discuss in Section 5.3.
3.2. Performance with Sampled NetFlow
So far, we have showed that our traffic classification method can achieve similar accuracy than previous packet-based machine learning techniques, but using only NetFlow data. Next, we study the impact of packet sampling on our classification method using Sampled NetFlow.
Figure 5(a) shows that the flow classification accuracy degrades drastically with sampling, decreasing from 90.59%, when all packets are analyzed, until 51.02%, when only one packet out of 1.000 is selected. The accuracy decreases much faster for high sampling rates and stabilizes (and even slightly increases) afterp= 10%. This effect is inherent to packet sampling, since mice flows tend to rapidly disappear with packet sampling, while the percentage of elephant flows remains fairly stable at low sampling rates. For example, we checked that the percentage of elephant flows in our traces increases by two orders of magnitude (from around 0.05% to 5%) at low sampling rates. Recall that NetFlow only supports static packet sampling and network operators tend to set the sampling rate to very low values in order to allow routers to sustain worst-case traffic mixes and network attacks.
The accuracy of the port-based technique remains almost constant in the presence of sampling (about 10-30%). The accuracy per flow somewhat increases
(a) Accuracy by flows
(b) Accuracy by packets
(c) Accuracy by bytes
Figure 5: Overall accuracy (mean with 95% CI) of our traffic classification method (C4.5) and a port-based technique as a function of the sampling rate
with the sampling rate, which indicates that large flows are easier to identify using the port numbers than small flows. In contrast, the accuracy per packet and byte tends to slightly decay compared to that per flow because, while the percentage of flows stabilizes at low sampling rates, the percentage of packets and bytes decreases in the same proportion as the sampling rate.
Figures 5(b) and 5(c) also show that our method is more resilient to sampling for large flows than for small ones, since the accuracy per packet and byte degrades more slowly with the sampling rate than per flow. On the one hand, this is because missing a single packet of a small flow always has a larger impact in the estimation of the flow features than in larger flows. On the other hand, as previously discussed, while our method classifies small flows better than larger ones, small flows tend to rapidly disappear in the presence of sampling.
Figure 3 presents the flow precision by application group at different sam-pling rates. The precision for most applications, except for those with very few
instances in the training set (e.g., Streaming, Chat and Others), decreases with the same proportion depicted in Figure 5. Figure 4 also shows similar results for the recall by application group.
Both figures when interpreted together give us important information about the quality of our classification method. For example, it can be observed that the precision and recall for HTTP is around 70% and 35% (with p = 0.01) respectively, which indicates that while 70% of the flows classified as HTTP are actually HTTP traffic, more than 65% of the HTTP flows in the dataset are incorrectly classified as belonging to another application. On the contrary, while the precision for FTP applications is relatively low in the presence of sampling (<50%), the recall is very high (>90%), which means that more than 90% of the FTP flows in the dataset are correctly classified. However, more than 50% of flows identified as FTP belong to other applications.
According to the results presented in this section, we can conclude that the impact of traffic sampling on supervised learning solutions for traffic classifica-tion is severe. We consider that an average accuracy of about 50% for sampling rates below 10% is unacceptable to most network operators. Suprisingly, to the best of our knowledge, this is the first work that shows such a drastic impact of sampling in the field of traffic classification. The only previous work that stud-ied the traffic classification problem in the presence of sampling [10] reported instead a minimal decrease of accuracy. We attribute the different results to the more complete datasets used in this study (4 hours of a gigabit link), which are harder to classify using only the port numbers. As we later discuss in Section 4, the port numbers are resilient to sampling, which explains the differences in the results. As in this section, a complete, unsampled dataset was employed to train the system in [10]. In contrast, Section 5 shows that by simply using a sampled training set to build the classification model, the accuracy and recall figures can be significantly improved.
4. Analysis of the Sources of Inaccuracy under Sampling
In Section 3.2, we have shown the large impact of packet sampling on the accuracy of a supervised learning technique for traffic classification. However, packet sampling can affect the classification accuracy in many different ways. In particular, we have detected three different sources of error when using packet sampling in NetFlow: (i) error in the estimation of the flow features, (ii) changes in the flow size distribution, and (iii) splitting of sparse flows. In this section, we analyze these sources of inaccuracy both theoretically and empirically.
4.1. Error in the Traffic Features
One of the main sources of inaccuracy under sampling is the estimation of the traffic features. Most of the per-flow features provided by Sampled NetFlow cannot be directly used by the classifier. Instead, they must be inverted prior to the classification process in order to be comparable to the values observed in the training set. We present a theoretical analysis, using sampling theory, of
the error in the estimation of the features presented in Table 1. We show that, although most of the features are fairly accurate for large flows and moderate sampling rates, some features are clearly biased. For those features that are unbiased, we find that the variance of the error is significant for small flows and low sampling rates. We also present experimental evidence that indicates that this source of error contributes most to the results presented in Section 3.2.
• Source port, destination port and protocol. These are the only features in Table 1 that are not affected by packet sampling, because they have exactly the same value in all the packets of a flow. Thus, their inversion has no impact in the classification accuracy. If one or more packets of the flow are sampled, then the error is 0, while if the flow is not sampled at all it does not contribute to the error. The probability of missing a flow withnpackets is (1−p)n, wherepis the sampling rate.
• Flags and ToS.Under random sampling, the probability pof sampling a packet is independent from the other packets. Let m be the number of packets of a particular flow with the flag f set (i.e., f = 1), where
f ∈ {0,1}. The probability of incorrectly estimating the value off under sampling is (1−p)m, independently of how the packets with the flag set are distributed over the flow. The expected value of the absolute error is: E[f−fˆ] =f−E[ ˆf] =f−(1−(1−p)m) =f −1 + (1−p)m (1) Eq. 1 shows that ˆf is biased, since the expectation of the error is (1−p)m
whenf = 1, and it is only 0 whenf = 0. That is, with packet sampling, ˆ
f tends to underestimatef, especially whenf = 1 andmorpare small. For example, if we have a flow with 100 packets with the flag ACK set (m = 100) and p = 1%, the expectation of the error in the flag ACK is (1−0.01)100 ≈0.37. The flag SYN and the ToS are particular cases, where we are only interested in the first packet and, therefore,m∈ {0,1}. • Number of packets. With sampling probabilityp, the number of sam-pled packets x from a flow of n packets follows a binomial distribution
x∼B(n, p). Thus, the expected value of the estimated feature ˆn=x/p
is: E[ˆn] = E [ x p ] =1 pE[x] = 1 pnp=n (2)
which shows that ˆnis an unbiased estimator ofn(i.e., the expected value of the error is 0). The variance of ˆnis:
Var[ˆn] = Var [ x p ] = 1 p2Var[x] = 1 p2np(1−p) = 1 pn(1−p) (3)
Hence, the variance of the relative error can be expressed as:
Var [ 1−nˆ n ] = Var [ ˆ n n ] = 1 n2Var[ˆn] = 1 n2pn(1−p) = 1−p np (4)
Eq. 4 indicates that, for a given p, the variance of the error decreases with n. That is, the variance of the error for elephant flows is smaller than for mice flows. The variance also increases when p is small. For example, withp= 1%, the variance of the error of a flow with 100 packets is 1001−×0.001.01= 0.99, which is not negligible.
• Flow size. The original sizeb of a flow is defined asb=∑ni=1bi, where n is the total number of packets of the flow and bi is the size of each
individual packet. Under random sampling, we can estimate b from a subset of sampled packets by renormalizing their size:
ˆb= n ∑ i=1 wi bi p (5)
wherewi∈ {0,1} are Bernoulli distributed random variables with proba-bilityp. We can show that ˆbis an unbiased estimator ofb, since E[ˆb] =b:
E[ˆb] = E [ n ∑ i=1 wibi p ] = 1 pE [ n ∑ i=1 wibi ] = 1 p n ∑ i=1 E[wibi] = = 1 p n ∑ i=1 biE[wi] = 1 p n ∑ i=1 bip=1 pp n ∑ i=1 bi=b (6)
The variance of ˆb is obtained as follows:
Var[ˆb] = Var [ n ∑ i=1 wi bi p ] = 1 p2Var [ n ∑ i=1 wibi ] = 1 p2 n ∑ i=1 Var[wibi] = = 1 p2 n ∑ i=1 b2iVar[wi] = 1 p2 n ∑ i=1 b2ip(1−p) =1−p p n ∑ i=1 bi2 (7)
Thus, the variance of the relative error is:
Var [ 1− ˆb b ] = Var [ˆ b b ] = 1 b2Var[ˆb] = 1 b2 1−p p n ∑ i=1 bi2= = 1−p p ∑n i=1bi 2 ( ∑n i=1bi )2 (8)
which decreases withn, since∑ni bi2≤(∑n i bi
)2
. This indicates that the variance of the error can be significant for small sampling rates and short flows. For example, if we have a flow with 100 packets of 1500 bytes each, the variance of the error withp= 1% is 1−0.001.01×(100100××15001500)22 = 0.99.
• Duration and interarrival time. The flow duration is defined as d=
tn−t1, wheret1andtnare the timestamps of the first and last packets of the original flow. Under sampling, this duration is estimated as ˆd=tb−ta, where ta andtb are the timestamps of the first and last sampled packets respectively. Thus, the expected value of ˆdis:
E[ ˆd] = E[tb−ta] = E[tb]−E[ta] = E [ tn− n ∑ i=b iati ] −E [ t1+ a ∑ i=1 iati ] = (tn−t1)− ( E [ n ∑ i=b iati ] + E [ a ∑ i=1 iati ]) (9)
where iati is the interarrival time between packets i and i−1, anda is a random variable that denotes the number of missed packets until the first packet of the flow is sampled (i.e., the number of packets betweent1 and ta). Therefore, the variable a follows a geometric distribution with
probability p, whose expectation is 1/p. By symmetry, we can consider the number of packets between b and n to follow the same geometric distribution. In this case, we can rewrite Eq. 9 as follows:
E[ ˆd] = (tn−t1)−((E[n−b] E[iat]) + (E[a] E[iat])) = (tn−t1)−2 ( iat p ) (10)
where iat is the average interarrival time of the non-sampled packets. Eq. 10 shows that the estimated duration is biased (i.e., E[d−dˆ] > 0). In other words, ˆdalways underestimatesd. The bias is (2×iat/p), if we consider the average interarrival time to be equal between packets 1. . . a
and b . . . n. However, we cannot use the feature iatc to correct this bias, because this feature is obtained directly from ˆd. In fact, Eq. 10 indicates that the featureiatc is also biased, sinceiatc = ˆd/nˆ.
In order to illustrate with empirical data the impact of packet sampling on the estimated features, we present in Table 6 the average of the relative error per flow of the features in the UPC-II trace as a function of the sampling rate. We can observe that the error for almost all the features is significant, and it is particularly large for ˆnand ˆb. These large errors are explained by the fact that the average number of packets per flow in the UPC-II trace is only 6.67, given that in NetFlow flows are unidirectional and the trace contains a large portion of DNS traffic (i.e., single-packet flows). According to Eq. 4, the variance of the error for small flows is very large. For example, withp= 0.01 andn= 1, the variance of the error in the number of packets is 1−0.001.01 = 99. The same observation holds for the flow size.
Table 6: Average of the relative error of the flow features as a function ofp(UPC-II trace) Feature p = 0.5 p = 0.1 p = 0.05 p = 0.01 p = 0.005 p = 0.001 sport 0.00 0.00 0.00 0.00 0.00 0.00 dport 0.00 0.00 0.00 0.00 0.00 0.00 proto 0.00 0.00 0.00 0.00 0.00 0.00 ˆ f 0.05 0.16 0.18 0.22 0.23 0.24 ˆ d 0.22 0.60 0.66 0.77 0.79 0.81 ˆ n 0.66 3.66 6.90 29.69 55.17 234.61 ˆb 0.76 3.86 7.05 29.71 55.09 234.24 c iat 0.29 0.65 0.71 0.78 0.80 0.82 o o o o o o o 1 0.5 0.1 0.05 0.01 0.005 0.001 0.0 0.2 0.4 0.6 0.8 1 + + + + + + + o + Estimated Features Real Features Sampling rate(p) Ov er all accur acy
Figure 6: Overall accuracy when removing the error introduced by the inversion of the features (UPC-I trace, using UPC-II for training)
Given this large error, one would expect the error in the flow features to be the main source of inaccuracy in the classification results presented in Sec-tion 3.2. In order to confirm this intuiSec-tion, we performed an experiment to quantify the error introduced by the inverted features in the final classifica-tion accuracy. We replaced the estimated features of each flow in the UPC-I trace by their original values, which were directly obtained from the unsampled trace. Note that this cannot be done in the general case, because under sam-pling the original features are unknown. Figure 6 shows the accuracy obtained with the UPC-I trace using the UPC-II trace for training. In particular, the figure presents the classification accuracy removing the error introduced by the inversion of the features. The results of this experiment confirm that this source of error explains the bulk of the classification error, especially for low sampling rates (fromp= 0.1 to 0.001). The following subsections analyze other sources of error that explain the rest of the error observed under sampling.
4.2. Changes in the Flow Size Distribution
A second source of inaccuracy is the impact of sampling on the flow size distribution. When using Sampled NetFlow, short flows in terms of packets
0 10 20 30 40 50 60 70 80 90 100 0 0.05 0.1 0.15 0.2 0.25 0.3 0.35
Flow Length (packets)
Probability
Analytical PMF Empirical PMF
Figure 7: Validation of Eq. 11 against the empirical distribution of theoriginal flow length detected withp= 0.1 (UPC-II trace).
(i.e., mice) can be easily missed by the sampling process, while long flows (i.e., elephants) are usually sampled, even when using very low sampling rates. As a result, the distribution of elephant and mice flows in a sampled trace is different from that of an unsampled (complete) trace. As we will see, this impacts the classification accuracy of sampled traffic when an unsampled trace is used for training. Next, we present a theoretical analysis that shows that this distribu-tion changes significantly, even when using high sampling rates.
Let Xp be a discrete random variable that denotes the original size of the
sampled flows when using a sampling rate ofp. Please note that Xp represents
theoriginal number of packets of the sampled flows, not the amount of sam-pled packets. Let Y be a discrete random variable that denotes the original flow length distribution, with probability mass functionP[Y =y]. Then, the probability mass function ofXp can be expressed as:
P[Xp=x] = ∑x i=1Bp(i, x)P[Y =x] ∑∞ j=1 ∑j k=1Bp(k, j)P[X =j] (11)
where Bp(k, n) is the binomial probability, defined as Bp(k, n) = (nk)pk(1−
p)(n−k).
Figure 7 validates our model (Eq. 11) against the empirical flow length dis-tribution of the detected flows withp= 0.1 in the UPC-II trace. In this case, we used the probability mass functionP[Y =y] obtained empirically from the UPC-II trace (without sampling). The figure confirms that the model fits very well the empirical distribution under sampling.
Figure 7 also confirms our hypothesis for our trace. In order to have a more general result we approximate the original flow length with a Pareto
distribu-0 10 20 30 40 50 60 70 80 90 100 0 0.05 0.1 0.15 0.2 0.25 0.3 0.35
Flow Length (packets)
Probability
p = 1 p = 0.1 p = 0.01 p = 0.001
Figure 8: Flow length distribution of the detected flows when using several sampling proba-bilities. The figure was obtained combining Eq. 11 with Eq. 12
tion [46]. Thus, we can express the probability mass function ofY as:
P[Y =y] = αL
αx−α−1
1−HLα (12)
Figure 8 plots the flow length distribution of the detected flows for different sampling probabilities. The figure was obtained by combining Eq. 11 with Eq. 12. The parameters of the Pareto distribution were approximated using the empirical probability mass function ofY (α= 3.7003, β = 0.3650, L= 1 and
H= 1000).
The figure shows that the distribution of detected mice and elephant flows changes significantly, even with very high sampling probabilities. For high sam-pling rates (e.g., p= 0.1), the amount of mice flows is remarkably larger than that for low sampling rates (e.g.,p = 0.001). However, the probability of de-tecting elephant flows remains highly unaffected with respect to the sampling probability. This result confirms that the flow length distribution of the traffic sampled during the classification phase is significantly different from that of the (unsampled) training set. The use of such imbalanced datasets is known to be an important source of inaccuracy of supervised learning methods [47].
Recall the previous experiment presented in Figure 6, where we analyzed the impact of the inversion of the traffic features. Whenp= 1, the traffic clas-sification method achieves an overall accuracy above 0.9, while under sampling (even when the features are perfectly accurate), the accuracy drops below 0.8. This decrease in accuracy can be mostly attributed to the different distribution of the flows observed in the classification and training phases.
4.3. Flow Splitting
The last source of inaccuracy that we observed under sampling is flow split-ting. NetFlow implements several flow expiration mechanisms [48]. One of them
is theinactivity timeout, which expires the flows after a certain amount of time of inactivity (TTL seconds). That is, if no packet is received for a given flow during TTL seconds, NetFlow expires the flow and reports it. Under certain circumstances, the packet inter-arrival time of an active flow may be larger than the TTL, and this would result in several instances of the same flow reported, instead of just one. Packet sampling aggravates this problem, since a set of consecutive packets may be missed (not sampled), which may cause NetFlow to incorrectly expire the flow while it is still active.
In this case, the flow is split and reported twice (or more times) to the traffic classification method. This situation affects the classification accuracy, since the features of split flows only reflect partial information of the actual flow (e.g., estimated size and duration of split flows is shorter).
In this section, we aim to model the flow splitting probability under sampling and discuss its impact on the traffic classification method. First, we focus on an analytical model for the probability of splitting a flow, either in one or more parts, as a function of the sampling rate p. For this purpose, we consider the average inter-arrival time of the packets within a flow (iat), the inactivity timeout of NetFlow (TTL) and its length in packets (n).
We base our model in the well-knownconsecutive-k-out-of-n:F [49] theory, which accounts for the reliability of a system composed of an ordered sequence of
ncomponents, such that the system fails if, and only if, at leastkconsecutive components fail. In our case, the components are the packets of a flow, and the flow is split if at leastk consecutive packets are not sampled, wherek = ⌈T T L/iat⌉.
From the consecutive-k-out-of-n:F theory, we know that the probability P
of having at least one run ofk missed packets out ofn can be expressed with the following recursive formula:
P(n, q, k) =P(n−1, q, k) +qk(1−q)(1−P(n−k−1, q, k)) (13) with the following base cases:
• ifn < kthenP = 0 • ifn=kthenP =qk
whereqis the probability of missing a packet (q= 1−p). Since a flow cannot be split unless at least 2 packets have been sampled, we can express the split probabilityPsplit(n, p) as:
Psplit(n, p) =P(n,1−p,⌈T T L/iat⌉)[1−(Bp(0, n) +Bp(1, n))] (14)
whereBp(k, n) is again the binomial probability, defined asBp(k, n) =(nk)pk(1− p)(n−k).
In order to validate our model, we plot in Figure 9 the actual number of split flows in the UPC-II trace as a function of the sampling ratep, along with the values obtained with our model using Eq. 14. The figure confirms that our
0.5 0.1 0.05 0.01 0.005 0.001 0 2000 4000 6000 8000 10000 12000 14000 16000 18000 Sampling Rate (p) Number of splits Empirical Analytical
Figure 9: Amount of split flows as a function of the sampling probabilityp. The figure shows both the empirical results (UPC-II trace) and the analytical ones (Eq. 14)
model predicts remarkably well the number of split flows for all the sampling rates. It is also interesting to observe that the amount of split flows is not directly proportional to the sampling rate and shows a peak atp= 0.1.
In order to understand this relationship, we must introduce the notion of
sparse flow [50]. According to our results, split flows typically have very long durations (in the order of hundreds of seconds), but contain very few packets (an average of 16 in our traces). Suchsparse flows are more prone to be split [50]. However, the probability of capturing more than one packet of a sparse flow is very small for low sampling rates, which explains the decrease of split flows in Figure 14 for sampling rates below 0.1.
Although this source of error decreases the classification accuracy of those flows that have suffered a split (e.g., the accuracy of split flows is 8% below the average for the UPC-II trace withp= 0.5), its impact in the overall classifica-tion accuracy in our datasets was low. This is explained by the fact that the percentage of split flows in our traces is small (about 1% withp= 0.5), since they contain very few sparse flows. However, flow splitting can be an important source of inaccuracy in other traffic profiles with a larger portion of sparse flows.
5. Dealing with Sampled NetFlow
Given the severe impact of packet sampling on the classification accuracy observed in previous sections, this section presents a simple improvement in the training process that significantly increases the performance of our traffic clas-sification method in the presence of sampling (e.g., Sampled NetFlow). Finally, we also review some of the limitations detected during the evaluation of our method, which are common to most machine learning-based techniques.
5.1. Improving the Classification Method
Unlike in previous works, where a set of complete (unsampled) flows are used in the training phase (e.g., [10]), we propose instead to apply packet sampling to
Figure 10: Overall accuracy (mean with 95% CI) of our traffic classification method with a normal and sampled training set
Figure 11: Precision (mean with 95% CI) by application group (per flow) of our traffic clas-sification method with a sampled training set
the training process. This simple solution is possible because Sampled NetFlow uses a static sampling rate [36], which must be set at configuration time by the network operator. Therefore, we can use exactly the same sampling rate in both the training and classification processes. This solution has the advantage of circumventing the sources of inaccuracy discussed in Section 4, since in this case the features do not need to be inverted, while the same flow distribution and split probability is maintained in both the training and classification sets.
In particular, we repeat the training process described in Section 2 by apply-ing a set of samplapply-ing rates commonly used by network operators, which range from 50% to 0.1%, and then evaluate the accuracy of the classification process under these static sampling rates.
Figure 10 shows the substantial improvement obtained in terms of classified flows when applying sampling to the training set. Remarkably, we can observe that the flow accuracy degrades much more gracefully compared to the original technique. For example, withp = 0.01, the accuracy per flow increases from
Figure 12: Recall (mean with 95% CI) by application group (per flow) of our traffic classifi-cation method with a sampled training set
46.96% to 82.38%. Similar improvements are obtained for the other sampling rates. According to the theoretical analysis presented to Section 4, this increase of accuracy can be mostly attributed to the error introduced by the inversion of the traffic features when using an unsampled training set. The enhancement is also partially explained by the already mentioned elephant-mice phenomenon, since now the proportion of elephant and mice flows is kept similar in the training and classification phases. Although the results in terms of packets and bytes are more modest, especially forp= 0.01, the improvement is still considerable. This lower gain is expected since the accuracy in terms of packets and bytes under aggressive sampling rates is mainly driven by large flows, which are less affected by our enhancement in the training phase.
The precision (Figure 11) and recall (Figure 12) are also significantly higher for all application groups and sampling rates. Note also that, while our initial classification method was not able to identify almost any flow of some appli-cation groups (e.g., Games, Chat or Others) in the presence of sampling (see Figures 3 and 4), with the proposed improvement in the training process the precision and recall of these applications are notably improved (e.g., precision from 2.78% to 83.97% for Games applications withp= 0.01).
5.2. Evaluation in Other Network Environments
In previous sections, we showed the performance of our traffic classification method using different traces from a single network viewpoint (UPC). The ob-jective of this section is to evaluate if similar results are also obtained in other network environments.
For this purpose, we used 5 packet-level traces from two public repositories (CAIDA [37] and WITS [38]). The traces from the CAIDA archive were collected in two OC-192 backbone links from a Tier-1 ISP in the US. Conversely, the Auckland-VIII trace from the WITS repository was collected in a 100 Mbps access link of the University of Auckland to the global Internet. Details of the traces are presented in Table 7.
Table 7: Characteristics of the traces from other environments
Name Date Day Start Time Duration Packets Bytes Avg. Util CAIDA Chicago 08 18-12-08 Thu 14:00 1 h 3.53 G 2.7 T 6.1 Gbps CAIDA Chicago 09 16-07-09 Thu 15:00 1 h 4.28 G 4.2 T 9.3 Gbps CAIDA SanJose 08 21-08-08 Thu 15:00 1 h 2.32 G 1.3 T 2.9 Gbps CAIDA SanJose 09 17-09-09 Thu 15:00 1 h 3.67 G 2.4 T 5.4 Gbps Auckland-VIII 10-12-03 Wed 15:00 4 h 35 M 16 G 9.2 Mbps
A common problem when using public traces is that packet payloads are usually not available for privacy reasons. However, packet payloads are needed to build the ground truth used to measure the classification accuracy. In order to address this limitation, we labeled the traces in Table 7 using our own classifier, which we trained using the UPC-II trace as described in Section 2.5. Although this approach assumes that the accuracy is 1 when p = 1, it is sufficient to analyze the decrease of accuracy due to packet sampling.
Figure 13 presents the overall accuracy, in terms of classified flows, when us-ing a normal (unsampled) and a sampled trainus-ing set with the traces in Table 7. The figure shows that similar improvements to those observed in Figure 10 with the traces from UPC are also obtained with the traces from other network sce-narios. In general, the accuracy when using a complete training set decreases abruptly for moderate sampling rates and starts to recover slowly for low sam-pling rates. This effect, which was already observed with the traces from UPC in Figure 5, is explained by the fact that, as discussed in Section 4, the error in the inversion of the flow features is much smaller for elephants flows, which are the most predominant with low sampling rates (e.g., 1/1000). In contrast, the accuracy when using the improvement presented in Section 5.1 is more stable and is kept reasonably high for all sampling rates.
5.3. Lessons Learned and Limitations
In the course of this study, we have found that several limitations of most machine learning techniques for traffic classification are directly related to the base-truth used in the training phase. This explains the accuracy problems observed in Sections 3 and 5 for some application groups and metrics. As a result of such experience, we present some simple solutions that could help to improve the quality of the training set in future works: (i) include a similar number of instances of all application groups, (ii) increase the number of instances of elephant flows, for example by using longer traces that can better capture the behavior of large flows, which have a high probability of being ignored in small traces due to the sanitization process, (iii) mix several instances of multiple traces from different hours, days and network scenarios in the training set, (iv) define alternative groups than those used by L7-filter, according to the actual behavior of the applications, and avoid generic groups (e.g., Others), and (v) investigate better, but still automatic, labeling techniques for the training phase
o o o o o o 0.5 0.1 0.05 0.01 0.005 0.001 0.0 0.2 0.4 0.6 0.8 1 + + + + + + o + Normal CAIDA_Chicago_08 Sampled CAIDA_Chicago_08 Sampling rate(p) Ov er all accur acy o o o o o o 0.5 0.1 0.05 0.01 0.005 0.001 0.0 0.2 0.4 0.6 0.8 1 + + + + + + o + Normal CAIDA_Chicago_09 Sampled CAIDA_Chicago_09 Sampling rate(p) Ov er all accur acy o o o o o o 0.5 0.1 0.05 0.01 0.005 0.001 0.0 0.2 0.4 0.6 0.8 1 + + + + + + o + Normal CAIDA_Sanjose_08 Sampled CAIDA_Sanjose_08 Sampling rate(p) Ov er all accur acy o o o o o o 0.5 0.1 0.05 0.01 0.005 0.001 0.0 0.2 0.4 0.6 0.8 1 + + + + + + o + Normal CAIDA_Sanjose_09 Sampled CAIDA_Sanjose_09 Sampling rate(p) Ov er all accur acy o o o o o o 0.5 0.1 0.05 0.01 0.005 0.001 0.0 0.2 0.4 0.6 0.8 1 + + + + + + o + Normal Auckland−VIII Sampled Auckland−VIII Sampling rate(p) Ov er all accur acy
Figure 13: Overall accuracy with a normal and sampled training set using the traces from other environments
(e.g., [35, 42]).1
6. Related Work
Recently, several machine learning (ML) methods have been proposed as an effective alternative to the classic traffic classification techniques based on the port numbers [1] or deep packet inspection (DPI) [3–6]. The wide related work in this field can be divided into two main areas, namely supervised and
1Note that the accuracy of supervised learning methods is directly restricted by the label-ing technique used in the trainlabel-ing phase. For example, if DPI techniques are used for trainlabel-ing, it is improbable that the resulting classification method can identify encrypted traffic, unless it exhibits similar behavior than the unencrypted traffic of the same application.
unsupervised learning. Next, we briefly review the main proposals and ideas behind these two research areas. We refer the interested reader to [32] for an exhaustive survey of the complete literature in the field of ML for traffic classification.
Supervised methods, also known as classification methods, extract, in an offline phase, knowledge structures (e.g., decision trees) from a pre-classified set of examples (i.e., labeled flows), which are later used to classify new in-stances into a pre-defined set of classes (i.e., applications). Several works have proposed the use of supervised techniques for traffic classification [7–14], which reported a classification accuracy around 90%. However, proposed techniques only operate with packet-level traces, which significantly limits their deploy-ment in operational networks. In addition, they rely on an expensive training phase that usually involves manual classification of a large number of example flows. In this paper, we have adapted the well-known C4.5 supervised learning technique [40] to operate with NetFlow data and have presented an automatic training process that does not require manual inspection.
Unsupervised learning methods, also known as clustering methods, do not need a complete labeled dataset. Instead, they automatically discover the nat-ural clusters from previously unclassified data. Several clustering methods for traffic classification have been also studied in the recent literature [15–25]. In general, they achieved a slightly lower accuracy than supervised techniques, but with a much more lightweight training phase. In this work, we try to com-bine the high classification accuracy of supervised learning with an automatic training phase, similar to that of unsupervised methods.
Although these previous works have reported different performance results, it is difficult to draw sound conclusions about their relative performance, since most studies were carried out using different, undisclosed datasets. As a result, entire papers have been devoted to analyze and compare the performance of some of these techniques [26–31]. In 2006, Williams et al. [27] compared five supervised algorithms for traffic classification. They concluded that C4.5 was the most accurate among the evaluated algorithms. C4.5 also outperformed the rest in terms of classification time, being twice as fast as the second fastest technique (Na¨ıve Bayes [11]). At the end of 2008, Kim et al. [31] analyzed seven supervised methods, and compared them with BLINC [51] and the port-based method implemented by CoralReef [33]. BLINC [51] is a classification technique that analyzes the connection profile of end hosts based on their interaction with the network. According to their results, all supervised techniques achieved much better accuracy than BLINC and CoralReef. Among the supervised methods, Support Vector Machines (SVM) slightly outperformed the rest in terms of accuracy. C4.5 achieved almost the same accuracy, but with a classification time hundred times faster than SVM. For this reason, in this work we decided to use C4.5, which is the technique that, based on these previous results, offers the best trade-off between classification accuracy and overhead.
To the best of our knowledge, only a workshop paper [10] has analyzed the traffic classification problem in the presence of sampling. In particular, [10] evaluated the impact of packet sampling on the Na¨ıve Bayes Kernel Estimation
supervised machine learning technique. In this work, we analyze instead the impact of sampling on the C4.5 classification method, which is faster in terms of both training and classification time. Despite the similarities between both techniques, we have observed a significantly higher impact of sampling in the classification accuracy. While in [10] a complete, unsampled trace is used in the training phase, in this work we show that this approach has a severe impact on the classification accuracy in the presence of sampling. Since the trace used in [10] is not publicly available to further analyze these differences, we attribute them to the more complete datasets used in our study, which are more difficult to classify using only the port numbers (note that port numbers are resilient to sampling) and include a much larger volume of traffic and both TCP and UDP connections. In contrast, [10] only used a single trace that did not contain UDP traffic. In order to allow for further comparison of our results with other classification techniques, we have made our datasets publicly available to the research community. They can be obtained at [39].
The impact of sampling has also been studied in other, closely related re-search areas. In the field of anomaly detection, several works have analyzed the impact of different sampling techniques on the performance of portscan detec-tion [52–54]. They also conclude that packet sampling has an important impact on the detection accuracy, increasing both false negative and false positive ra-tios. Although some studies reported lower impacts when using flow sampling (e.g., [52, 53]), Sampled NetFlow only supports packet sampling (systematic and random) [48]. Androulidakis et al. [55] show that systematic sampling is especially problematic when the detection algorithms depend on the observation of a particular packet (e.g., SYN flag). Brauckhoff et al. [56] also find that some anomaly detection metrics are more resilient to sampling than others, especially those based on entropy summarizations, and that detection algorithms based on packet and byte counts are less affected than those based on flow counts.
Finally, in the field of bandwidth estimation, Davy et al. [57] explored the problem of estimating the bandwidth demand from sampled network accounting data for QoS-aware network planning. Their results show estimation errors in the ±10% range. They also find that the estimation error depends on the particular class of traffic and that it is larger for short flows at low sampling rates.
7. Conclusions
In this paper, we addressed the traffic classification problem with NetFlow data using a well-known supervised learning technique. Our results allow us to come to the conclusion that: (i) supervised methods (e.g., C4.5) can achieve high accuracy (≈90%) with unsampled NetFlow data, despite the limited information provided by NetFlow, as compared to the packet-level data used in previous studies, and (ii) the impact of packet sampling on the classification accuracy of supervised learning methods is severe.
Therefore, we proposed a simple improvement in the training process that significantly increased the accuracy of our classification method under packet
sampling. For example, for a sampling rate of 1/100, we achieved an overall accuracy of 85% in terms of classified flows, while before we could not reach an accuracy beyond 50%.
Given that Sampled NetFlow is the most widely extended monitoring solu-tion among network operators, we hope that these encouraging results can in-centivize the deployment of more accurate techniques in operational networks, where the obsolete port-based method is often the unique real solution.
In the paper, we also identified several limitations, common to most machine learning techniques, which constitute an important part of our future work. Nevertheless, the main limitation in this research area is the lack of publicly available traces to be used as a common reference for researchers working on this topic. In this direction, an additional contribution of this paper is that we have opened our traffic traces to the research community. These traces were collected at a large university network and cover a wide range of days and hours.
Acknowledgments
The authors thank UPCnet for the traffic traces provided for this study and Maurizio Molina from DANTE for useful comments and suggestions on this work. This research has been conducted under the framework of the COST Action IC0703“Data Traffic Monitoring and Analysis (TMA)”, and it has been partially funded by theComissionat per a Universitats i Recerca del DIUE de la Generalitat de Catalunya (ref. 2009SGR-1140). Support for CAIDA’s Internet Traces is provided by the National Science Foundation, the US Department of Homeland Security, and CAIDA Members.
References
[1] Internet Assigned Numbers Authority (IANA),
http://www.iana.org/assignments/port-numbers, as of August 12, 2008.
[2] T. Karagiannis, A. Broido, N. Brownlee, K. Claffy, M. Faloutsos, File-sharing in the Internet: a characterization of P2P traffic in the backbone, Univ. of California, Riverside, Tech. Rep.
[3] T. Karagiannis, A. Broido, N. Brownlee, K. Claffy, M. Faloutsos, Is P2P dying or just hiding?, in: Proc. of IEEE GLOBECOM, November, 2004. [4] T. Karagiannis, A. Broido, M. Faloutsos, Transport layer identification of
P2P traffic, in: Proc. of ACM SIGCOMM IMC, August, 2004.
[5] A. Moore, K. Papagiannaki, Toward the accurate identification of network applications, in: Proc. of PAM Conf., March, 2005.
[6] S. Sen, O. Spatscheck, D. Wang, Accurate, scalable in-network identifica-tion of P2P traffic using applicaidentifica-tion signatures, in: Proc. of WWW Conf., May, 2004.
[7] T. Auld, A. Moore, S. Gull, Bayesian neural networks for Internet traffic classification, IEEE Transactions on Neural Networks 18 (1).
[8] M. Crotti, F. Gringoli, Traffic classification through simple statistical fin-gerprinting, ACM SIGCOMM Comput. Commun. Rev. 37 (1).
[9] P. Haffner, S. Sen, O. Spatscheck, D. Wang, ACAS: automated construction of application signatures, in: Proc. of ACM SIGCOMM MineNet, August, 2005.
[10] H. Jiang, A. Moore, Z. Ge, S. Jin, J. Wang, Lightweight application clas-sification for network management, in: Proc. of ACM SIGCOMM INM Workshop, August, 2007.
[11] A. Moore, D. Zuev, Internet traffic classification using bayesian analysis techniques, in: Proc. of ACM SIGMETRICS, June, 2005.
[12] M. Roughan, S. Sen, O. Spatscheck, N. Duffield, Class-of-service mapping for QoS: a statistical signature-based approach to IP traffic classification, in: Proc. of ACM SIGCOMM IMC, October, 2004.
[13] D. Zuev, A. Moore, Traffic classification using a statistical approach, in: Proc. of PAM Conf., March, 2005.
[14] G. Szabo, I. Szabo, D. Orincsay, Accurate traffic classification, in: Proc. of IEEE WoWMoM, June, 2007.
[15] L. Bernaille, R. Teixeira, K. Salamatian, Early application identification, in: Proc. of ACM CoNEXT, December, 2006.
[16] L. Bernaille, I. Akodkenou, A. Soule, K. Salamatian, Traffic classification on the fly, ACM SIGCOMM Comput. Commun. Rev. 36 (2).
[17] L. Bernaille, R. Teixeira, Early recognition of encrypted applications, in: Proc. of PAM Conf., April, 2007.
[18] A. Dainotti, W. de Donato, A. Pescape, P. Rossi, Classification of network traffic via packet-level hidden Markov models, in: Proc. of IEEE GLOBE-COM, November, 2008.
[19] J. Erman, M. Arlitt, A. Mahanti, Traffic classification using clustering al-gorithms, in: Proc. of ACM SIGCOMM MineNet, September, 2006. [20] J. Erman, A. Mahanti, M. Arlitt, I. Cohen, C. Williamson, Offline/realtime
traffic classification using semi-supervised learning, Performance Evalua-tion 64 (9-12).
[21] J. Erman, A. Mahanti, M. Arlitt, C. Williamson, Identifying and discrimi-nating between web and peer-to-peer traffic in the network core, in: Proc. of WWW Conf., 2007.