Performance Modeling of a JavaEE Component
Application using Layered Queuing Networks: Revised
Approach and a Case Study
Alexander Ufimtsev
Performance Engineering Laboratory School of Computer Science and Informatics, University College Dublin, Belfield, D4, Ireland
[email protected]
Liam Murphy
Performance Engineering Laboratory School of Computer Science and Informatics, University College Dublin, Belfield, D4, Ireland
[email protected]
ABSTRACT
Nowadays component technologies are an integral part of any enterprise production environment. Performance and scalability are among the key properties of such systems. Using Layered Queuing Networks (LQN), one can predict the performance of a component system from its design. This work revises the approach of using LQN templates and offers a case study by using the revised approach to model a realistic component application. Both strong points and shortcomings of the approach are discussed.
Keywords
performance modeling, JavaEE, component systems, ECPerf, Layered Queuing Network.
1.
INTRODUCTION AND MOTIVATION
Software products nowadays include various components de-veloped by third parties and running on a stack of multiple software layers. This makes it difficult to provide software performance guarantees. Many large software development projects fail to deliver the product on time, within bud-get, and with satisfactory QoS. Useful software engineering practices such as model checking, verification, and contin-uous testing help satisfy the functional requirements of the end product. However, some of the extra functional require-ments can only be checked during integration or even sys-tem testing, when the development cycle is in its final phase.Performanceis one of the extra functional requirements that is difficult to check outside of a proper testing environment. The use of more efficient programming languages, tools, and development environments has shifted the causes of perfor-mance problems. Architecture or design problems, as well as capacity planning miscalculations contribute to more than 17.8% of problems in enterprise applications, while ’buggy’ code contributes 17.3% [9]. Therefore, it is important for
system designers to be able to assess the performance prop-erties of the system (both software and hardware) early in development. System architects also need to ’plan ahead’, leaving room for possible future improvements.
Use of Layered Queuing Networks for modeling of component-based software can help system designers to assess the out-come of performance decisions, starting from very early stages of development. This work builds upon ’layered queuing network templates’ [8, 11] by analyzing key strengths and weaknesses of the approach and also by conducting a case study on a realistic application.
2.
LQN OVERVIEW
Layered Queuing Networks (LQN) is an extension of Queu-ing Networks that allows the software to be represented in layers, thus separating resources from a model and dividing a model into multiple submodels. LQN is abstract enough not to suffer from drawbacks of other popular formalisms, notably Stochastic Petri Nets (SPN).
Key advantages of LQN:
• Layered architecture of LQN ’naturally’ maps to
com-ponentized, multi-tiered, and multi-layered enterprise level software stacks;
• LQN is easily extend able to include newly discovered
bottleneck resource or device into existing model;
• LQN avoids state explosion as some other formalisms
(SPN-like) via higher level of abstraction;
• LQN is a formalism and provides robust analytical and
simulation-based tools.
LQN’s disadvantages:
• Does not allow any type of dynamism in the running
system, provides only steady state solutions;
• Does not have a notion or possibility to model
time-outs, locks, and workload variation within a run. To introduce some sort of dynamism to LQN one must have to solve LQN for different states first and then
bind them together with a form of Markov chain, with probability of the system changing its state from one to another.
• Requires a lot of data to be accurately collected,
in-terpreted, and put into a model to produce accurate results.
Basic LQN notation consists of three basic elements: cir-clesdenote resource type (CPU, disk, network),rectangles -software blocks. The right rectangle usually denotes an ob-ject/bean, while rectangles to the left from it denote an ac-tion happening with that object, such as method or funcac-tion call. Also, control rectangle usually indicates which type of resource it utilizes. Arrows depict control flow within the network.
3.
PROBLEM STATEMENT AND APPROACH
The purpose of this work was to understand how suitable were LQN templates for modeling JavaEE applications and what improvements to the approach needed to be done. Java Enterprise Edition (JavaEE) is a superset of Java Standard Edition (JavaSE), designed for multi-tier solutions [6]. It provides developers with the underlying infrastructure re-quired by the enterprise systems. J2EE’s core is a family of component models: on the client side, JavaBeans and applets; on the web server tier, J2servlets and Java Server Pages (JSPs); on the application server tier Enterprise Jav-aBeans (EJB).
Java EE’s ECperf application was selected to be modeled for a number of reasons. First, ECperf is an industry-standard JavaEE benchmark meant to measure the scal-ability and performance of JEE servers and containers. It stresses the ability of EJB containers to handle the complex-ities of memory management, connection pooling, passiva-tion/activation, and caching. ECperf is highly portable and runs on majority of application server, which makes it per-fect for future evaluation of the approach on different soft-ware and hardsoft-ware configurations. Second, ECPerf creators stress its ability to represent real-life business applications. ECPerf is designed as a typical web business application that permits customers direct specification of product con-figuration, ordering, and status checking. It also automates manufacturing, inventory, supplier chain management, and customer billing. Third, as a benchmark application it pro-vides necessary workload drivers and all the performance data aggregators in useful and professional manner.
4.
ECPERF: DESIGN
Originally developed by Sun Microsystems, ECPerf is now being developed and maintained by SPEC Corporation1. It is currently available from SPEC under the name of SPEC-jAppServer2004. ECperf has four domains implemented in its code: Manufacturing, Supplier & Service Provider, Cus-tomer, and Corporate. Each domain has separate database and applications. They provide the foundation for the ECperf workload. Customers contact the business through any num-ber of methods, including directly through the web. All of the worldwide offices and plants make frequent access to data held in the other offices or plants, and must, at times, 1http://www.spec.org
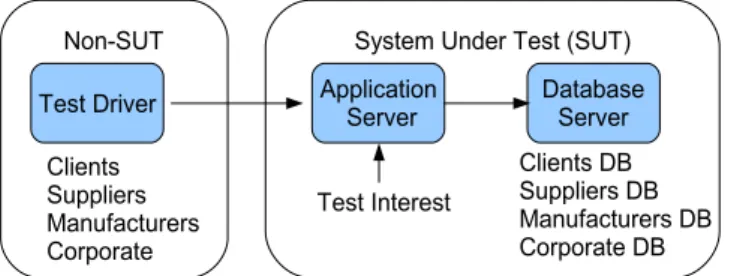
compare/collate/verify their data against that held world-wide. The company also interacts with completely separate supplier companies. Each supplier has its own independent set of computing resources. The overall setup can be seen in Figure 1.
Figure 1: High-Level Overview of Testing System
4.1
Customer Domain
Orders are placed by individual customers as well as by dis-tributors. The difference between the two is in the quantity of items ordered. Approximately 57% of work on the system is related to orders from distributors (i.e contain large num-ber of items), 43% is from individual customers. Customer domain implementation of ECperf contains seven beans: Or-derSes, OrderEnt, OrderLineEnt, ItemEnt, OrderCustom-erSes, OrderCustomerEnt, and CartSes.
4.2
Manufacturing Domain
There are two types of production lines: Planned lines and Largeorder lines. The planned lines run on schedule and pro-duce a pre-defined number of widgets. On the other hand, the largeorder lines run only when a large order is received from a customer such as a distributor. This domain is im-plemented with ten beans: WorkOrderSes, LargeOrderSes, ReceiveSes, PartEnt, AssemblyEnt, WorkOrderEnt, Large-OrderEnt, ComponentEnt, InventoryEnt, and BOMEnt.
4.3
Supplier Domain
The Supplier Domain decides which supplier to choose based on the parts that need to be ordered, the time in which they are required and the price quoted by suppliers. It is imple-mented in the system with seven beans: BuyerSes, Recei-verSes, SupplierEnt, SupplierComponentEnt, POEnt, PO-LineEnt, and SComponentEnt.
4.4
Corporate Domain
This domain manages the global list of customers, parts and suppliers and is implemented in three beans: CustomerEnt, DiscountEnt, RuleEnt.
5.
ECPERF: PERFORMANCE ANALYSIS
By analyzing the source code and execution traces of ECperf it became clear that only two domains make significant per-formance impact: manufacturing and customer. Other types of domains fail to make any significant impact on perfor-mance.5.1
Workload Generation
ECperf workload is generated by so-called ’Driver’ script, that runs ’agents’. Standard ECperf configuration features
three agents, one per domain:ordersAgent(customers), mf-gAgent(manufactures), andloAgent (large orders). Strictly speaking,loAgent is not a new domain, but rather belongs to both customers and manufactures. Agents, in their turn, start up and control the client instances that issue requests to the servers (See Figure 2). The number of planned lines and order lines depends on scale parameter.
Figure 2: ECperf Workload Overview All the loops wait for a certain period of time. It is hard-coded for one second for large order agent, configured to 100 ms for mfgAgent and for orderEntry it is set to a negative exponential distributionT c=−ln(x)/Ir, whereln- natural
log (base e), x - random number with at least 31 bits of precision,Ir - mean Injection Rate.
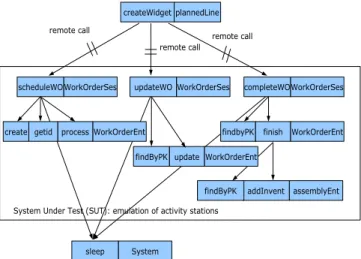
Figure 3 shows an overview of manufacturing activity in LQN notation. System sleep is necessary to introduce emu-lation of activity stations that gradually change workorder state from ’scheduled’ to ’updated’, and finally to ’com-pleted’. WorkOrderSes session bean also creates, searches, and updates a few entity beans.
Figure 3: High-level overview of Manufacturer Sys-tem Activity
Large orders agent just pulls information from the database about large orders once per second and updates its statistics Order entry represents a significant amount of system activ-ity and due to space limitations we are unable to show the whole LQN diagram. The stream of order entry transactions is split in the following way:
• newOrder - 50%
Figure 4: Large Orders Agent activity
• getOrderStatus - 20% • changeOrder - 20% • getCustStatus - 10%
There is also 10% chance that order is going to be large, 50% chance that people buy goods right away and another %50 - that they will use a shopping cart. In 90 percent of cases, peopledeletethe content of their shopping cart. The Metric for the Customer Domain is Transactions/min. The metric for the Manufacturing Domain isWorkorders/min, whether produced on the Planned lines or on the LargeOrder lines.
5.2
Addressing Ambiguity
A few features or implementation details of ECperf pre-sented a modeling challenge. First, since ECperf was de-signed after typical web-based enterprise applications, it in-tentionally did not keep the database size stable. In fact, it kept growing throughout each test and had to be reinitial-ized before a new one. Second, even the initial database size,
e.g. the initial number of customers and products depends on the expected (configurable) workload. This is another reason why databases have to be swept clean and repopu-lated with data upon startup of another test. Third, ECperf authors made some provisions for unstable environment. If a transaction fails for whatever reason (timeouts, database lock,etc.), ECperf handles this exception and retries it from 5 to 20 times before failing.
All of the above uncertainties had to be abstracted in order to keep the scope of the use case feasible. Database size for the model was chosen as an average of the real database size before and after test run. We presume this is correct since database never becomes a bottleneck device throughout the test. We also had to average in all the retries and transaction rollback that happened.
The rest of the testsuit was modeled using the following refined principles:
• Communication is broken into two types: local and
remote. Remote one is modeled with a network re-source/processor. Local calls that don’t exercise Re-mote Method Invocation (RMI) are modeled as simple LQN calls without any resource consumption.
• Container services is an aggregate term for any
ad-ditional activities performed by container. It is not modeled separately, but spread across execution times.
• Reflection - included in container services times. • Connection pooling- two essential queues are modeled:
container threads and database threads.
• Transaction manager - again, included in overall
con-tainer services for model simplicity. No specific model for the actually transaction rollback is specified.
• Security- security checks are modeled with submodels
of beans.
• Garbage Collection (GC) is not addressed in the
cur-rent version of model, since the complexity and closed source code of JVM makes it hard to derive correct models. GC time is generally spread across container services.
• Naming - modeled through container services • Database - modeled with an average response time.
It is possible, however, to model it with any specified distribution of response times.
6.
RELATED WORK
The following solutions have been offered so far. Luiet al. [7] proposed a method for predicting performance of J2EE ap-plications at design level. Their method seems overopti-mistic when assessing performance due to reliance on the profiled data instead of models. Denaro et al. [2] came up with generic framework for performance testing of dis-tributed component architectures. The evaluation of the approach is not formal and based on creating a stub appli-cation, which then is run in the real environment.
7.
MODELING APPROACH
The proof of concept use of LQN for modeling of EJB-based applications has been demonstrated by Xuet al. [11]. Pro-duced LQN-EJB templates can be instantiated according to specific function requirement in each scenario for system us-age, and then be assembled into a complete LQN model for the whole scenario. General information on functional as-pects of EJB technology as well as specific models for each bean type were presented in [11].
A system is modeled by presenting the beans as tasks with estimated parameters, then instantiating the template to wrap each class of beans in a container, and finally adding the execution environment including the database. Calls between beans, and calls to the database, are part of the final assembly. The model may be calibrated from running data, or by combining
• knowledge of the operations of each bean;
• pre-calibrated workload parameters for container
ser-vices, communication, and database operations.
7.1
Hardware platform
The testing environment includes four x86 machines:
• application server Pentium III-866 Mhz with 512 Mb
RAM;
• databasePentium III-800Mhz with 512 Mb RAM; and
client
• client Pentium IV-2.2 Ghz, 1024 Mb RAM.
The client machine is more or as powerful as servers to en-sure it does not become a bottleneck when generating the test load.
7.2
The software environment
The following software was used for testing purposes:
• operating system: Debian GNU/Linux 3.1 ’sarge’,
ker-nel v 2.6.8-3;
• database server: MySQL v. 4.0.23-7; • application server: JBoss v. 4.01sp1; • JVM: Java2SDK 1.4.2 09.
Measurements on the container and program execution were obtained by running JProbe 5.2.1 Freeware profiler for Linux. The following options were used for JVM startup:
• The initial Java heap size was 480M B;
• parameter-XX:+PrintCompilationwas set to monitor
the runtime behavior of the JVM.
8.
MODEL CALIBRATION AND TESTING
8.1
Benchmarking results
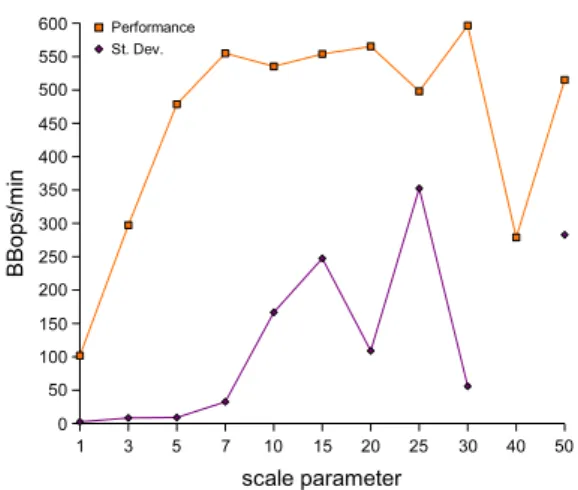
Performance benchmarking of ECPerf produced the follow-ing results (See Figure 5). The X-axis shows the value of SCALE parameters while Y-axis shows the number of busi-ness operations per minute (BBops/min).
Scale value is not equal to number of users, but rather
user num=f(scale). In our case, user num= 5∗scale.
The minimal number of users in the system is 5, and the maximum measured is 250. The second line of in bench-marking figure shows standard deviation of the results ob-tained. It can be noted that results become quite unsta-ble once SCALE goes over 10, while overall performance does not seem to increase. Also, once load reaches 50 users (SCALE=10) the system starts producing errors (time outs, etc) due to overload. Therefore, system achieves its peak performance with SCALE=7, or 35 users. Figure 6 shows response times for Manufacturing and Orders for the respec-tive workload.
Figure 5: Results of ECPerf benchmarking on Ap-plication Server 1
Figure 6: Response Time of ECPerf on Application Server 1
8.2
Resource Utilization
Various resource were used during benchmarking, including CPUs of the test machines, network, HDDs, etc. Except for SCALE=1, the CPU of the application server was the bottleneck. CPU usage of client and db machines reached 17 percent at max with average utilization of 5-7 per cent. Network utilization was around 1%. Disk usage for both database and application server was also negligible.
8.3
Model Calibration
The model constructed in Section 8 was calibrated from the profiling data under a minimal workload. During the mea-surement phase JProbe profiling tool introduced significant overhead, so the execution demand values extracted from profiling data are adjusted to remove the contribution of overhead. This was done by using a Profiling Ratio Factor
(PFC) based on the assumption that the profiling overhead is proportionally distributed across the operations within some section of the scenario. The factor was obtained for each section by measuring the service time with and with-out profiling and taking the ratio. For the configuration of Jboss running on Server 1, PFC varied from 1 (for low-level operations) to 7.49 for business method related operations. The problems also included the fact that the cycle times in ECPerf were very dynamic and depended on the response time.
8.4
Result Analysis
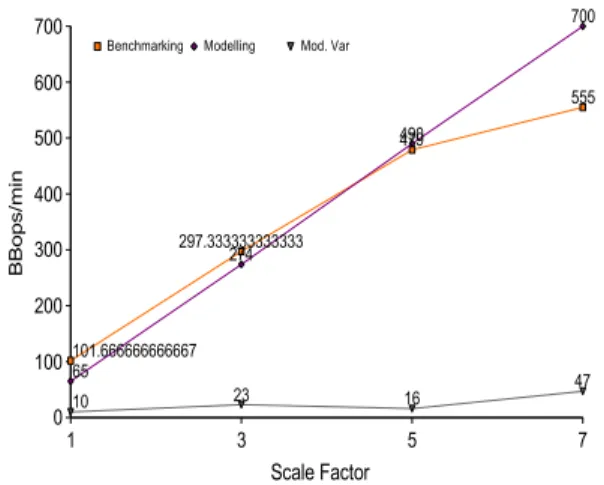
Calibrated LQN simulation gave quite close results to the tested real-life configuration (See Figure 7). The modeled results were aggregated using formula in Subsection 5.1. For low and middle workloads the LQN results were a bit more pessimistic than real ones. At the higher loads, however, LQN results become more optimistic. The worrying trend is that LQN model continues to predict higher performance than the real system at an optimal workload. We were un-able to identify the reason for this behavior. However, we noticed that variance for the overall response time in the model greatly increased when the workload reached its peak. This could be due to lack of locking in LQN, or a missed bot-tleneck resource in the model. The most likely ’offenders’ are transaction and security features of application server, and database record locking.
9.
CONCLUSIONS AND FUTURE WORK
We presented evaluation of using Layered Queuing Network (LQN) templates for modeling JavaEE component appli-cation ECperf. Various modeling problems have been ad-dressed within limitations allowed by LQN formalism. We showed that despite our efforts, ECperf prediction was overop-timistic comparing to the real system, which suggests a missed resource congestion point due to wrong model, as-sumptions or LQN limitations.
Future work will include more precise modeling of JavaEE container services, such as transaction & security. This way we hope to eliminate the current problem of ’overoptimism’ in LQN templates. Once ECperf model up and working, we will try to use the same approach for different hardware and software. There is a room for other influential services outside JVM, such as Virtual Memory Manager (VMM). VMMs were shown to have a significant effect on component-based application performance [10].
Figure 7: Response Time of ECPerf on Application Server 1
10.
ACKNOWLEDGMENT
The support of the Informatics Commercialization initiative of Enterprise Ireland is gratefully acknowledged.
11.
REFERENCES
[1] Cecchet, E., Marguerite, J., Zwaenepoel, W.:
Performance and Scalability of EJB Applications Proc of 17th ACM Conference on Object-Oriented
Programming, Seattle, Washington, (2002). [2] Denaro, G., Polini, A., and Emmerich, W.: Early
performance testing of distributed software applications Proc of the Fourth international Workshop on Software and Performance, Redwood Shores, California, (2004) 94-103
[3] Descripton of LQN XML Schema http://www.sce.carleton.ca/rads/lqn/lqn-documentation/schema/
[4] ECperf Kit Sun Microsystems
http://java.sun.com/developer/releases/j2ee/ecperf/ [5] Gorton, I., Liu, A.: Performance Evaluation of
Alternative Component Architectures for Enterprise JavaBean Applications in IEEE Internet Computing, vol.7, no. 3, pages 18-23, 2003
[6] Java Enterprise Edition Sun Microsystems http://java.sun.com/javaee/
[7] Liu, Y., Fekete, A., Gorton, I.: Predicting the Performance of middleware-based applications at the design level Proc of Fourth International Workshop on Software and Performance, Redwood Shores,
California (2004) 166-170.
[8] Oufimtsev, A. and Murphy, L.: Predicting Performance of EJB-based Systems Using Layered Queueing Networks Proc. of OOPSLA conference, ACM, Oct. 2004 (poster)
[9] The State of J2EE Application Management: Analysis of 2003 Benchmark Survey Survey Analysis by Ptak, Noel & Associates
http://ptaknoelassociates.com/members/J2EE app mgmt survey.pdf
[10] Ufimtsev, A., Murphy, L., Kucharenka A.: Impact of Virtual Memory Managers on Performance of J2EE Applications In Proceedings of Component-Based Software Engineering (CBSE) conference, Vesteras, Sweden, June 2006
[11] Xu, J., Oufimtsev, A., Woodside, M., Murphy, L.: Performance Modeling and Prediction of Enterprise JavaBeans with Layered Queuing Network Templates Proc of SAVCBS Workshop, FSE, Lisbon (2005)