Annual Report:
Budget Review
2011
Mail Stop N-127
Board of Governors of the Federal Reserve System Washington, DC 20551
(ph) 202-452-3245 (fax) 202-452-5886 (e-mail) [email protected]
This and other Federal Reserve Board reports are also available online at www.federalreserve.gov/boarddocs/rptcongress/default.htm.
Contents
Introduction
... 1Overview of the Federal Reserve System... 1
Summary of 2010 Income and Expenditures ... 2
Operational Areas... 3
Federal Reserve System Budget
... 92011 System Budget Initiatives... 10
Trends in Expenses and Employment ... 11
2011 Capital Budgets... 12
Board of Governors Budgets
... 13Budget ... 13
2010 Budget Performance ... 16
Federal Reserve Bank Budgets
... 192010 Budget Performance ... 20
Initiatives Affecting the 2011 Budget ... 21
Five-Year Trend in Reserve Bank Expenses ... 23
2011 Personnel Expenses... 24
Risks in the 2011 Budget ... 25
2011 Capital Plan... 25
Currency Budget
... 27Printing of Federal Reserve Notes... 28
Currency Transportation ... 29
Counterfeit-Deterrence Research... 29
Bureau of Engraving and Printing Finance Directorate ... 29
Appendix A: Federal Reserve Budget Processes
... 31Board of Governors... 31
Federal Reserve Banks... 31
Currency... 32
Appendix B: Priced Services
... 35Annual Pricing Process... 35 i
Appendix C: Expenses and Employment at the
Board of Governors
... 37Appendix D: Expenses and Employment at the
Federal Reserve Banks
... 41Appendix E: Maps of the Federal Reserve System
... 45Introduction
This publication provides current budgeted expenses of the Federal Reserve Board of Governors and the Federal Reserve Banks, as well as the previous year’s income and expenses for both the Board and the Banks. It also describes their budgeting process and shows trends in their expenses and employment. For a comprehensive report on the Board and Reserve Bank’s operations and activities during the year, see theAnnual Report of the Board of Governors of the Federal Reserve Systematwww.federalreserve.gov/ boarddocs/rptcongress.
Overview of the Federal Reserve System
The Federal Reserve System—the nation’s central bank—consists of the Board of Governors in Washington, DC, the 12 Federal Reserve Banks and their 24 branches distributed throughout the nation, the Federal Open Market Committee (FOMC), and three advisory councils—the Federal Advisory Council, the Community Depository Institutions Advisory Council,1and the Consumer Advisory Council. The System was created in
1913 by the Congress to establish a safe and flexible monetary and banking system. Over the years, the Congress has adjusted the Federal Reserve’s authority and responsibility to help achieve broad national economic and financial objectives.
As the nation’s central bank, the Federal Reserve System has numerous, varied responsibilities, including
• conducting the nation’s monetary policy by influencing money and credit conditions in the economy in pursuit of full employment and stable prices; • supervising and regulating banks and other important financial institutions
to ensure the safety and soundness of the nation’s banking and financial system and to protect the rights of consumers;
• maintaining the stability of the financial system and containing systemic risk that may arise in financial markets; and
• providing certain financial services to U.S. financial institutions, the U.S. government, and foreign official institutions.
1The Community Depository Institutions Advisory Council is a new council, formed by the Board in 2010 to replace the Thrift Institutions Advisory Council. For more information, see www.federalreserve.gov/newsevents/press/other/20101001a.htm.
The Federal Reserve System plays a major role in the nation’s payment system. The Federal Reserve Board issues currency to the Reserve Banks. The Reserve Banks distribute currency and coin to financial institutions; process Fedwire funds, automated clearinghouse, and securities transfers; and collect checks. In addition, the Reserve Banks serve as the fiscal agents of the United States and perform a variety of financial services for the U.S. Treasury, other government agencies, and other fiscal principals. For a more detailed discussion of the Federal Reserve’s responsibilities, visit the Board’s website atwww.federalreserve.gov/aboutthefed.
Summary of 2010 Income and Expenditures
In carrying out its responsibilities in 2010, the Federal Reserve System incurred $3.2 billion in net expenses. Total spending of $4.2 billion was offset by $1.0 billion in revenue from priced services, claims for reimbursement, and other income. Total 2010 expenses were $132.0 million, or 3.0 percent, less than the amount budgeted for 2010 (table 1).The Reserve Banks’ current income in 2010 was $79.3 billion.2The major
sources of income were interest earnings from the portfolio of U.S. government securities ($29.9 billion) and federal agency mortgage-backed securities ($44.8 billion) in the System Open Market Account. Earnings in excess of expenses, dividends, and surplus are transferred to the U.S. Treasury—in 2010, a total of $79.3 billion. (These net earnings are treated as receipts in the U.S. budget accounting system when received and as anticipated earnings projected by the Office of Management and Budget in the U.S. budget.)
2For a list of items included in the Reserve Banks’ current income, refer to Table 10, Income and expenses of the Federal Reserve Banks, in the “Statistical Tables” section of the2010 Annual Report of the Board of Governors of the Federal Reserve System, available atwww .federalreserve.gov/boarddocs/rptcongress.More detailed information on System income and the distribution of income can also be found in theAnnual Report.
Table 1. Total expenses of the Federal Reserve System, 2010 Millions of dollars, except as noted
Budgeted Actual Variance Amount Percent Reserve Banks 3,221.3 3,183.0 −38.3 −1.2 Board1 451.1 437.4 −13.7 −3.0 Currency 702.9 622.9 −80.0 −11.4
Total System expenses 4,375.3 4,243.3 −132.0 −3.0
Note: Components may not sum to totals and may not yield percentages shown because of rounding.
1During 2010, the Board approved an increase of $6.9 million, or 1.6 percent, in the Board’s initial operating budget of
Operational Areas
In 2010, the Federal Reserve System reported costs using the following categories: monetary and economic policy, supervision and regulation of financial institutions, services to financial institutions and the public, services to the U.S. Treasury and other government agencies, and System policy direction and oversight.
Monetary and Economic Policy
The monetary and economic policy operational area encompasses Federal Reserve actions to influence the availability and cost of money and credit in the pursuit of the nation’s objectives of maximum employment, stable prices, and moderate long-term interest rates. During 2010, the economy continued to recover from the deep recession triggered by the financial crisis, albeit at an uneven pace. The Federal Open Market Committee (FOMC) held eight regularly scheduled meetings in 2010, plus two additional meetings by videoconference.3
To promote continued economic recovery, the FOMC maintained the target range for the federal funds rate at 0 to 1/4 percent throughout the year. With the federal funds rate virtually at its lowest possible level, the FOMC continued the large-scale purchases of federal agency debt and agency mortgage-backed securities it had initiated in late 2008 and early 2009 in order to improve market functioning and provide additional stimulus to the economy. These purchases were completed in the first quarter of 2010. The slowdown in the pace of the recovery around mid-year suggested that the Federal Reserve could well fall short of its statutory mandate of maximum employment and price stability for some time. In response, last August, the Federal Reserve began to reinvest principal payments on agency debt and agency-backed mortgage-backed securities holdings in longer-term Treasury securities, so as to keep the size of its securities holdings roughly constant and so avoid an undesirable tightening of monetary conditions. And in November, the Committee announced that it intended to purchase an additional $600 billion in longer-term Treasury securities by the end of the second quarter of 2011 in order to provide additional support to the economic recovery and to help ensure that inflation, over time, is at levels consistent with its mandate.
In light of improved functioning in the U.S. financial markets, the Federal Reserve in early 2010 closed most of its extraordinary liquidity programs. These facilities included the Asset-Backed Commercial Paper Money Market Mutual Fund Liquidity Facility, the Commercial Paper Funding Facility, the
3FOMC meeting minutes and policy statements are available on the Board’s website at www.federalreserve.gov/monetarypolicy/fomccalendars.htm.
Primary Dealer Credit Facility, the Term Auction Facility, and the Term Securities Lending Facility. The final operations of the Term Asset-Backed Securities Loan Facility were held prior to mid-year. The liquidity swap lines with foreign central banks that had been established during the crisis expired on February 1, 2010. However, market concerns about the fiscal challenges facing some peripheral European nations increased in the spring, leading to some strains in European interbank funding markets. Against this backdrop, the Federal Reserve in May 2010 reestablished dollar liquidity swap lines with five foreign central banks.
The wind-down of the Federal Reserve’s liquidity facilities tended to reduce the size of the Federal Reserve’s balance sheet in 2010, but that tendency was about offset by large-scale asset purchases, leaving the stock of reserve balances little changed at a very high level over the year. Although the FOMC continued to anticipate that economic conditions were likely to warrant exceptionally low levels of the federal funds rate for an extended period, the Board and the FOMC developed tools, including reverse repurchase agreements with a range of counterparties and a new term deposit facility, that will allow the Federal Reserve to reduce the supply of reserve balances, if needed, when it becomes appropriate to begin removing monetary accommodation. Tests of both reverse repurchase agreements and the term deposit facility were conducted over the course of 2010 to ensure the effectiveness of the tools and to provide eligible institutions with an
opportunity to gain familiarity with the procedures.
The Board and the FOMC base their monetary policy decisions on high-quality research and thorough analysis of economic and financial data. A vast amount of banking and financial data flows through the Reserve Banks to the Board, where the data are compiled and made available to the public. The research staffs at the Board and at the Banks use the data, along with information collected by other public and private institutions, to assess the state of the economy and the relationships between the financial markets and economic activity. Staff members provide background information to the Board of Governors and the FOMC by preparing detailed economic and financial analyses and projections for the domestic economy and
international markets. The Board and the FOMC use these analyses and projections in establishing the appropriate stance for monetary policy. Staff members also conduct longer-run economic studies on regional, national, and international issues.
To improve the Federal Reserve’s monitoring of the financial system and to coordinate work bearing on financial stability, the Board last November created the Office of Financial Stability Policy and Research (OFSPR). This office brings together staff with a range of backgrounds and skills— including economists, banking supervisors, and market experts—and works closely with other groups throughout the Federal Reserve System. It helps
monitor financial risks and analyze the implications of those risks for financial stability. It also supports the Federal Reserve Board Chairman’s role as a member of the Financial Stability Oversight Council, a collaborative body created by the Dodd-Frank Wall Street Reform and Consumer Protection Act (Dodd-Frank Act) to bridge regulatory gaps and monitor systemic risks. In addition, the OFSPR helps develop and evaluate alternative approaches to implementing macroprudential regulations and works with bank supervisory committees on a variety of issues, such as developing quantitative loss models and alternative scenarios to serve as the basis for stress tests.
Supervision and Regulation of Financial Institutions
The Federal Reserve plays a major role in the supervision and regulation of banks and bank holding companies. The Board of Governors adopts regulations to carry out statutory directives, and establishes System supervisory and regulatory policies. The Reserve Banks conduct on-site examinations and inspections of state member banks and bank holding companies; review applications for mergers, acquisitions, and changes in control from banks and bank holding companies; and take formal supervisory actions. In 2010, the Federal Reserve conducted 722 examinations of state member banks (some of them jointly with state agencies), 654 inspections of large bank holding companies, and 3,199 inspections of small, noncomplex bank holding companies; it acted on 699 proposals, representing 1,366 individual applications involving bank holding company formations and acquisitions, bank mergers, and other transactions. The Board also enforces compliance by state member banks and certain foreign banking organizations with federal laws protecting consumers who use credit and deposit accounts. During the reporting period from July 1, 2009, to June 30, 2010, the System conducted 300 consumer compliance examinations of its 858 state member banks and three foreign banking organizations.4During this period, the System also conducted 267
examinations of banks for their compliance with the Community Reinvestment Act.
The Board’s supervisory responsibilities also extend to the foreign operations of U.S. banks and, under the International Banking Act, to the U.S.
operations of foreign banks. Beyond these activities, the Federal Reserve System maintains continuous oversight of the banking industry as part of its effort to ensure the overall safety and soundness of the financial system.
4The foreign banking organizations examined by the Federal Reserve are organizations that operate under section 25 or 25A of the Federal Reserve Act (Edge Act and agreement corporations) and state-chartered commercial lending companies owned or controlled by foreign banks. These institutions are typically not subject to the Community Reinvestment Act, and they typically engage in relatively few activities covered by consumer protection laws.
Services to Financial Institutions and the Public
The Federal Reserve System plays a central role in the nation’s payment systems by ensuring that enough currency and coin are in circulation to meet the public’s demand. As the issuing authority for Federal Reserve notes, the Federal Reserve Board orders new currency from the Bureau of Engraving and Printing, pays for the printing and transportation of currency, and issues currency to the Reserve Banks. The Reserve Banks order new coin from the U.S. Mint to supplement inventories and distribute new and fit currency and coin through depository institutions to meet public demand. The Reserve Banks also receive deposits of currency and coin from depository
institutions; identify suspect counterfeit currency, which they forward to the U.S. Secret Service; and destroy currency that is unfit for circulation. In 2010, the Reserve Banks distributed approximately $687.8 billion in currency and $6.5 billion in coin to depository institutions. The Reserve Banks also received approximately $633.9 billion in currency and $6.0 billion in coin from depository institutions, and they destroyed $120.0 billion in unfit currency. In 2010, the cost of printing and transporting currency was $622.9 million.
The Reserve Banks also play a central role in the nation’s payment systems by collecting checks and providing a variety of electronic services for depository institutions. In 2010, the Banks collected approximately 7.7 billion
commercial checks, with a total value of about $11.1 trillion. The Banks’ automated clearinghouse (ACH) service allows depository institutions to send or receive credit transfers, such as direct payroll payments and corporate payments to vendors, and debit payment transactions, such as payments of insurance premiums, mortgages, loans, and other bills from consumer accounts. In 2010, the Reserve Banks processed approximately 11.5 billion ACH transactions, valued at about $21.4 trillion. Approximately 11 percent of the transactions were for the federal government; the rest were for commercial establishments.
The Reserve Banks’ Fedwire Funds Service allows participants to use their accounts at the Reserve Banks to transfer funds to other participants. In 2010, the Reserve Banks processed approximately 125 million Fedwire funds transfers, valued at more than $608 trillion.
The Reserve Banks’ National Settlement Service allows participants in private clearing arrangements to settle transactions through their Federal Reserve accounts. In 2010, approximately 19 local and national private arrangements, primarily check clearinghouse associations, used the National Settlement Service. The Reserve Banks processed more than 519,000 settlement entries for these arrangements, with a debit value of more than $14.5 trillion in 2010.
The Reserve Banks’ Fedwire Securities Service provides securities services to participants, including the settlement of book-entry transfers of securities issued by the U.S. Treasury, federal government agencies, government-sponsored enterprises, and certain international organizations. In 2010, participants originated approximately 20.5 million transfers, valued at more than $325 trillion.
Services to the U.S. Treasury and Other Government Agencies
As fiscal agents and depositories for the federal government, the Federal Reserve Banks auction Treasury securities; process electronic and check payments for Treasury; collect funds owed to the federal government; maintain Treasury’s bank account; and develop, operate, and maintain a number of automated systems to support Treasury’s mission. The Reserve Banks also provide certain fiscal agency and depository services to other entities; these services are primarily related to book-entry securities. Treasury and other entities fully reimbursed the Reserve Banks for the costs of providing fiscal agency and depository services. In 2010, reimbursable expenses amounted to $456.4 million.The Reserve Banks auction, issue, maintain, and redeem securities, as well as operate the automated systems supporting paper U.S. savings bonds and book-entry marketable Treasury securities. In 2010, the Reserve Banks conducted 301 Treasury securities auctions and processed nearly 11.5 million Treasury securities transfers. The Reserve Banks also printed and mailed more than 16 million savings bonds. The Reserve Banks continued to support Treasury’s efforts to improve the quality and efficiency of its securities services.
The Reserve Banks collect and disburse funds on behalf of the federal government. In 2010, the Reserve Banks processed 1.2 billion government ACH payments and 185 million Treasury check payments. The Reserve Banks continued to support Treasury’s ongoing effort to convert paper checks to electronic payments through the Go Direct initiative, and operated Pay.gov, an application supporting Treasury’s program that allows the public to use the Internet to authorize and initiate payments to federal agencies. The Treasury maintains operating cash accounts at the Reserve Banks. In 2010, the Reserve Banks continued to support Treasury’s effort to modernize its financial management processes, with a focus on improving centralized government accounting and reporting functions. The Reserve Banks also managed several new and ongoing software development efforts in support of Treasury’s objectives.
When permitted by federal statute or when required by the Secretary of the Treasury, the Reserve Banks provide fiscal agency and depository services to other domestic and international entities. Book-entry securities issuance and
maintenance activities account for a significant amount of the work performed for these entities.
System Policy Direction and Oversight
This operational area encompasses activities by the Board of Governors in supervising Board and Reserve Bank programs.
Federal Reserve System Budget
Total expenses for the Federal Reserve System for 2011 are budgeted at $4,520.9 million, an increase of 6.5 percent from 2010 actual expenses. Of this total, $3,351.2 million is for the Reserve Banks, $493.6 million is for the Board and the Office of Inspector General (OIG), and $676.1 million is for the cost of new currency (table 2andtable 3). Revenue from priced services provided to depository institutions is expected to total $497.2 million, or
11 percent of total budgeted expenses. This revenue, combined with claims for reimbursement and other income, results in the recovery of approximately 22 percent of the System’s budgeted 2011 expenses.5When these items are
deducted from budgeted 2011 expenses, net expenses for the System are 9.9 percent higher than 2010 net expenses (table 2).
5Claims for reimbursementrefers to costs of fiscal agency and depository services provided to the U.S. Treasury, other government agencies, and other fiscal principals that are billed to these agencies. Other income comes from services provided on behalf of the U.S. Treasury that are paid for by the depository institutions using the services, which include the transfer of funds between depository institutions and the Treasury.
Table 2. Total expenses of the Federal Reserve System, net of receipts and claims for reimbursement, 2009–11
Millions of dollars, except as noted
Item (actual)2009 (actual)2010 (budgeted)2011
Percent change
2009 to 2010 2010 to 2011
Total System expenses1 4,041.4 4,243.3 4,520.9 5.0 6.5
Less
Revenue from priced services 675.4 574.7 497.2 −14.9 −13.5 Claims for reimbursement2 450.3 456.4 492.2 1.4 7.8
Other income 1.3 1.5 1.7 12.6 14.5
Equals
Net System expenses 2,914.4 3,210.8 3,529.9 10.2 9.9
Note: Components may not sum to totals and may not yield percentages shown because of rounding. Total expenses reflect all redistributions for support and overhead and exclude capital outlays.
1
Includes extraordinary items and expenses of the Office of Inspector General.
2Costs of fiscal agency and depository services provided to the U.S. Treasury, other government agencies, and other fiscal
principals that are billed to these agencies.
The distribution of budgeted expenses is similar to that in previous years, with the Reserve Banks’ expenses accounting for 74 percent of the total, new currency expenses accounting for 15 percent, and Board expenses accounting for the remainder (figure 1).
System employment is budgeted at 20,310 for 2011, an increase of 641 from the 2010 level, primarily due to planned staff additions needed to implement new requirements under the Dodd-Frank Act.6
2011 System Budget Initiatives
The Reserve Bank budgets are funding increases in the central bank functions, specifically supervision and regulation and the open market operation in New York, offset by the continued reductions in check operations. The major factors affecting the 2011 Reserve Bank budgets are outlined in more detail in the “Federal Reserve Bank Budgets” section of this report (see page 19).
6Employment numbers stated include position counts for the Board and average number of personnel (ANP) for the Reserve Banks.
Figure 1. Distribution of budgeted expenses of the Federal Reserve System, 2011
Reserve Banks, 74%
Board of Governors, 11%
Currency, 15%
Table 3. Expenses of the Federal Reserve System for operations and currency, 2009–11 Millions of dollars, except as noted
Item 2009 (actual) 2010 (actual) 2011 (budgeted) Percent change 2009 to 2010 2010 to 2011 Reserve Banks1 3,142.5 3,183.0 3,351.2 1.3 5.3 Personnel 2,155.7 2,211.8 2,371.7 2.6 7.2 Nonpersonnel 986.9 971.2 979.5 −1.6 0.8 Board of Governors2 396.8 437.4 493.6 10.2 12.8 Personnel 294.1 325.0 360.1 10.5 10.8 Nonpersonnel 102.7 112.4 133.5 9.4 18.8 Currency3 502.1 622.9 676.1 24.1 8.6
Total System expenses 4,041.4 4,243.3 4,520.9 5.0 6.5
Note: Expenses exclude capital outlays. Components may not sum to totals and may not yield percentages shown because of rounding.
1For detailed information on Reserve Bank expenses, see the “Federal Reserve Bank Budgets” section, p. 19. 2Includes extraordinary items and expenses of the Office of Inspector General. See also the “Board of Governors Budgets”
section, p. 13.
Trends in Expenses and
Employment
From the actual 2002 level to the budgeted 2011 amount, the total expenses of the Federal Reserve
System have increased an average of 4.0 percent per year (1.6 percent per year when adjusted for inflation) (figure 2). Over the same period, nondefense discretionary spending by the federal government has increased an average of 6.3 percent per year (figure 3). Over the 2002–2011 period, Federal Reserve System employment has decreased 4,410 (figure 4).
While the most recent budget year reflects the planned increases for resources to address requirements under the Dodd-Frank Act, prior years reflect
spending restraint and substantial staffing decreases due to restruc-turing efforts in the check processing function and efficiency measures in the support and overhead functions. Over the same 10-year period, check costs decreased an average of 13.2 percent annually, and check staff declined an average of 20.9 percent annually. Local support and overhead costs increased an average of 2.2 percent annually and the associated staffing level declined an average of 2.9 percent annually over the same 10-year period.
Figure 2. Total expenses of the Federal Reserve System, 2002–11
Note: For 2011, budgeted. Includes extraordinary items and expenses of the Office of Inspector General.
1Calculated with the GDP price deflator.
Billions of dollars 5 4 3 2 1 2002 2004 2006 2008 2010 2012 Current dollars 2005 dollars1
Figure 3. Cumulative change in Federal Reserve System expenses and federal government expenses, 2002–11
Note: For 2011, budgeted.
1Discretionary spending less expenditures on defense.
Source:Budget of the United States Government, Fiscal Year 2011: Historical Tables, Table 8.1. Outlays by Budget Enforcement Act Category, 1962–2015.
2
Includes extraordinary items and expenses of the Office of Inspector General.
2002 2004 2006 2008 2010 2012 90 80 70 60 50 40 30 20 10 0 Federal government Federal Reserve 1 2 Percent
Figure 4. Employment in the Federal Reserve System, 2002–11
Note: For 2011, budgeted. Employment numbers presented include position counts for the Board and average number of personnel (ANP) for the Reserve Banks. 2002 2004 2006 2008 2010 2012 30 25 20 15 10 Thousands of persons
2011 Capital Budgets
The capital budgets for the Reserve Banks and the Board total $442.9 million, with $417.6 million budgeted for the Reserve Banks, Federal Reserve Information Technology, and Office of Employee Benefits and $25.2 million budgeted for the Board and the OIG. As in previous years, the 2011 capital budgets include funding for projects that support the strategic direction outlined by the individual Reserve Banks, System business leaders, and the Board. These strategic goals focus on investments that continue to improve operational efficiencies, enhance services to bank customers, and ensure a safe and productive work environment. More detailed discussions of the Board and Reserve Bank capital budgets are included in the “Board of Governors Budgets” and “Federal Reserve Bank Budgets” sections on pages 13 and 19, respectively.
Board of Governors Budgets
For 2010, the Board moved from a two-year budget to a single-year budget because of the changes in demands placed on the Board during the financial crisis and the potential impact of regulatory restructuring proposals then being debated in Congress. Given the continuing demands on the Board to implement the requirements contained in the Dodd-Frank Act and lessons learned through the financial crisis, the Board also developed a one-year budget for 2011.
Budget
Board of Governors
For 2011, the Board approved a $475.6 million operating budget, a $5.5 million single-year capital budget, and a $19.7 million increase to the multiyear capital projects budget (table 4). The budget reflects growth in personnel services expenses as well as increased costs for goods and services. Growth in personnel services includes the full-year impact of positions added in 2010, including the creation of the new OFSPR.7Other personnel services
growth in the 2011 budget includes funding for increases in benefit liabilities as determined by the Federal Reserve System’s actuaries and increases in the accrued leave liability. Growth in the cost of goods and services is driven by the loss of $1.4 million in lease income from the tenant of a Board building, as well as increases in anticipated expenditures for travel and furniture and equipment. These increases are partially offset by $10.5 million in savings from the Survey of Consumer Finance Data, which is conducted only every three years.
On December 22, 2010, President Obama signed legislation prohibiting statutory pay adjustments for most federal employees and freezing base pay for senior executives. Consistent with the legislation and implementing guidance issued by the Office of Personnel Management (OPM), Board and OIG officers did not receive a merit increase for 2011. The Board and OIG also froze the salary structure for all employees at 2010 levels. The OPM guidance allows for merit increases for staff that are based solely on
7The Board established the OFSPR in 2010 to develop and coordinate the staff’s work program in the area of financial stability. The office reports to the directors of the three research divisions and other directors as the Board may deem appropriate.
individual performance, and because the Board’s and OIG’s merit pay system is entirely performance based, eligible staff received merit increases that recognized their individual performance during 2010. Promotions are not affected by the new law.
Office of Inspector General
In keeping with its statutory independence, the OIG prepares its proposed budget apart from the Board’s budget. For 2011, the Board approved an operating budget of $18.0 million and a $35,000 single-year capital budget as well as an increase of $50,000 in the multiyear capital budget for the OIG. This represents a net decrease of $1.2 million (a 6.3 percent reduction) from the 2010 initial operating budget. The reduction is realized by reducing the contractual professional services budget by $4.5 million, partially offset by an increase of $2.4 million in salaries. The growth in salaries is mostly to fund the OIG’s increase in staffing to provide appropriate oversight and to conduct legislatively mandated and discretionary audits, investigations, inspections, and other reviews of Board and Consumer Financial Protection Bureau (CFPB) programs and activities.8
8Title X of the Dodd-Frank Act established the CFPB, which will regulate consumer financial products and services in compliance with federal law. The new bureau will be an autonomous
Table 4. Operating expenses and capital expenditures of the Board of Governors, 2008–11
Millions of dollars, except as noted
Operational area or Office of Inspector General 2008–09
1 (budgeted) 2008–09 (actual) 20102 (budgeted) 2010 (actual) 2011 (budgeted)
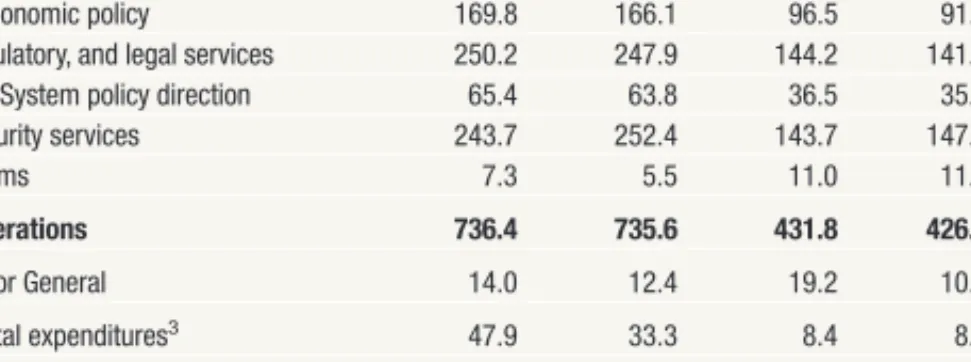
Monetary and economic policy 169.8 166.1 96.5 91.9 107.0 Supervisory, regulatory, and legal services 250.2 247.9 144.2 141.1 156.5 Federal Reserve System policy direction 65.4 63.8 36.5 35.0 38.8 Support and security services 243.7 252.4 143.7 147.8 172.9
Extraordinary items 7.3 5.5 11.0 11.1 0.5
Total, Board operations 736.4 735.6 431.8 426.8 475.6
Office of Inspector General 14.0 12.4 19.2 10.6 18.0
Single-year capital expenditures3 47.9 33.3 8.4 8.2 5.5
Multiyear capital projects4
. . . 16.5 5.2 19.7
Note: Components may not sum to totals and may not yield percentages shown because of rounding.
1
2008–09 budgeted figures include $30.1 million and $1.3 million added to the Board’s and the OIG’s respective operating budgets during 2009.
2
During 2010, the Board approved a $6.9 million increase in the Board’s initial operating budget of $444.2 million, a $0.8 million increase for the Board’s single-year capital budget, a $0.1 million increase in the Board’s multiyear capital budget, and a $0.4 million increase in the OIG’s multiyear budget.
3Beginning in 2010, the Board began budgeting and reporting projects that span multiple budget cycles separate from
single-year capital expenses. Capital, as shown in this report, includes the Board and OIG capital budgets.
4Budget figures for multiyear capital projects represent annual changes to total project budgets. As of year-end 2010,
budgets for multiyear capital projects totaled $39.2 million. Project spending to-date totaled $12.8 million, of which $5.2 million was spent in 2010.
Authorized Positions
The Board’s 2011 budget includes 2,331 authorized positions (table 5). This represents a 5.5 percent increase over current total authorized positions and a 6.4 percent increase over the authorized positions at the beginning of 2010.9
The proposed increase includes an addition of 146 new positions for 10 divisions and offices, partially offset by a decrease of 25 positions expected to be transferred to the CFPB in 2011. Forty-six of the total requested
positions, representing 38 percent of the net increase, are needed to implement requirements of the Dodd-Frank Act; other needs include implementing lessons learned from the financial crisis and meeting infrastructure-related requirements. The OIG’s 2011 budget includes 85 authorized positions. This figure reflects an increase of 20 positions to conduct the activities mentioned above.
Areas of Risk
Risks to the budget for the coming year stem from the Board’s ability to attract and retain qualified staff to meet the challenges created by passage of the Dodd-Frank Act and continue to meet demands of ongoing work requirements. The Board will be challenged to hire staff in increasingly competitive markets in the federal and private sectors, as well as academia, and the Board will need to act quickly to recruit the most qualified
applicants. Divisions and offices will also be challenged to effectively absorb a
entity within the Federal Reserve System, and will operate independently of the Board and other federal agencies. The Dodd-Frank Act designates the Board’s OIG as the OIG for the CFPB.
9During 2010, the Board added 20 positions to meet workload requirements, including the creation of the OFSPR.
Table 5. Positions authorized at the Board of Governors, 2008–11
Operational area or Office of Inspector General
Position count1
2008–09
(budgeted) 2008–09(ending) (budgeted)2010 (ending)2010 (budgeted)2011
Monetary and economic policy 481 493 506 526 572
Supervisory, regulatory, and legal services 576 615 627 627 668
Federal Reserve System policy direction 179 185 187 187 189
Support and security services2 805 873 870 870 902
Total, Board operations 2,041 2,166 2,190 2,210 2,331
Office of Inspector General 37 45 61 65 85
Note: Includes only those divisions, offices, and special accounts that have authorized position counts.
1Interns are not included in the numbers for positions or employment. 2
The count (ending) includes positions that provide reimbursable support to other agencies, such as the Federal Financial Institutions Examination Council; positions for cooperative education, worker trainee, and student aide programs that assist divisions Boardwide; and law enforcement personnel.
large number of positions in a short time period. For staff who have worked long hours dealing with the financial crisis and must now take on the added requirements of the Dodd-Frank Act, work-life balance may become an issue. In addition, despite the strategic planning group’s best efforts, it is uncertain whether the proposed initiatives will provide sufficient growth in personnel, technology, space, and other infrastructure support to supply the resources necessary for the Board’s increased responsibilities. There is also uncertainty about the impact that external audits and reviews may have on the Board and the System.
2010 Budget Performance
Board of Governors
The Board ended 2010 with expenses that totaled less than its operating plan by $5.0 million.10The Board’s capital spending for 2010 single-year capital
was also less than its operating plan, and multiyear capital projects remained within their project life budgets.
The Board’s expenses for salaries and benefits exceeded the operating plan for the year by $2.3 million, or 0.7 percent. Retirement and insurance costs were underspent by $1.5 million and $1.3 million, respectively.
Expenses for goods and services were less than the operating plan by $7.4 million, or 6.3 percent, for the year, mainly attributable to the following line items: contractual professional services spending was below anticipated needs because of delayed or deferred projects and lower-than-budgeted audit costs for the Reserve Banks’ external audits; software costs were underspent due to delays in software purchases; subsidies and contributions were underspent because payments did not occur as planned; repairs and alterations were underspent due to the timing of new building project costs; tuition costs were underspent mainly because the demand for academic assistance was lower than expected; and the “All other” account was underspent due to lower-than-anticipated reimbursements to participants in the Board’s Transportation Subsidy Program.
The Board’s 2010 single-year capital purchases totaled less than the operating plan by $0.2 million. The Board’s underspending is due primarily to project delays and several projects coming in under budgeted expectations. As of
10The operating plan reflects budgetary changes made during the year. During 2010, the Board approved a $6.9 million, or 1.6 percent, increase in the Board’s initial operating budget of $444.2 million; a $0.8 million increase for the Board’s single-year capital budget; and a $0.1 million increase for the Board’s multiyear capital budget. Personnel services comprised $5.2 million of the increase, due primarily to lower-than-expected vacancy rates. Budget increases for goods and services were mainly for additional international travel and repairs and maintenance; these increases were partially offset by lower-than-expected spending for furniture and equipment and other accounts.
year-end 2010, budgets for multiyear capital projects for the Board and OIG totaled $39.2 million. Project spending to-date totaled $12.8 million, of which $5.2 million was spent in 2010. All multiyear capital projects are still in process and are expected to be completed within their budgeted amounts.
Office of Inspector General
The OIG’s operating expenses for 2010 totaled $10.6 million, or $8.6 million less than the $19.2 million operating budget. The variance was mainly due to lower-than-expected contractual professional service expenses for conducting mandated material loss reviews. The number of state member banks that failed in 2010 was significantly less than projected, and in July 2010, the Dodd-Frank Act raised the threshold requirement for when the OIG must conduct material loss reviews of state member banks, further reducing the number of reviews the OIG was required to conduct. In addition, personnel expenses were less than the operating plan due to a longer-than-anticipated time frame to recruit and hire well-qualified staff in a highly competitive environment.
Federal Reserve Bank Budgets
The 2011 operating budgets of the 12 Reserve Banks total $3,351.2 million.11
The 2011 total is $168.2 million, or 5.3 percent, above 2010 actual expenses. This growth is driven by increases in central bank functions, specifically those related to supervision and regulation and the open market operation in New York. The implementation of the Dodd-Frank Act accounts for a significant portion of the budget growth. These increases are partially offset by
decreases in priced services as a result of continued declines in paper-check volume and the full-year effect of consolidations. In addition, the expense increase is further offset by a reduction in vendor fees and staffing related to closing most of the liquidity facilities at the New York Federal Reserve Bank.
Budgeted net expenses for 2011, after revenue and reimbursements, are expected to increase by $209.7 million, or 9.7 percent, over 2010 actual net expenses (table 6). Approximately 30 percent of Reserve Bank expenses in the
11These expenses include those budgeted by the Federal Reserve Information Technology and the Office of Employee Benefits that are chargeable to the Reserve Banks. Expenses exclude assessments for the Board of Governors operating expenses, the cost of currency, the CFPB, and the Office of Financial Research.
Table 6. Operating expenses of the Federal Reserve Banks, net of receipts and claims for reimbursement, 2010 and 2011
Millions of dollars, except as noted
Item (actual)2010 (budgeted)2011
Change Amount Percent
Total operating expenses 3,183.0 3,351.2 168.2 5.3
Less
Revenue from priced services 574.7 497.2 −77.5 −13.5
Claims for reimbursement1 456.4 492.2 35.8 7.8
Other income 1.5 1.7 0.2 14.5
Equals
Net expenses 2,150.5 2,360.1 209.7 9.7
Note: Excludes capital outlays. Includes expenses budgeted by the Federal Reserve Information Technology and Office of Employee Benefits. Expenses from these entities have been charged to the Reserve Banks, as appropriate, and included in their budgets. Components may not sum to totals and may not yield percentages shown because of rounding. Operating expenses reflect redistributions for support and allocation of overhead.
1
Costs of fiscal agency and depository services provided to the U.S. Treasury, other government agencies, and other fiscal principals that are billed to these agencies.
2011 budget are offset by priced service revenues (15 percent) and
reimbursable claims for services provided to the Treasury and other agencies (15 percent).12Budgeted 2011 priced services revenue is lower than the 2010
actual level, primarily because of declining paper-check volume. Reim-bursable claims are projected to increase in 2011, reflecting increased activity on key programs and support for new initiatives.
Total 2011 projected employment for the Reserve Banks, Federal Reserve Information Technology (FRIT), and the Office of Employee Benefits (OEB) is 17,979 average number of personnel (ANP), an increase of 520 ANP, or 3.0 percent, from the 2010 actual staff level (table 7).13The 2011 staffing
increase is the result of resources added for supervision and regulation and New York monetary policy operations to address continuing adverse banking conditions, implement lessons learned from the financial crisis, and Dodd-Frank Act responsibilities. Also contributing to the increase is additional staffing in Treasury services due to increased activity on key Treasury projects. The 2011 budgeted staff additions are partially offset due to paper-check volume declines and the continued effect of check operation consolidations.
2010 Budget Performance
Total 2010 actual expenses were $3,183.0 million, a decrease of $38.3 million, or 1.2 percent, from the approved 2010 budget of $3,221.3 million. Total 2010 actual staffing is 17,459 ANP, a decrease of 119 ANP from the 2010 budgeted level of 17,578 ANP.
The expense decrease is driven by the earlier-than-expected System completion of a multiyear effort to consolidate check operations to one
12Reimbursable claims include costs of fiscal agency and depository services provided to the U.S. Treasury, other government agencies, and other fiscal principals that are billed to and reimbursed by these agencies.
13ANP is the average number of employees in terms of full-time positions for the period. For instance, a full-time employee who works one-half of the year counts as 0.5 ANP for that calendar year; two half-time employees who work the full year count as 1 ANP.
Table 7. Employment at the Federal Reserve Banks, FRIT, and OEB, 2010 and 2011 Average number of personnel, except as noted
Item 2010 (actual) 2011 (budgeted) Change Amount Percent Reserve Banks 16,467 16,965 498 3.0
Federal Reserve Information Technology (FRIT) 946 965 19 2.0
Office of Employee Benefits (OEB) 46 49 3 6.5
Total 17,459 17,979 520 3.0
Note: Components may not sum to totals and may not yield percentages shown because of rounding. See text note 13 for definition of average number of personnel (ANP).
full-service paper-check processing site and one electronic check processing site. The paper-check transition was completed in the first quarter of 2010, and the electronic check transition was completed in the fourth quarter of 2010. Significant expense reductions were also achieved in the check adjustments function and check transportation services as a result of declines in paper-check volume.
Also contributing to the underrun is lower expenses for Treasury services ($11.0 million). Treasury services were under budget largely because of reduced volume for Treasury retail securities and a reduction in expenses related to Treasury Web Application Infrastructure (TWAI).
Partially offsetting the underrun are increased expenses in supervision and regulation driven by expanded responsibilities to address the continuing adverse conditions in community and regional banking portfolios, as well as additional staffing to strengthen supervision of the largest institutions, associated macroprudential efforts, and enhanced operating procedures ($17.7 million).
The underrun in total staffing of 119 ANP, as compared with the approved budget, reflects the significant decline in check operations (122 ANP). Local support functions continue to experience decreases in staffing as operations are streamlined and consolidated (67 ANP). Treasury services are below budget 39 ANP, primarily due to volume declines in Treasury retail securities. Offsetting these underruns are increased staffing in the supervision and regulation function due to current banking conditions (56 ANP) and at FRIT, primarily to support the System’s server consolidation initiative (42 ANP).
Initiatives Affecting the 2011 Budget
For 2011, the Reserve Banks’ budgets reflect growth in several initiatives that will continue to address financial stability and enhanced resiliency, as well as new initiatives related to implementing the expanded responsibilities required by the Dodd-Frank Act.
Central Bank Services
In the central bank area, which includes monetary policy, public programs, supervision and regulation, and services to financial institutions and the public (other than priced services), expenses are increasing $180.0 million, or 7.9 percent, in the 2011 budget. The staffing level is increasing 408 ANP, primarily in supervision and regulation and in the monetary policy execution function in New York. These increases are being offset by nonrecurring crisis-related expenses in the loans to depository institutions and others function.
The budget for the supervision and regulation function is increasing $132.3 million, or 16.5 percent, and staffing is increasing 345 ANP, as the function plans for additional staffing resources to continue to address the adverse conditions in the banking industry and to implement the
requirements of the Dodd-Frank Act. The total costs for monetary policy are increasing $40.7 million, or 8.2 percent, over 2010 actual expenses. The growth is primarily in the open market operations and is due to the need for additional staff to apply lessons learned as a result of the financial crisis and operational reviews, fulfill Dodd-Frank Act requirements, and strengthen market monitoring.
Expenses in cash operations are increasing $4.8 million, or 0.9 percent, remaining fairly stable as increased benefits and equipment expenses are offset by the nonrecurrence of a one-time write-off related to the cash automation strategy that occurred in 2010.14
Treasury-Related Functions
The budget for services to the Treasury, which are fully reimbursable, is increasing $37.7 million, or 8.7 percent, primarily due to costs associated with the expansion of the GoDirect call center and the stored value card (SVC) project, as well as increased costs for the TWAI and Collections and Cash Management Modernization (CCMM) implementation.15Also
contributing to the increase is severance expense related to the planned consolidation of Treasury retail securities operation.
Priced Services
Total priced services expenses are declining $49.5 million, driven by a decrease of $50.5 million, or 18.7 percent, in check expenses, which reflects the check restructuring costs and continued paper-check volume declines. In 2010 the System completed a multiyear effort to consolidate check operations to one full-service paper-check processing site and one electronic check processing site. In addition to the consolidations, significant reductions in the check adjustments function and check transportation services were also
14Reserve Banks continue to develop a new cash automation platform that will enhance controls of the Banks’ cash operations and improve their efficiency, provide a responsive management information reporting system with superior and flexible reporting tools, facilitate business continuity and contingency planning, and enhance the support provided to Reserve Bank customers and business partners. In 2010, the Banks terminated the development contract with the primary vendor and redefined the design for the new system (now known as CashForward).
15CCMM is a comprehensive multiyear enterprise architecture initiative to streamline, modernize, and improve the services, systems, and processes supporting the Treasury’s collections and cash-management programs. The goal is to improve efficiency and reduce costs to the Treasury, which provides a savings to the taxpayers.
achieved as a result of declines in paper-check volume. All priced services are projecting full cost recovery in 2011.
Support Services
Support costs are increasing $30.5 million, or 3.0 percent, and 13 ANP. The expense increases are driven primarily by increases in facilities management ($15.8 million) and information technology ($4.3 million). Facilities costs are increasing mainly as a result of reconfiguring space in New York and Dallas to accommodate new functions and staff. IT costs are increasing in support of cash, Treasury, and priced services projects at several Reserve Banks.
Five-Year Trend in Reserve Bank Expenses
Total expenses for the Reserve Banks have grown an average of 3.8 percent annually from 2006 to 2011.
Central Bank Services
Central bank services have grown an average of 9.4 percent annually over the past five years. The increase is primarily in the areas of supervision and regulation, monetary policy, and loans to depository institutions and others, where expenses have grown, on average, 12.4 percent annually. Expenses in the supervision and regulation function have grown an average of 11.2 percent annually over the past five years, and staffing has increased by 740 ANP due to the need to recruit and retain supervisory staff with specialized skills to address financial market turmoil and declining banking conditions, as well as to address Dodd-Frank Act requirements. The increase in monetary policy, where expenses have grown on average 11.0 percent, is driven by increased resources dedicated to regional economic research and economic policy operations. Expenses in loans to depository and others have grown at an average annual rate of 31.5 percent over the past five years due to an increase in resources to support the emergency liquidity programs and other lending activities during the financial crisis.16Expenses associated with
these loan activities peaked in 2010 and are projected to decline in 2011. There have been ongoing efficiency improvements in the cash area over the past five years; however, expenses in cash operations have increased an average of 5.8 percent annually, reflecting increased costs to modernize the
16Although some of the liquidity programs ended in February 2010, New York continues to support several liquidity programs, including Maiden Lane, Maiden Lane II, Maiden Lane III, and TALF. Over time, expenses associated with these programs will continue to diminish. In addition, the higher expenses reflect an increase in activities related to assessing value and margining collateral pledged to the Reserve Banks and steps that New York, in particular, took structurally to manage more effectively its risk. These expenses are not likely to decrease over time and reflect additional ongoing activities.
cash-processing and inventory-tracking infrastructure, along with higher support costs, particularly facilities and protection costs.
Treasury Services
Treasury services expenses have grown, on average, 3.1 percent annually since 2006. The increase in Treasury services reflects the expansion of the
GoDirect call center and SVC programs, increased costs for the TWAI and Collections and Cash Management Modernization implementation, and other requested projects.
Priced Services
Priced services expenses have declined an average of 12.2 percent annually over the past five years, driven by reductions in the check service. Continued efforts to downsize the System’s paper-check operations, consistent with volume declines, have resulted in an average annual decline of 18.6 percent in check-service costs since 2006.
2011 Personnel Expenses
On December 22, 2010, President Obama signed legislation prohibiting statutory pay adjustments for most federal civilian employees. Although not required to do so under the legislation, the Federal Reserve believes that the entire System should comply with the spirit of the civilian federal
government salary freeze, given its important public mission. Therefore, the Reserve Bank budgets reflect a 2.0 percent program for merit and equity adjustments for eligible employees. The System believes that this program complies with the spirit of the civilian federal government salary freeze as enacted by Congress, which allows for increases under performance-based compensation systems such as those used by the Reserve Banks. The 2011 Reserve Bank budgets provide no funding for increases in officer and senior professional base salaries, other than funding for promotions.
Budgeted officer and employee salaries and other personnel expenses for 2011 total $1,770.0 million, an increase of $89.6 million, or 5.3 percent, compared with 2010 actual expenses. The increase reflects increased staffing levels and budgeted salary administration programs, including merit increases, market adjustments, promotions, and variable pay. Funding for employee base-salary administration programs totals $30.9 million; merit and equity pools for employees total $23.3 million; and funding for employee promotions totals $7.6 million. The budget includes $1.7 million for officer promotions.
Risks in the 2011 Budget
The primary 2011 budget risk relates to the Reserve Banks’ implementation of the Dodd-Frank Act. Changes resulting from the act will directly affect roles and responsibilities in multiple areas of the Federal Reserve Banks, especially in the supervision and regulation function. The increase in resources to meet these new responsibilities continues to be evaluated by the Banks to assess staff levels necessary to manage the ongoing challenges in the financial industry.
Treasury project changes could also increase expenses. The Treasury
continues to refine its vision for collections and cash management systems. If the Treasury changes its current direction for the CCMM initiative,
additional costs and resources may be required. Other risks include actuarial and legislative changes that make it difficult to predict future employee and retiree health care costs.17
2011 Capital Plan
The 2011 capital budget submitted by the Reserve Banks, FRIT, and OEB totals $417.6 million, a $121.4 million, or 41.0 percent, increase from the 2010 actual levels. The variance reflects project delays in New York, resulting in a shift in the timing of outlays from 2010 to 2011. The capital budget includes funding for projects to support strategies that improve operational efficiencies, enhance services to Bank customers, and ensure a safe and productive work environment. In support of these strategies, the 2011 budget identifies three categories of capital initiatives: building and infrastructure, information technology and System automation projects, and Treasury initiatives.
The proposed capital budget includes $208.8 million for building and infrastructure projects. Of the total building capital, $58.9 million is related to major projects begun in previous years in Boston, New York, and St. Louis. Major new initiatives in 2011 totaling $15.5 million include an expansion of office space for supervision staff in Chicago and office
refurbishments in San Francisco. The remaining outlays in this category will fund other building renovation and refurbishment projects, security
enhancements, and various facility improvement projects.
The Reserve Banks and FRIT included $163.3 million in funding for major information technology initiatives and System automation projects.
Multiyear projects to migrate major applications off the mainframe represent
17Risks include compliance with FAS 106; the volatility in retiree health care, long-term disability, and survivor income costs based on claims experience; participation changes; and interest rate changes. In addition, there is uncertainty about how the enactment of the Patient Protection and Affordable Health Care Act will affect the cost of medical services.
$33.9 million of the 2011 capital budget.18The System server consolidation
effort accounts for an additional $22.5 million. Cash services initiatives represent $20.2 million of the total capital budget, including $10.2 million for the CashForward development effort. The remaining outlays will fund numerous smaller initiatives, such as scheduled software and equipment upgrades as well as telecommunications and LAN equipment for renovated or expanded office space.
The capital budget also includes $45.5 million for reimbursable Treasury initiatives, including support of TWAI, Government-Wide Accounting, CCMM-related efforts, and various other projects.
18The System’s migration strategy will involve moving a majority of applications from the mainframe to alternate processing environments over the next few years. Projects in the 2011 budget include the migration of the Fedwire, FedACH, check, and accounting systems.
Currency Budget
Each year, under authority delegated by the Board, the director of the Division of Reserve Bank Operations and Payment Systems orders new currency from the U.S. Department of the Treasury’s Bureau of Engraving and Printing (BEP). Upon reviewing the order, the BEP establishes billing rates for new currency, which the Board staff uses to prepare the annual budget for new currency. Each month, the Board assesses the costs of new currency to each Federal Reserve Bank through an accounting procedure similar to that used in assessing the costs of the Board’s operating expenses to the Banks. Total new currency expenses for 2010 were under budget by $80.1 million, or 11.4 percent, primarily because the BEP printed fewer notes than budgeted.
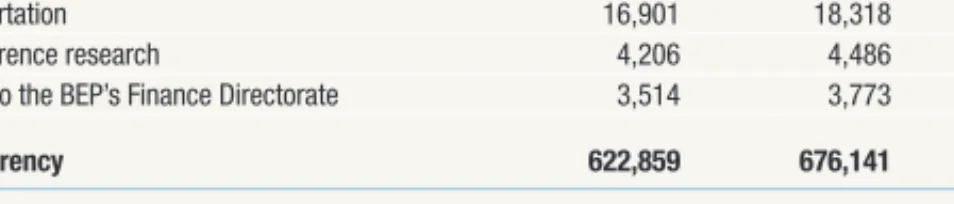
The approved 2011 new currency budget of $676.1 million is 8.6 percent higher than 2010 costs (figure 5). Printing costs for Federal Reserve notes represent 96 percent of the new currency budget, and expenses for currency transportation, counterfeit-deterrence research, and the BEP’s Finance Directorate operations account for the remaining 4 percent (table 8).
Figure 5. Federal Reserve costs for new currency, 1997–2011
Note: For 2011, budgeted.
1997 1999 2001 2003 2005 2007 2009 2011 700 600 500 400 300 200 100 0 Millions of dollars 1997 1999 2001 2003 2005 2007 2009 2011 700 600 500 400 300 200 100 0 Millions of dollars 27
Printing of Federal Reserve Notes
The cost for printing the calendar-year 2011 currency order is budgeted at $649.6 million, an 8.6 percent increase over the cost for the 2010 order. The average cost per thousand notes increased 6.2 percent, from $89.75 in 2010 to $95.51 in 2011 (table 9), primarily because high fixed costs at the BEP are allocated among fewer notes than last year.
Although the Board ordered 7.6 billion notes in FY 2011, the BEP based its pricing on annual production of only 6.8 billion notes. To meet the Board’s order, the BEP expects to process a portion of the 1.1 billion new-design $100 notes produced and held for quality concerns during FY 2010 and reclaim nearly 800 million notes.19Over the next several years, the BEP expects to
sort the remaining notes on hold and reclaim additional notes that meet quality standards.
19In mid-2010, the BEP discovered sporadic creasing of the currency paper during high-pressure, intaglio printing. Because of the difficulty in detecting the problem, the BEP had produced approximately 1.1 billion new-design $100 notes, a portion of which might include creasing. The BEP is researching equipment to reclaim notes that meet the Board’s quality standards and sort out those that do not. The BEP will not charge the Board for any Table 8. Federal Reserve budget for new currency, 2010 and 2011
Thousands of dollars, except as noted
Item 2010 (actual) 2011 (budgeted) Percent change
Printing of new Federal Reserve notes1 598,239 649,565 8.6
Currency transportation 16,901 18,318 8.4
Counterfeit-deterrence research 4,206 4,486 6.7
Reimbursement to the BEP’s Finance Directorate 3,514 3,773 7.4
Total cost of currency 622,859 676,141 8.6
1Includes expenses for other currency-related initiatives.
Table 9. Projected Federal Reserve costs of printing new notes, by type of note, 2011 Type of currency Number of notes(millions) Percentage oftotal notes Cost per thousandnotes (dollars) (thousands of dollars)Total cost
Unthreaded ($1, $2) 2,610.7 38.5 55.49 144,866 Series 1996 ($100) 499.2 7.4 98.60 49,221 Series 2004 $5 646.7 9.5 99.28 64,204 $10 187.6 2.8 99.18 18,609 $20, $50 1,125.1 16.6 108.91 122,531 $100 1,718.5 25.3 144.80 248,834 Average cost … … 95.51 … Total 6,787.7 100.0 … 648,265 …Not applicable.
Currency Transportation
The 2011 currency transportation budget is $18.3 million, which includes the costs of shipping new currency from the BEP to the Reserve Banks, of shipping fit and unprocessed currency between Reserve Banks, and of returning currency pallets to the BEP.
The 2011 budget for currency transportation increased 8.4 percent from 2010 costs, primarily because armored carrier contract rates are expected to increase 5.0 percent in 2011. In addition, the Board included funding to begin shipping new-design $100 notes to every Reserve Bank to build sufficient inventories before issuance.
Counterfeit-Deterrence Research
The 2011 budget for counterfeit-deterrence research is $4.5 million, which includes costs associated with the Central Bank Counterfeit Deterrence Group (CBCDG) and the Reprographic Research Center (RRC). The CBCDG operates under the auspices of the G-10 central bank governors to combat digital counterfeiting and includes 32 central banks. The Board’s $4.5 million share of the 2011 CBCDG budget comprises 99 percent of the Federal Reserve’s counterfeit-deterrence budget and is $225,000 higher than the 2010 costs.20
Bureau of Engraving and Printing Finance Directorate
The 2011 budget includes $3.8 million to reimburse the BEP for expenses incurred by its Destruction Standards and Compliance Division of the Office of Compliance (OC) and Mutilated Currency Division of the Office of Financial Management (OFM). The OC develops standards for Reserve Banks in the cancellation and destruction of unfit currency and for note accountability, and reviews Reserve Banks’ cash operations for compliance with its standards. As a public service, the OFM processes claims for the redemption of damaged or mutilated paper currency.reclaimed notes because the BEP assessed the Board a surcharge in 2010 that covered the cost of production. Similarly, the BEP will not issue a credit for any notes that do not meet quality standards.
20The estimated RRC payment of $32,200 represents the remaining 1 percent of the counterfeit-deterrence research budget. The RRC is a state-of-the-art facility, hosted by the National Bank of Denmark, that is used for adversarial testing of banknote designs and counterfeit deterrent features for its 13 member countries.
Appendix A
Federal Reserve Budget Processes
The budgets for the Board of Governors, the Federal Reserve Banks, and currency are separate, and each has its own budget process.
Board of Governors
The Board’s budget covers one calendar year, and the budget process is as follows:
• The Board’s budget is structured by division, office, or special account (see appendix C,table C.1, on page 37).
• The Board establishes a base budget to support current operations. • Each division identifies new initiatives and savings required to achieve its
objectives for the next budget cycle.
• The Board’s Strategic Planning Group (SPG), a committee of senior officers representing major lines of business, evaluates each new initiative and proposed savings in the context of the Board’s, as well as the division’s, mission.
• The proposed budget is submitted to the Committee on Board Affairs (CBA). The CBA submits the budget to the Board for review and final action.
• Monthly expenses are compared with budgets by division and accounting classification. Variances are analyzed and reported.
The Board’s Office of Inspector General (OIG), in keeping with its statutory independence, prepares its proposed budget apart from the Board’s budget. The OIG presents its budget directly to the Chairman for action by the Board.
Federal Reserve Banks
The Reserve Banks’ budgets cover one calendar year. Annually, each Reserve Bank establishes major operating goals for the coming year, devises strategies for attaining those goals, estimates required resources, and monitors results. The Reserve Banks’ budgets are structured by operational area, with support and overhead attributable to each area charged to that area.
The operations and financial performance of the Reserve Banks are monitored throughout the year by way of a cost-accounting system, the Planning and Control System (PACS). Under PACS, the costs of all Reserve Bank functions are grouped by operational area, and the associated costs of support and overhead are charged to these areas accordingly. PACS makes it possible to compare budgets with actual expenses, and it facilitates
comparison of the financial and operating performances of the Reserve Banks. During the budget year, the Reserve Banks must submit proposals for major capital acquisitions and capitalized projects to the Board for further review and approval.
Following is a summary of the Reserve Bank budget process:
• The business leaders in each functional area provide budget guidance to the Reserve Banks for the upcoming year.
• The Reserve Banks develop early budget projections that incorporate the business leader guidance. The budgets are reviewed by the Reserve Banks for consistency with the System direction and further refined to reflect business direction.
• The Reserve Banks submit preliminary budget information to the Board for review, including documentation to support the budget request. • Board staff analyzes the Banks’ budgets, both individually and in the
context of Systemwide initiatives and other Banks’ plans.
• The Committee on Federal Reserve Bank Affairs reviews the Bank budgets. • The Reserve Banks make any requested or needed changes to the budgets,
and the revised projections are submitted to the Board.
• The budgets are provided to the members of the Board for final action. • Throughout the year, Reserve Bank and Board staff compare actual
performance to budgeted projections.
Currency
The currency budget covers one calendar year. On a monthly basis, Board staff monitors payments of currency to and receipts of currency from circulation and the number of unfit notes destroyed at the Reserve Banks. Board staff estimates the number of notes the Board will order from the Bureau of Engraving and Printing (BEP) to meet demand based on monthly monitoring, forecasts of growth rates for payments of currency to circulation and receipts of currency from circulation, operational factors, and other policy considerations. Historically, over 90 percent of the notes that the Board orders each year replace unfit currency that Reserve Banks receive from circulation.
The currency budget process is as follows:
• Each July, based on Board staff’s assessment of currency demand, the director of the Division of Reserve Bank Operations and Payment Systems submits a fiscal year print order for currency to the director of the BEP. • Each November, Board staff estimates expenses for the currency budget,
including printing expenses (based on billing rates provided by the BEP), currency transportation expenses, counterfeit-deterrence research expenses, BEP’s Finance Directorate operations expenses, and estimated expenses for other currency-related initiatives.
• The Committee on Federal Reserve Bank Affairs reviews the proposed currency budget.
• Staff submits the proposed currency budget to the Board for final action. • On a monthly basis, Board staff monitors expenses and compares these
expenses to the budget.