AndWellness: An Open Mobile System for Activity and
Experience Sampling
John Hicks, Nithya Ramanathan, Donnie Kim, Mohamad Monibi,
Joshua Selsky, Mark Hansen
†, Deborah Estrin
UCLA CSD, UCLA Stats†
[email protected], {nithya, dhjkim, destrin}@cs.ucla.edu,
{mmonibi, selsky}@cens.ucla.edu, [email protected]
†ABSTRACT
Advances in mobile phone technology have allowed phones to become a convenient platform for real-time assessment of a participants health and behavior. AndWellness, a per-sonal data collection system, uses mobile phones to collect and analyze data from both active, triggered user experi-ence samples and passive logging of onboard environmental sensors. The system includes an application that runs on Android based mobile phones, server software that manages deployments and acts as a central repository for data, and a dashboard front end for both participants and researchers to visualize incoming data in real-time. Our system has gone through testing by researchers in preparation for de-ployment with participants, and we describe an initial qual-itative study plus several planned future studies to demon-strate how our system can be used to better understand a user’s health related habits and observations.
Categories and Subject Descriptors
H.1.2 [Information Systems]: User/Machine Systems – Human Factors; H.4 [Information Systems Applications]: Miscellaneous; H.5.2 [User Interfaces]: Evaluation/Meth-odology, User Centered Design; J.4 [Social and Behavo-rial Sciences]: Psychology
General Terms
Design, Experimentation, Measurement
Keywords
Experience Sampling Method (ESM), In Situ Data Collec-tion, Mobile Computing, Wireless Health Monitoring, Sys-tem Architecture
1.
INTRODUCTION
Various fields are currently developing robust personal data collection tools to measure everything from the
tim-Permission to make digital or hard copies of all or part of this work for personal or classroom use is granted without fee provided that copies are not made or distributed for profit or commercial advantage and that copies bear this notice and the full citation on the first page. To copy otherwise, to republish, to post on servers or to redistribute to lists, requires prior specific permission and/or a fee.
Wireless Health ’10,October 5-7, 2010, San Diego, USA Copyright 2010 ACM 978-1-60558-989-3 ...$10.00.
ing of plants blooming to continuous health monitoring. In the past, researchers have asked participants to recall events after the fact, used paper diaries to log events in real time, employed automated telephone systems to record data, and more recently used PDA or wireless mobile devices to log data. Their common theme is to move towards a real time or immediate assessment of human behavior and to ease the burden on participants.
Psychologists in particular have recognized the need to monitor patientsin situversus asking a participant to recall an event a week or more after the fact [4]. Previous studies show that factors can and do affect the memory of partici-pants recalling past experiences. Recall bias can be caused by the current emotional state of the participant, the length of time the participant is asked to recall, or the partici-pant sitting in a foreign environment. This bias is shown to be extremely systematic, thereby questioning the results of studies that rely solely on a participants long term memory [22]. Instead of trying to account for all of these, researchers can alleviate the issue by having participants record events as they happen or immediately thereafter.
However, these experience sampling (ES) studies come with their own set of problems. First, and most importantly, many researchers do not have the time nor resources to de-velop robust data collection systems from scratch. They have historically piggy backed on existing infrastructure such as paper diaries and landline telephone systems. Second, as researchers become more experienced with these meth-ods, they have formulated methodologies to help ensure high quality, unbiased data collection. These include measuring a participant’s timely adherence to the data collection pro-cess, the ability to configure when and why a participant is queried to collect data, and various reactivity issues to being queried at all [1].1
Data collection systems should allow the researcher enough control to account for these methodolog-ical issues.
Personal data collection systems are also used as a tool for self-management of health and other areas affecting a par-ticipant’s daily life. While similar to experience sampling studies, the area of self-management has a different empha-sis. Instead of following rigid study protocols to reduce bias and obtain clean data, the researcher and participant’s focus on examining and motivating change in various aspects of the participant’s personal health. As an example, Logan et al. implemented a phone based system to monitor the daily blood pressure of hypertensive patients [14]. These systems
1
Studies show that participants will change their behavior over time simply by being asked about it.
allow a physician to better track the daily quality of life of a patient, give reminders and intervene to keep on pa-tients on track, and motivate participants to improve their own behaviors. McDonald et al. reviewed the effectiveness of various intervention techniques and found that automated calls or other reminders are effective at increasing adherence to long-term prescription medications [15]. The studies also tend to ask for input less frequently (one a day or less), and run for longer than focused studies (six months to a year or more).
AndWellness aims to combine the usefulness of each of the above systems using modern wireless mobile phones. We hope to reduce the barrier of entry for researchers or others who want to study individuals or populationsin situ. The system collects standard data such as survey responses along with contextual data such as images and continuous sensor readings. We take advantage of the flexibility of phones by implementing more complex behaviors to reduce participant burden such as: contextual triggers to avoid bothering par-ticipants at inopportune times, survey configuration such as branching to avoid asking redundant or useless questions, and sampling onboard sensors such as GPS to collect con-tinuous data without interrupting the participant.
AndWellness can be configured with surveys that are trig-gered to remind the participant to respond on a regular basis and includes all the features that have been found to increase adherence such as branching to reduce the number of ques-tions the participant must answer, per participant configu-ration, and real-time feedback from responses. Researchers immediately know if a participant is failing to adhere to the study and can contact them for followup. This focus on adherence and quality of responses from non-technical par-ticipants sets AndWellness apart from other open source and commercial data collection systems.
2.
SYSTEM OVERVIEW
AndWellness contains three subsystems: an application to collect data on an Android mobile device, a server to configure studies and store collected data, and a dashboard to display participants’ statistics and data. The usage of our system follows the paradigm of prompting participants on their mobile device to answer surveys at configured intervals, then uploading the responses wirelessly to a central server. The responses are parsed into a central database and can be viewed by both the researchers and participants in real-time.
2.1
Components
The end-to-end data collection system also contains three main components: campaigns,sensors, and triggers. These are defined here and appear throughout our discussion of the AndWellness system.
2.1.1
Campaigns
Studies can be defined as a campaign which contains a number of surveys, data collection types, and other param-eters. Each campaign can be assigned any number of users, who have roles such as administrator, who can design and edit the campaign, researcher, who can visualize all users data and other statistics from the campaign, orparticipant, who can upload data but only view their own data and statistics. Campaigns contain surveys and other continu-ous data collection types orsensors. Surveys are a list of
prompts to query participants about their daily behaviors,
habits, and emotions, while sensors continuously sample and do not require participant interaction. Questions are defined by thequestion text, which will be displayed to the user, and adata type, which defines the correct format for the question response.
Many common data types are in place for typical survey responses such as military time, integer range (e.g., rating on a scale from x to y), and multiple response (e.g., check one or more boxes). These question and data type pairs are rigorously defined to allows precise error checking on incoming data, easy recording and processing of the data, and automatic generation of the visual aspect of surveys on the mobile devices and visualizations on the dashboard.
2.1.2
Sensors
Sensors allow the researcher to collect continuous data from a participant. Sensors can be sampled at any reso-lution and provide finer grained detail than prompting the participant for manual data entries. However, sensors tend to consume more battery power than surveys and can only collect certain contextual data. AndWellness currently in-cludes two sensors: location traces and activity inference. Additional sensors, such as any number of wireless blue-tooth devices, can be defined as a new data type and added to the mobile device and data collection system.
Location traces use the GPS to track the user’s current location and the sampling rate is configurable to balance power consumption versus resolution. Perhaps more inter-esting is the activity inference, which attempts to automat-ically infer the user’s actions, including whether the partic-ipant is still, walking, running, biking, or driving. The sen-sor reads from both the GPS and the accelerometer and uses clustering techniques that run on the phone itself. Hence the raw accelerometer data is condensed down to a simple ac-tivity state, which takes up much less bandwidth and space.
2.1.3
Triggers
Triggersprovide an expressive way to prompt participants by launching surveys based on time, location, or other con-textual clues. A researcher can attach a trigger to each survey defined in a campaign. Triggers are set to launch at specific times during a day, randomly throughout a day, set to specific locations or time and location pairs, or set to any other sensor readings. The triggers can be uniform through-out a campaign or set specifically for each participant. For example, one research group currently using our system has defined a survey to query participants about their previous nights sleep. The survey trigger is initially set daily at 7 am, but can be changed if the participant typically wakes at a different time.
When triggers go off, they send a notification to the An-droid OS. These cause the phone to vibrate and a subtle message to display on the home screen. If the participant does not respond to the trigger, it will retrigger after 5 min-utes, 15 minmin-utes, and be cleared after one hour. This pre-vents multiple notifications from building up and cluttering the notification area. The participant can either click on the notification itself to bring up the survey, or open the application and click the survey directly. Finally, each sur-vey can be set to be answerable at anytime, or only for a certain time period after the notification triggers (i.e., the surveys can be set to beexpirable). This fine control allows the targeting of either specific events, for example whenever
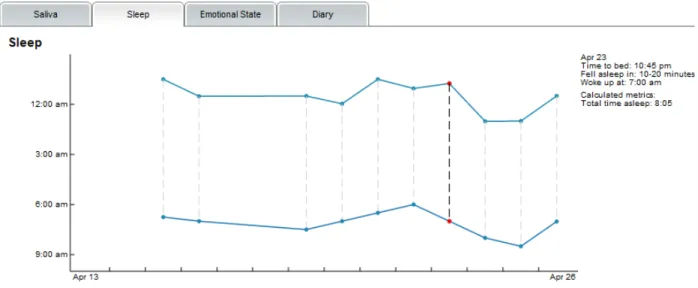
Figure 1: An example visualization showing sleep data. The sleep survey is part of our initial pilot study for Ganz and her team.
a participant craves a cigarette, or to poll periodically for in-formation, for example to determine a participant’s general fatigue level throughout the day [23].
2.2
Dashboard
While the components form the mobile application and back-end server, the final piece is the front end, a person-alized dashboard. Participants and researchers can use the dashboard to view a summary of upload statistics to quickly see that their data is being uploaded correctly. If the study is incentivized in some manner, participants can view their current progress.2
The dashboard also has a page to visualize currently up-loaded data. The same data types that are used to config-ure the campaign are downloaded from the server and used to automatically format the dashboard with default visual-izations. The visualizations are split by survey, and each survey question has its own graph type. Sensor readings also have their own meaningful visualizations. Participants are able to view collected data and have instant feedback to motivate them to both continue the study and to posi-tively change their behavior. Researchers can use the visu-alizations to identify trends and correlations in behaviors, perhaps in response to a change in medication or correlate different moods with various behaviors. An example of a visualization to show sleep data is shown in Figure 1.
Our system can also collect GPS data at regular inter-vals, thereby allowing both survey data and activity infer-ence data to be associated with location data. We have plans to provide participants with a map view for display, along with additional correlation tools to find relations between time, location, and surveys responses. For instance, perhaps the participant’s mood changes when they go to a certain location such as work in the morning, or their home at night. While these relationships can be hard to discover, previous research shows that even when handling complex human be-havior patterns, well thought out visualizations can help to
2
Various studies offer money or other incentives per survey answered to increase the response rate.
find these hidden spatial and temporal correlations [21].
2.3
Design
AndWellness has been designed with requirements for two roles: researchers looking to customize and run campaigns to collect feedback on experiences and behaviors from par-ticipants in situ, and parpar-ticipants who collect and upload data. Researchers use the system to match their individual research needs, while participants expect the mobile applica-tion to fit unobtrusively into their daily lives. For both, the system must be usable, low power, able to ensure privacy, and transparent.
2.3.1
Usability
Designing for usability translates into building an unob-trusive application on the mobile device. Whether the par-ticipant is given a phone for the study with the application already installed, or the participant installs the application on their own phone, we adhere to number of basic usability tenets to enhance participant retention. Participants will be more willing to stick with an application that does not be-come cumbersome over time, especially if they are answering multiple surveys a day. The application avoids interfering with standard phone operation and does not drain the phone battery too quickly, notify or require the participant’s atten-tion more than necessary, nor exhibit high latency during participant interaction.
The mobile application is itself easy to learn and use. Ac-tive surveys are listed on the front page and are launched with a single click. Prompts clearly state the prompt text and are answerable with two clicks: the desired response and the next button. If a participant does not desire to answer a specific survey question for any reason, they can click a skip button to move on to the next question. The prompts themselves can condition on answers to previous prompts, thereby allowing branching and reducing the potential num-ber of prompts a participant must complete. Once the sur-veys are complete they are loaded into a queue for later upload, which checks for a stable network connection every half hour and automatically uploads pending data.
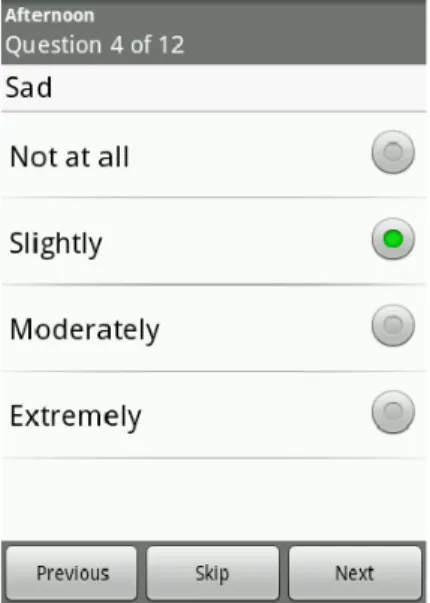
Over-Figure 2: Example of the survey selection screen from our Android application. Four surveys have been defined. The user can either wait for the spe-cific survey triggers or select a survey to take at anytime.
all, the application has been designed to require a minimum amount of interaction and to minimize interference with the user.
2.3.2
Power
To help ensure a usable experience, the phone implemen-tation has been designed to minimize interference with stan-dard phone operation, which means to exhibit low latency and, more importantly, low power drain. These goals re-quire an efficient design and consideration of CPU and bat-tery power when collecting and uploading potentially large amounts of data. A participant wants the battery to last long enough to avoid having to constantly recharge the phone which may not be possible. The irritation of a failing battery can cause participants to drop out of a study or to uninstall the application.
Our main sources of battery drain comes from continuous sensor readings, for example reading from the accelerome-ter or the GPS, and network access either over the mobile radio or wifi. Continuous sensor readings are useful as they can convey a large amount of information about a partici-pant without requiring the participartici-pants attention. However, they can both over sample from sensors and generate a large number of data points that are then sent back to the server through network access. Currently, continuous location and activity sensor have been optimized to balance battery drain with accuracy. They are tunable to allow the researcher to adjust the balance between resolution and power drain, with a default setting that presents good accuracy while using acceptable amounts of power. We have also implemented a system that scans wifi access points to determine if the participant is moving or not. If the set of nearby wifi access points does not change, the participant is assumed to be still and the system will not enable the GPS, saving a noticeable amount of power.
Figure 3: An example of a single survey question with an integer range response type. The possible responses are 0 to 4 and map to four labels which are displayed in the survey and also in the automatically generated visualizations.
2.3.3
Privacy
When enrolling in studies or deployment, participants ex-pect their data to be kept securely. A participant may be asked to submit potentially personal or private information. To protect their privacy, all data are transported using end-to-end encryption. Each response contains the user’s cre-dentials and is authenticated before being stored into the database. User names are created using randomized dic-tionary strings to preserve participant anonyminity. The database itself is designed with all potentially identifiable information cordoned off into its own section. The informa-tion can be made only accessible by authorized individuals, or even permanently stripped off to remove any connection between data and user identity.
However, privacy issues go hand in hand with usability. Imagine an example scenario where a user decides to install AndWellness to collect activity traces. The user starts the application and logs in to begin collecting data. However, if the network connectivity is poor, the user credentials cannot be immediately validated. To preserve usability, the user ex-pects to start to collect data immediately without lengthy delays or latency. The phone stores the user’s login informa-tion, then uploads the data later when the login credentials are validated. Other tensions between usability and privacy include how often to make the user login, how often to vali-date with the server, and how to handle the situation where multiple users share the same phone.
2.3.4
Transparency
Wireless technology allows unprecedented transparency and engagement to the data collection process not found in earlier systems such as paper diaries or isolated PDA style devices. Participants data are uploaded in near real time to the back-end server. They can use their dashboard to view feedback about their data collection process and to know their device is working correctly or get help if it is not. The
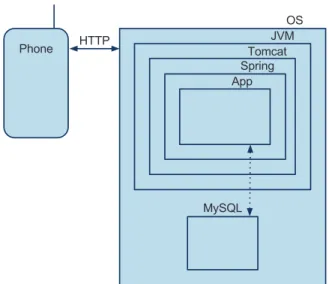
Figure 4: The modular layers of the server architec-ture. Incoming server calls start at the HTTP layer, make their way down to the database, then return to the HTTP layer to send any responses.
data collection process itself becomes clear and meaningful, which adds motivation to the participant to continue to col-lect more data.
3.
IMPLEMENTATION
AndWellness has three separate groups of code: the Java based server, Android code that runs on the mobile device, and the JavaScript based client-side website.
3.1
Server
The AndWellness server is implemented in Java 1.6 and is hosted in the Apache Tomcat 6.0 environment. Collected data are stored in a MySQL 5.1 database. A single archive file packages the compiled code and necessary dependen-cies, including java and mysql binaries for both windows and linux.3
A new server machine can be installed by unzipping the package into the /opt/aw directory and running the OS appropriate startup scripts for the database and server. A bit more setup is required to enable SSL with a signed cer-tificate for secure data upload.
The server is implemented using a REST style architec-ture [7]. HTTP based APIs control access to upload data to the server from the mobile devices, and to retrieve the data from the server for display. Incoming HTTP requests are parsed into a custom AwRequest object, which is passed down through multiple validation, service, and database lay-ers. After the request hits the database, the AwRequest object is passed back up to the HTTP layer which sends a response back to the caller. Figure 4 shows a graphical representation of these various layers and how incoming re-quests filter through.
As the server forms the backbone of AndWellness, we have concentrated on server scalability. First, our use of the Spring framework provides component replaceability and flexibility which allows our system architecture to scale with new features easily. Programmer time is scarce and ex-pensive, and our system is designed to allow developers
3
Tomcat will run in any operating system with the appro-priate java binaries.
Figure 5: The server application is designed to have as few dependencies as possible. The application runs in Spring, which in turn runs in Tomcat, which is a Java based web server that can execute in any JVM.
to quickly add or replace modules of functionality at every layer. Second, the system has been designed to handle large streams of incoming data. The main server processing struc-ture is loaded into memory at server startup, hence each request only consumes a minimal amount of memory. An increasing number of concurrent requests will not overflow server memory. Finally, the data generated from the con-tinuous sensor samples can be quite large and dense.4
We plan to use scheduled data preprocessing jobs to condense these sets into more manageable sizes which will drastically reduce lookup latency.
3.2
Phone
The AndWellness mobile application is implemented us-ing the standard Android development framework in the Java programming language. The phone software is setup to match the campaign configuration on the server.5
After reading in the configuration, the phone automatically gener-ates the survey questions and response inputs. After logging in, a participant sees a display showing the surveys that can be responded to at anytime, as shown in Figure 2. If al-lowed, the user can open the settings menu to adjust the trigger times for daily triggered surveys. The implementa-tion is simple and robust, allowing the user to answer surveys at anytime, whether or not they have a network connection. Responses are stored on the phone until the upload service is triggered, which securely transmits the data to the server with end to end reliability, ensuring no data is lost.
3.3
Visualizations
The online data visualizations have been implemented in JavaScript, an open source language that runs in most
mod-4
Sensors sampling at 1Hz generates 86,4000 samples a day or about 2.5 million samples a month.
5
The ability for phones to automatically download and syn-chronize with the campaign configuration is currently under development.
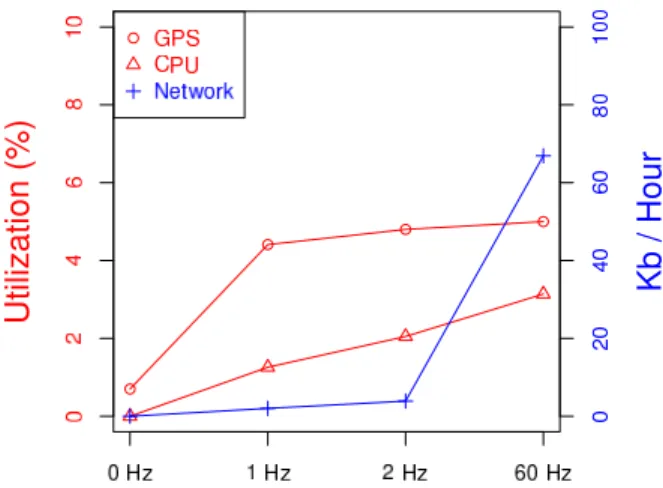
Figure 6: The resource utilization of our AndWell-ness mobile application collecting activity inferences at 0 Hz, 1 Hz, 2 Hz, and 60 Hz. The GPS takes some time to initialize, so even sampling at 1 Hz keeps the GPS utilization close to maximum.
ern web browsers. Although JavaScript can have overhead, it gives enough flexibility to allow both the user and the par-ticipant to interact with their data without installing custom software. To ensure a low latency experience, the data vi-sualizations have been implemented to handle potentially large amounts of data. The continuous sensors can generate high resolution data and attempting to visualize this directly would require downloading and displaying over half a mil-lion points. Instead, the system constantly pre-aggregates any collected data into much lower resolutions and exposes various HTTP APIs to allow the visualizations to grab only the necessary resolution of data. As the data is transported in relatively inefficient ASCII JSON, the server seamlessly gzips the JSON before transport to minimize latency waiting for arrival.
4.
EVALUATION
We explore the impact of AndWellness on Android phones by measuring the CPU, GPS, and accelerometer usage, net-work usage, and overall battery life. We also examine feed-back from a group of in lab participants who ran our software over a two week period.
4.1
Phone Performance
AndWellness can run on any Android based mobile device, but our initial target for deployment is the first generation G1. The phone uses a Qualcomm MSM 7201A 528 MHz pro-cessor, 192 MB RAM, and a 1150 mAh lithium ion battery. To document application performance we use SystemSens, a background process to log detailed system information [6]. SystemSens continuously system statistics such as CPU uti-lization, network usage, and current battery percentage in the background and uploads them to a local server.
4.1.1
CPU Utilization
The CPU is one of the main limited resources on mobile devices. Mobile phone CPUs are by nature low power to help maintain battery life. Over utilizing the CPU risks making the phone less responsive and hence less usable for the participant.
The vast majority of AndWellness CPU cycles are used for continuous sensors, mainly real-time activity inference. Each inference sample reads a measurement from both the GPS and the accelerometer and performs some basic clus-tering to determine the most likely user activity. The infer-ence rate can be changed from the phone application and ranges from once a second to once a minute, or completely off. To examine CPU overhead, the application was set to sample activity one per second, once every 30 seconds, once per minute, and finally not at all. The overall CPU usage times were measured and averaged for each setting over an hour long period. The results are shown in Figure 6. As we increase the inference rate from 1 Hz to 60 Hz, the CPU utilization only increases a couple percent, showing that the inference itself is quick and efficient.
4.1.2
Network and Storage
Another meaningful limited resource is network usage and storage. Inferring activity once per second can build up a large amount of queued data waiting for upload. Upload-ing causes a noticeable drain on battery life and can slow other network access. To measure network usage and stor-age, again each of the activity sampling rates were selected, but this time the phone was left charging with a strong con-nection to upload data immediately after collection. The results can be seen again in Figure 6. Sampling at once per second uses about 670 KB an hour.
4.1.3
Battery Life
The main uses of battery life are the CPU and sensors with network usage being a somewhat distant third, so again mo-bility inference and other continuous samplings constitute the main cost. To measure the impact of AndWellness on the battery, we run the sampling activity at the above rates and measure the rate of battery drain for each.
These measurements highlight the fact that both the GPS and accelerometer do not shutoff, no matter the sampling rate. Therefore, the only difference in battery drain is the amount of network traffic generated, which does not notice-ably impact the battery drain. However, we did find that the entire battery is drained in about 7.6 hours with activity inference running. This is unfortunately fast, as the typical user will not be able to fully recharge their battery that of-ten. However, turning the sampling off completely allows AndWellness to have virtually no impact on battery life. The main battery drains here are the GPS and accelerome-ter, and we plan to adjust the activity inference module to better duty cycles those sensors.
4.2
Case Studies
We have run a two week in lab deployment of our system using the same campaign settings from a planned future de-ployment. Participants were given a G1 Android device, along with a user name and instructions to fill out surveys from current studies, described in Section 5.4.2. There are four surveys, each triggering once per day with the standard Android notifications. Over the two weeks, the response rate stayed a relatively high 85%, even though the participants were not reminded to fill out the surveys except by the phone itself. We have additionally held a number of focus groups to direct development and have two upcoming studies that plan to use AndWellness. These are discussed in Section 5.4.
5.
DISCUSSION
Here we discuss various issues implementing and design-ing AndWellness includdesign-ing data quality, privacy designed to comply with the Institutional Review Board (IRB) standard practices, and transparency.6
We review feedback from in lab testing, initial testing for two planned studies, and sev-eral focus groups.
5.1
Data Quality
Researchers are continually striving to reduce bias and improve the quality of data from experience sampling stud-ies. Bias stems from two main sources: the user returning tainted data (e.g., data filled out days after an event instead of immediately), and the user returning incomplete data or having a low response rate [23]. To combat tainted data, the researcher wants certain controls over the user phone interaction, which may contradict a purely user oriented de-sign. For example, the researcher may want to only allow a participant to respond to a survey when it triggers and not other times, not allow a participant to review previous survey responses when answering a survey, and other spe-cific methodologies. Our AndWellness system does allow the configuration of the first two parameters when constructing a new campaign. New features from near term deployments can be easily added into our modular campaign customiza-tion software.
Our second source of bias comes from incomplete data. If a study shows low adherence from a participant, that user might be avoiding certain questions due to difficulty of answering the question, the question being triggered at inopportune times, or other usability issues. Fortunately, the wireless nature of mobile phones gives real time access to study data. If a participant fails to respond to triggered questions or otherwise does not upload data, they can be contacted for followup. Perhaps there is a technical issue or they are failing to adhere to study protocols. Also, our system includes per user configuration of triggers to allow the flexibility to avoid triggering at bad times, such as when as participant is asleep or otherwise busy. Finally, collected data can be viewed to determine if the study parameters themselves need to be modified.
5.2
Privacy
We designed out system to ensure our software has the flexibility to meet current standards of privacy. The privacy of participant data is important to allow users to trust the data collection process. An insecure system can cause users to change their behavior or to fabricate answers to personal or potentially incriminating questions. For example, a par-ticipant may decide to avoid certain locations if they think their location traces were not secure, or selectively fail to mention certain behaviors in survey questions.
There are also various protocols and standards of privacy actively enforced by the IRB. User login names are randomly assigned from a word generator and all data linking user name to personally identifying information is quarantined. The data linking user names to personal identifying informa-tion can be made accessible to only specific people, removed when giving out data for secondary uses, or even destroyed making the data permanently quasi-anonymous. However,
6
The IRB oversees and approves research that collects data concerning human subjects.
adhering to these strict protocols gives a tension between privacy and usability. Participants do not want to have to constantly login, click “Are you sure?” boxes, or remember arcane passwords, and too much emphasis on privacy could lead to a frustrated participant and reduced adherence rates. Our system can fit either need by its database design, and allowing for the fine tuned configuration of these parameters.
5.3
Transparency
Other methods to boost adherence are participant trust and engagement. Participants want to know how data is being collected, where the data is going, and the have abil-ity to visualize the data. This clarabil-ity will help to ease user concerns about technology by allowing them to see exactly what data and what types are data are collected. In addi-tion, when participants can view both their upload statistics and visualizations of their data, they become more engaged in the data collection process as a whole. Instead of sending their data off into a black box, participants are motivated to change their long term behaviors by the accountability of viewing their data.
5.4
Preliminary Feedback
Our system has been tested and given feedback by a group of in lab researchers and two groups of out of lab researchers. Six researchers from our lab have answered a small daily survey for two weeks. Initial feedback from the participants suggest that the system of triggers and reminders is almost mandatory for continued participation. One researcher com-mented that he helped test other applications, but this was the only one in which he collected data for a full two weeks. The reminders and response feedback were enough to help him feel engaged and data collection became a routine activ-ity. However, we also received feedback that the vibration pattern and ringtones used for the notifications were too annoying, highlighting the thin line between reminding and irritating, and the importance of field testing in real situa-tions.
5.4.1
Focus Groups
We have organized several focus groups with colleagues to motivate and refine the design of AndWellness and po-tential studies using AndWellness. These groups include both researchers and potential participants drawn from the intended audience of each study. Participants were given mockups of both the mobile phone and dashboard applica-tions and asked quesapplica-tions about:
• Typical usage patterns of mobile phones and the web. • The overall content of the survey questions.
• Preferences and concerns about privacy.
• Previous experiences in self-monitoring of health and
behaviors.
Feedback from these groups was surprisingly detailed and includes suggestions about:
Customization: Customization is important, primarily changing the prompt triggering times to fit individual sched-ules.
Privacy: Privacy issues include data privacy, security, and anonyminity. Participants felt it was important to be
able to select whether or not to share the data from the sur-vey prompts themselves. The participants did want to view others’ anonymized data, and mostly did not mind sharing their own data if it was anonymized or aggregated.
Media: Non-textual data such as images help to moti-vate by giving more contextual information and increasing accountability. Using a diet monitoring survey as an exam-ple, several participants mentioned that being able to see images of the food they ate would motivate them to stay on their diet plan.
Social Context: Participants expressed the desired to upload anonymized data to share and to view aggregated data. They wanted the ability to get inspirations and sug-gestions from others.
Engagement: Perhaps most enlightening was discussing long term motivation. Participants want to feel included in something useful, whether that is helping research, manag-ing their weight and health, or the social aspect of sharmanag-ing their data. They liked the idea of having a tool to help them reflect on their behaviors and hold them accountable. However, participants wanted this ability to meet goals and view past data the device itself, not on a website. Finally, the idea of financial incentives was discussed, but most felt improving their behavior and helping research was more en-gaging.
5.4.2
Cancer Survivor Study
Patti Ganz, a professor at UCLA, is currently running an IRB approved study to measure the behaviors and emo-tions of young breast cancer survivors. The study includes four surveys to be triggered daily. The first survey triggers in the morning, and asks the participant about their previ-ous nights sleep. The second and third surveys trigger mid morning and early afternoon respectively, and ask the par-ticipant to give various emotional feedback. The final survey asks the participant about their behaviors from that day in-cluding exercise and substance use. Finally, all the triggers also remind the user to take a simple saliva sample, which is used to measure various biomarkers.
This deployment is good first step for AndWellness. The survey questions are straightforward and participant adher-ence relies on timed triggers as reminders. The surveys sam-ple exactly what the standard experience sampling study require: emotions and behaviors throughout each day that would be difficult to remember even a day or two later. Feed-back from preparation has greatly helped us develop a useful system, as has feedback from future deployments and focus groups.
5.4.3
Risky Behaviors and HIV Transmission
The Center for HIV Identification, Prevention, and Treat-ment Services (CHIPTS) is preparing an IRB approved study using AndWellness to assess at risk HIV+ participants. The study asks participants to self-monitor sexual behaviors, sub-stance use, and emotional distress using both standard in-trospective methods, such as in-person interviews and online surveys, along with our new mobile phone based system. They will recruit 60+ participants in total, each responding to one to four surveys a day over a six week period, with an 80% expected compliance rate based on previous studies.
The participants are split into three groups. The first group will serve as a control and not be given mobile phone, but will instead respond to prompts through person
in-terviews and web based surveys. The second group will be given mobile phone with the AndWellness software and be told to respond to daily surveys as if the phone were a sim-ple diary to record data. The third group will again be given phones, but be told AndWellness is an end-to-end self-management system to collect and view behavorial data. The study authors will compare the groups to assess the feasibility of using mobile phones to monitor risky behavior, assess the reliability and validity of mobile phone data ver-sus introspective self-reporting methods, and examine the influence of framing the study as a simple data collection survey versus as a self-health management tool. In other words, this study will directly measure the difference in par-ticipant adherence and motivation using our phone based system versus older survey methods.
5.5
Future Directions
AndWellness is very much a project in flux, with various features being added and changed in response to user feed-back. Currently, campaign configuration is not as smooth as it could be, causing a steep overhead for researchers em-ploying our system. Following the lead of ODK, we have plans to implement detailed survey authoring via an in house XML schema, allowing researchers to use our system to de-fine their own campaigns, survey prompts, and data types without programmer assistance. The display of each survey prompt can condition on the answer to previous prompts, thereby allowing a complex tree of survey branching and re-ducing the number of prompts answered by the participant. The configuration will automatically download to phones that have logged into the campaign. Surveys, triggers, and continuous logging will have standardized interfaces on the mobile device, and so will be setup directly from the con-figuration. More advanced planned functionality includes the ability to remotely change prompts and triggers man-ually from the central server and even automatically based on characteristics of returns data from participants.
6.
RELATED WORK
Related work can be divided into two classes: previous experience sampling based studies published by clinic psy-chologists, and specific software systems designed to survey individuals from electronic devices.
6.1
Experience Sampling Studies
Psychologists have used variations of the ES method for some time. Arguably one of the earliest and most low tech method is the paper diary. Participants are asked to log sur-veys in a notebook at predetermined times or whenever cer-tain events occur. Lemmens et al. use this method to study how participants report alcohol consumption and compares weekly interviews to daily diary entries [13]. Diaries are cheap and reduce recall bias but they suffer from numerous problems. First, while diaries have a very low upfront cost, the post-study analysis including entering diary data and following up on illegible entries can be labor intensive and costly. Second, adherence to the entry schedule cannot be verified. Recent studies show that participants tend to fake entries, the most common method being to fill out many entries at once right before turning in the diary [24]. Fi-nally, asking participants to log data multiple times a day without other motivation introduces adherence issues. Re-minders to complete surveys, especially if a participant is
falling behind, helps to engage them in the data collection process and boost adherence rates [23].
Later studies employ a wide range of techniques to en-hance participant adherence to study protocols and to assess per user and overall protocol compliance. Leveraging exist-ing infrastructure, Searles et al. deployed an automated telephone system and instructed participants to call in daily and respond to various audible prompts [20]. These systems eliminate problems with data entry as all data are recorded as integer touch-tone responses to precompiled questions. Responses are also time stamped, eliminating the ability to retroactively answer responses. Later studies work to op-timize this method by utilizing the real-time nature of the data collection to contact participants who are failing to call in and by handing out mobiles to facilitate the ease of calling in [3].
Finally, recent studies employ various hand held electronic devices to combine both prompt triggers to remind the par-ticipants to complete a survey, and compliance checks via time stamps to ensure the assessments were completed at the expected times. Epstein et al. employed Palm Pilots to study the situations that trigger heroin and cocaine cravings and use in recovering participants. The study was designed to prompt the participant for survey responses randomly during the participant’s waking hours, and also whenever use or cravings occurred. The PDA devices had no wire-less connectivity and were collected and replaced often to download data and recharge batteries. While requiring par-ticipants to return to the lab once a week was burdensome, the devices themselves recorded data quickly and easily, and the study garnered an overall 75% response rate [5].
Other studies make use of the wireless nature of mobile phones by using simple SMS messaging. They improve self-monitoring of behavior by both sending reminders and col-lecting survey data via texts [18], [17]. This technique is flexible as the entire study including the SMS sending sched-ule can be tweaked configured per user. Hence, texting al-lows many of the conveniences that come from wireless such as per user configuration of triggers, reminders and survey questions and the real-time viewing of returned data. How-ever, collecting large amounts of data, continuous data, and other types of non-textual data is not possible.
6.2
Other Software Systems
Specific data collection systems include commercial soft-ware such as Pendragon Forms, Frontline Forms, and Nokia Data Gathering, which provide tools to organize surveys and collect data, but they are closed source and closed stan-dards. Open source projects such as JavaRosa, RapidSMS, FrontlineSMS, and EpiHandy are more flexible to tune the system for particular uses, but are primary focused on col-lecting textual data. These systems work well for their in-tended audiences, mainly targeted data collection by an ed-ucated set of participants but don’t incorporate reminders, triggers, or other methods to enhance the participation of users monitoring their daily life. Our system instead as-sumes non-technical participants and allows and motivates these participants to collect data about themselves and their environment. AndWellness is designed to fit unobtrusively into a participants’ daily life to encourage longer term data collection and lower drop out rates.
In addition, several research efforts have been focused on improving the quality of the user responses. The
Context-Aware Experience Sampling (CASE) tool incorporates sen-sor data to trigger self-report surveys at specific moments of interests [11]. However, it was not designed to run on a participant’s own personal device and does not offer the flex-ibility of specifying dynamic trigger conditions and generic actions. MyExperience extends context-triggered ES with passive logging of contextual information such as device us-age and sensor readings [8]. By combining in situ qualitative data (e.g., survey answers) and quantitative usage data of the mobile phone (e.g., phone calls), it provides different perspectives for researchers to look at the gathered data. It also lowers the learning curve for researchers to collect data by providing a lightweight XML-based configuration. Mobile Heart Health attempts to go further to link trig-gers to contextual data by continuously reading heart rate data from a wireless ECG [16]. To minimize participant interruption and target stressful events, the system waits for strong deviations in a participants heart rate before ac-tivating surveys and other automated coaching techniques. Finally, UbiGreen demonstrates an experience sampling ap-plication that combines automated sensing along with an innovative incentive feedback system to maintain motiva-tion [9]. The participants of the study are given feedback directly on the phone, thereby eliminating the need to login to an online website and more tightly coupling participation and incentives to continue.
Reconexp combines a website where participants can re-view data they have provided during the day by using the ESM running on a hand held device [12]. In cases where participants are unable to respond, they may answer at a later time using a website. However, participants cannot initiate the queries by themselves and do not automatically synchronize the captured data with a remote server. Using a feedback mechanism to improve response quality has also been studied and proven to be effective. By showing par-ticipants their own collected information, it makes the in-formation personally relevant and interesting and increases the value of the study to the participants [10]. To further improve responses by reducing the load on participants, re-searchers have found that collecting images is much quicker and easier than answering a multitude of survey questions. The images provide their own context, and can be used to jog participants memory for followup questions at a later time [2]. Other systems use various bluetooth devices to capture even more types of data, further reducing the need for imprecise survey responses [19].
7.
CONCLUSION
We have presented AndWellness, an end-to-end data col-lection system designed to monitor participants’ daily habits and behaviors. AndWellness supports server side configura-tion of campaigns, which can be setup to collect survey re-sponses with defined data types, other text and media, and continuous data from various onboard sensors (e.g., location traces from GPS and activity inference).
Our contributions are two fold. First, we have created a system that collectsin situ behavorial and contextual data from participants. AndWellness is being used in one de-ployment, and is being actively prepared for two additional deployments, each with over 50 participants. Second, we bring together the advantages from similar systems in to one open, seamless package that has been designed from the ground up to meet the requirements set by researchers from
previous studies.
Finally, we are actively developing and improving the sys-tem, taking into account feedback from both focus groups involving actual users of the system and from researchers preparing for deployments. Future work will add additional types of data to be collected, more features to survey con-figuration such as certain survey question answers triggering other surveys, and more in depth visualizations to explore complex user data.
8.
REFERENCES
[1] L. F. Barrett and D. J. Barrett. An introduction to computerized experience sampling in psychology.
Social Science Computer Review, 19(2):175–185, 2001. [2] S. Carter and J. Mankoff. When participants do the
capturing: the role of media in diary studies. pages 899–908, 2005.
[3] R. L. Collins, T. B. Kashdan, and G. Gollnisch. The feasibility of using cellular phones to collect ecological momentary assessment data: Application to alcohol consumption.Experimental and Clinical
Psychopharmacology, 11(1):73–78, 2003.
[4] M. Csikszentmihalyi and R. Larson. Validity and reliability of the experience-sampling method.The Journal of Nervous and Mental Disease, 175(9), 1987. [5] D. H. Epstein, J. Willner-Reid, M. Vahabzadeh,
M. Mezghanni, J.-L. Lin, and K. L. Preston.
Real-Time Electronic Diary Reports of Cue Exposure and Mood in the Hours Before Cocaine and Heroin Craving and Use.Arch Gen Psychiatry, 66(1):88–94, 2009.
[6] H. Falaki, R. Mahajan, S. Kandula,
D. Lymberopoulos, R. Govindan, and D. Estrin. Diversity in smartphone usage. InMobiSys ’10: Proceedings of the 8th international conference on Mobile systems, applications and services, New York, NY, USA, 2010. ACM.
[7] R. T. Fielding.Architectural Styles and the Design of Network-based Software Architectures. PhD thesis, University of California, Irvine, 2000.
[8] J. Froehlich, M. Y. Chen, S. Consolvo, B. Harrison, and J. A. Landay. Myexperience: a system for in situ tracing and capturing of user feedback on mobile phones. InMobiSys ’07: Proceedings of the 5th international conference on Mobile systems,
applications and services, pages 57–70, New York, NY, USA, 2007. ACM.
[9] J. Froehlich, T. Dillahunt, P. Klasnja, J. Mankoff, S. Consolvo, B. Harrison, and J. A. Landay. Ubigreen: investigating a mobile tool for tracking and supporting green transportation habits. InCHI ’09: Proceedings of the 27th international conference on Human factors in computing systems, pages 1043–1052, New York, NY, USA, 2009. ACM.
[10] G. Hsieh, I. Li, A. Dey, J. Forlizzi, and S. E. Hudson. Using visualizations to increase compliance in experience sampling. InUbiComp ’08: Proceedings of the 10th international conference on Ubiquitous computing, pages 164–167, New York, NY, USA, 2008. ACM.
[11] S. S. Intille, J. Rondoni, C. Kukla, I. Ancona, and L. Bao. A context-aware experience sampling tool. In
CHI ’03: CHI ’03 extended abstracts on Human factors in computing systems, pages 972–973, New York, NY, USA, 2003. ACM.
[12] V.-J. Khan, P. Markopoulos, B. Eggen,
W. IJsselsteijn, and B. de Ruyter. Reconexp: a way to reduce the data loss of the experiencing sampling method. InMobileHCI ’08: Proceedings of the 10th international conference on Human computer interaction with mobile devices and services, pages 471–476, New York, NY, USA, 2008. ACM.
[13] T. F. Lemmens P, Knibbe R. Weekly recall and diary estimates of alcohol consumption in a general population survey.Journal of Studies on Alcohol, 49(2):131–135, 1988.
[14] A. Logan, W. McIsaac, A. Tisler, J. Irvine,
A. Saunders, A. Dunai, C. Rizo, D. Feig, M. Hamil, M. Trudel, and J. Cafazzo. Mobile phone-based remote patient monitoring system for management of hypertension in diabetic patients.American Journal of Hypertension, 20(9):942–948, 2007.
[15] H. McDonald, A. Garg, and B. Haynes. Interventions to enhance patient adherence to medication
prescriptions: Scientific review.JAMA: The Journal of the American Medical Association,
288(22):2868–2879, 2002.
[16] M. Morris and F. Guilak. Mobile heart health: Project highlight.IEEE Pervasive Computing, 8:57–61, 2009. [17] J. Obermayer, W. Riley, O. Asif, and J. Jean-Mary.
College smoking-cessation using cell phone text messaging. Journal of American College Health, 53(2), 2004.
[18] K. Patrick, F. Raab, M. Adams, L. Dillon,
M. Zabinski, C. Rock, W. Griswold, and G. Norman. A text message-based intervention of weight loss: Randomized controlled trial.Journal of Medical Internet Research, 11(1), 2009.
[19] M. Rasid and B. Woodward. Bluetooth telemedicine processor for multichannel biomedical signal
transmission via mobile cellular networks.Information Technology in Biomedicine, IEEE Transactions on, 9(1):35–43, March 2005.
[20] J. Searles, M. Perrine, J. Mundt, and J. Helzer. Self-report of drinking using touch-tone telephone: extending the limits of reliable daily contact. Journal of Studies on Alcohol, 56(4):375–382, 1995.
[21] Z. Shen and K.-L. Ma. Mobivis: A visualization system for exploring mobile data.Proceedings of IEEE Pacific Visualization, 2008.
[22] S. Shiffman, M. Hufford, M. Hickcox, J. Paty, M. Gnys, and J. Kassel. Remember that? a
comparison of real-time versus retrospective recall of smoking lapses.Journal of Consulting and Clinical Psychology, 65(2), 1997.
[23] S. Shiffman, A. A. Stone, and M. R. Hufford. Ecological momentary assessment.Annual Review of Clinical Psychology, 4(1):1–32, 2008.
[24] A. A. Stone, S. Shiffman, J. E. Schwartz, J. E. Broderick, and M. R. Hufford. Patient compliance with paper and electronic diaries.Controlled Clinical Trials, 24(2):182–199, 2003.