Normal tissue complication probabilities (NTCP) for
modifi ed reverse hockey stick technique (MRHS)
Paweł Franciszek Kukołowicz
Medical Physics Department, Holycross Cancer Centre, Kielce, Poland
Summary
Background Several treatment techniques are used for irradiation of patients with breast can-cer after mastectomy. There is no one technique accepted as the “gold standard”. In the Holycross Cancer Centre a novel technique – the modifi ed reverse hock-ey stick technique – is used.
Aim Evaluation of the risk of heart and lung injury in patients treated with the MRHS
technique. Comparison of the risk for MRHS and tangential techniques.
Materials/Methods The 3D CT based dose distributions for 25 left-sided and 25 right-sided patients after mastectomy were calculated. For each patient before the NTCP was
calcu-lated all physical doses were converted into biological doses according to an a/b
model with an a/b value of 3Gy. The NTCP for the lung was for each patient
cal-culated with generalized Lyman model with two parameters: the biological mean dose and the volume above a biological threshold dose of 13Gy (V13). For the heart the NTCP was calculated using the seriality model. The parameters of the models were taken from the literature. For the heart, for each patient the par-tial volume of the heart receiving more than 30Gy (V30) was also obtained. The correlation between NTCP and V30 for the heart and between the mean physi-cal dose and the mean biologiphysi-cal dose for the lungs were determined.
Results For all left-sided patients but two for the MRHS technique the NTCP for the heart was smaller than 0.01. For tangential technique, the calculated risk of heart inju-ry was higher. A veinju-ry high correlation between V30 and NTCP was obtained for both techniques. Larger NTCPs were obtained for both techniques for patients treated on the right side. About two times higher values of NTCP were obtained if calculated with the V13 parameter. Based on the mean dose on the left side NTCP is always smaller than 0.05. For some patients treated on the right side, NTCP exceeded 0.1. NTCP values for patients treated either on the left or the right lungs for both techniques were similar. There was a high correlation be-tween the mean physical and biological doses.
Conclusions For left sided-patients, the MRHS technique is safe for the heart and is superior to the tangential technique. The risk of lung injury is higher for patients treated on the right side. Regarding the risk of lung injury, there is no difference between the two techniques. There is a very high correlation between NTCP and V30 for the heart and between the mean physical and biological doses for the lungs.
Key words NTCP • reverse hockey stick technique • tangential technique
Received: 2006.07.20 Accepted: 2006.12.06 Published: 2007.03.09 Authors’ Contribution: A Study Design B Data Collection C Statistical Analysis D Data Interpretation E Manuscript Preparation F Literature Search G Funds Collection Original Paper
B
ACKGROUNDIn the last ten years, three large randomized trials have demonstrated benefi t in survival in patients randomized to comprehensive postoperative loco-regional radiotherapy after systematic treatment in breast cancer patients [1–3]. Therefore, many ra-diotherapy centres performed routinely compre-hensive postmastectomy radiotherapy. The close proximity of the clinical target volume (CTV) to the radiosensitive structures, the heart and the lungs, often necessitates highly individualized treatment planning with complex fi eld arrangements. While several treatment techniques are used, there is no one technique accepted as the “gold standard” [4]. In the treatment planning procedure for patients treated for left-sided breast cancer it is of special importance to keep the dose to the heart as low as possible. The older treatment techniques involv-ing orthovoltage X-rays and Co60 beams resulted in increased rates of pericarditis and radiation-in-duced ischaemic heart disease [5,6]. The modern treatment techniques in most cases result in lower cardiac dose than the older ones. However, still the risk of cardiac toxicity should always be taken into account for each single treatment plan. Radiation-associated pneumonitis is not a very common se-quel of radiotherapy. However, it has been report-ed in several studies [7–10].
A
IMQuantitative evaluation of the normal tissue re-sponse to irradiation is typically performed by means of mathematical models. Normal tissue complication probability may be calculated us-ing dose-volume histograms (DVHs) of organs at risk, and mathematical models. Several mod-els that predict the incidence of radiation pneu-monitis and heart injury have been developed [11,12]. To the best of the author’s knowledge there is no publication in which the NTCP for the heart and the lung was calculated for post-mastectomy patients treated with the reverse hockey stick technique [13]. Gagliardi used the data for calculations of lung pneumonitis for
pa-tients treated with a similar technique, but real 3D dose distributions were not available. The av-erage dose distribution was calculated based on the calculation made for 10 patients and this av-erage dose distribution was used for the NTCP calculations. In this study, the NTCP values for lung and heart for a group of patients treated for left-sided breast cancer and the NTCP values for lung for a group of patients treated for right-sid-ed breast cancer were calculatright-sid-ed. The NTCP val-ues were compared with the NTCP valval-ues calcu-lated with tangential techniques.
M
ATERIALSANDM
ETHODS25 randomly selected postmastectomy patients treated for left-sided and 25 for right-sided breast cancer were used for this study. The treatment planning for each patient was performed by means of a CT-based 3D dose planning system (TMS, Nucletron). The CT images were acquired at 10mm thick intervals from the level of the man-dible through the lung bases. The CTV including the chest wall (CW) and the axillary, parasternal and supraclavicular lymph nodes was delineated by a radiotherapist. The lung contours were de-fi ned by means of an automated density gradi-ent tracing method, and if necessary corrected by the physicists responsible for treatment plan-ning. The heart contours were delineated man-ually by physicians. The planning target volume (PTV) was defi ned by expanding the CTV of 5mm in the medio-lateral direction only.
In the RHS technique, the supraclavicular nodes and lateral chest wall were treated using an ante-rior 6MV photon fi eld. The internal mammary nodes and medial chest wall were treated using an anterior fi eld of 6, 9, 12 or 15MeV electrons. The energy was chosen to keep the minimum dose to the PTV to 85%. In some cases, an additional posterior 15MV photon fi eld was used to keep the minimum dose to the supraclavicular and lateral chest wall to at least 85%. Other details of the dose planning for the reverse hockey stick technique are described in a former publication [5].
Author’s address: Paweł Franciszek Kukołowicz, Medical Physics Department, Holycross Cancer Centre, Artwińskiego 3 Str., 25-734 Kielce, Poland, e-mail: [email protected]
Full-text PDF: http:/www.rpor.pl/pdf.php?MAN=10035 Word count: 3063
Tables: 2 Figures: 9 References: 23
The treatment planning for tangential fi elds was performed with the same set of CT scans as for the MRHS technique but the patient’s arm on the irradiated side, which would attenuate the me-dial tangential fi eld, was removed from the cal-culation matrix. The tangential fi eld technique was composed of two tangential fi elds directed to the chest wall and internal mammary nodes. The dorsal edges of both beams were made co-planar. The supraclavicular and axillary node re-gion was irradiated with an anterior fi eld. If the dose to the supraclavicular nodes was smaller than 90%, an additional posterior fi eld was used. For the same reason, a 0.5-cm bolus was applied to the CW. For every beam, the individual blocks were designed to make the shape of the beam conform to the PTV as best as possible.
The patients were treated with a prescribed dose of 50Gy, 2Gy/fraction. In the case of the MRHS technique, the dose was specifi ed to the dose at the maximum dose point at the central axis of the electron beam. In the case of tangential fi elds, the dose was specifi ed at the middle point in the chest wall (ICRU reference point for the chest wall target). The weights of the beams were chosen to keep the mean dose to the PTV in the range 100–103% of the prescribed dose. In all cases the dose distributions in the PTV of tangential techniques were more homogeneous than the dose distributions of the MRHS tech-nique. The standard deviations of the dose distri-butions to the PTV for tangential technique were in the range of 5–7%, and for the MRHS tech-niques in the range of 6–8% of the mean dose. The differences between techniques were small so there was no need to correct the total dose de-livered to the PTV. The dose distributions were calculated based on CT data with tissue inhomo-geneity correction.
NTCP calculations
For each patient, before the NTCP was calculated for either heart or lungs all physical doses were converted into biological doses according to an
a/b model with an a/b value of 3Gy.
The NTCP for the heart was calculated using the relative seriality model. The response of the heart to a non-uniform dose delivery is given by:
NTCP=
[
1–PK[
1–P(Dk)S]
Dvk
]
1/s,
where K is the number of subvolumes in the
dose-volume histogram, Dvk is the partial volume of
the heart, and the parameters describes the
rela-tive seriality of the organ. The P(Dk) function de-scribes the dependence of the probability of in-jury of dose in the case of irradiating the whole
organ with a homogeneous dose. The P(D)
func-tion is given by:
P(D)=2–ee·g·(1
D )
D50
where D50 is the dose corresponding to the 0.5
complication probability; the parameter g is the
maximum relative slope of the dose-response curve. The parameter values of the relative se-riality model were chosen from Gagliardi [12]. They were D50=52.4Gy, g=1.28 and s=0.87. For the
heart, values of the percentage of the heart that
received more than 30Gy (V30Gy) were also
ob-tained. The V30Gy metric was chosen based on the data from Hancock and Gagliardi, who have demonstrated this dose to be the threshold for calculated risk of heart injury [14,15].
For lungs, the dose volume histogram was fi rst reduced to a single parameter, T. Two single pa-rameters were used: the “volume above a
thresh-old dose VDth” and the mean dose to the lungs.
The Dth value of 13Gy was used for calculations. The pneumonitis incidence is given by:
NTCP = 1 1
∫
e 2 –x2 dx √2·P –∞ t=T–TD50 m·TD50,where TD50 is the value of parameter T for
com-plication probability of 0.5, and m is the slope pa-rameter (the smaller is the m papa-rameter the larg-er is the steepness of the dose-response curve). The parameter values were taken from the paper
of Seppenwolde et al. [11]. The parameters VDth
and m were 77% and 0.44 respectively. TD50 and
m were 30.8Gy and 0.37 respectively.
R
ESULTSFigure 1 shows V30Gy for all patients for both
tech-niques treated for left-sided breast cancer. The re-sults were sorted according to increasing values. Figures 2 shows the NTCP and the correlation
between V30Gy and NTCP for patients treated with
the MRHS technique.
Figure 3 shows the NTCP and the correlation
be-tween V30Gy and NTCP for patients treated with
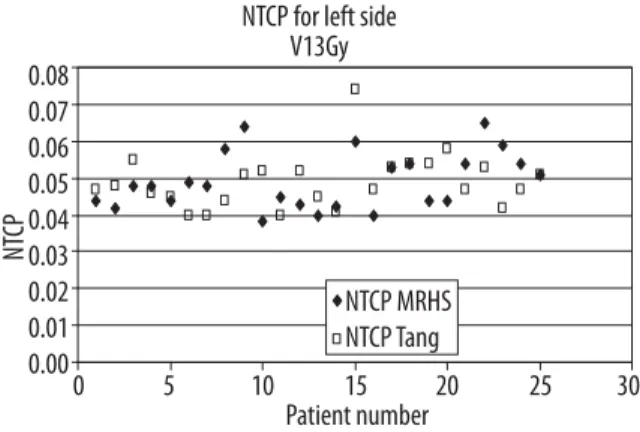
Figures 4 and 5 show the NTCP for lung for
left-sided tumours calculated based on V13Gy and the
mean dose respectively for both techniques.
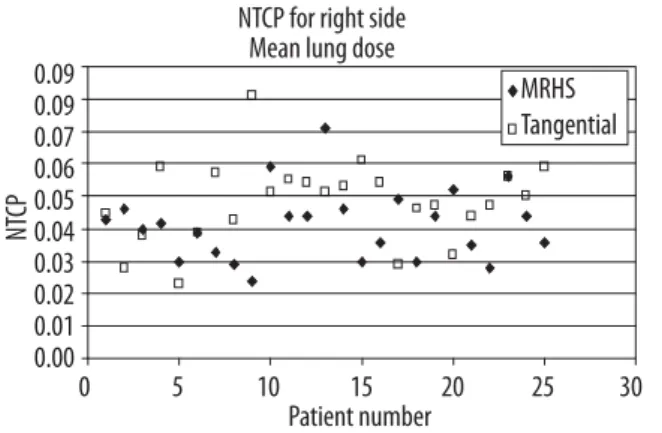
Figures 6 and 7 show the NTCP for lung for
right-sided tumours calculated based on V13Gy and the
mean dose respectively for both techniques.
V30 (%) 35.00% 30.00% 25.00% 20.00% 15.00% 10.00% 5.00% 0.00% V30 Tangential V30 MRHS 0 5 10 15 20 25 30 Patient number
Figure 1. The V30Gy for all patients for tangential and MRHS techniques treated for left-sided breast cancer.
NT CP 3.00 2.50 2.00 1.50 1.00 0.50 0.00 0.0% 5.0% 10.0% 15.0% 20.0% V30 NTCP=0.150*V30+0.024 R2=0.948
Correlation between V30 and NTCP MRHS technique
Figure 2. The NTCP and the correlation between V30Gy and NTCP for patients treated with MRHS technique.
NT CP 10.00 8.00 6.00 4.00 2.00 0.00 _2.000% 5% 10% 15% 20% 25% 30% V30
Correlation between V30 and NTCP tangential technique NTCP=0.283*V30_0.348
R2=0.893
Figure 3. The NTCP and the correlation between V30Gy and NTCP for patients treated with tangential technique.
NT CP 0.08 0.07 0.06 0.05 0.04 0.03 0.02 0.01 0.00 0 5 10 15 20 25 30 Patient number NTCP for left side
V13Gy
NTCP MRHS NTCP Tang
Figure 4. The NTCP for lung for left-sided patients calculated based on V13Gy for MRHS and tangential techniques.
NT CP 0.06 0.05 0.04 0.03 0.02 0.01 0.00 0 5 10 15 20 25 30 Patient number NTCP for left side
Mean lung dose
MRHS Tangent
Figure 5. The NTCP for lung for left-sided patients calculated based on the mean dose for MRHS and tangential techniques.
NT CP 0.14 0.12 0.10 0.08 0.06 0.04 0.02 0.00 0 5 10 15 20 25 30 Patient number NTCP for right side
V13Gy
MRHS Tangential
Figure 6. The NTCP for lung for right-sided patients calculated based on V13Gy for MRHS and tangential techniques.
Figures 8 and 9 show the correlation between the mean physical and biological doses for the MRHS for left and right side respectively.
D
ISCUSSIONIn the case of the tangential technique the CT examinations for treatment planning were not made in the typical treatment position of a pa-tient with hands raised over the head. Therefore the results obtained for the tangential technique should be treated with caution. However, in the author’s opinion the change of position of hands infl uences only a little the dose distribution in the heart and lung.
For the MRHS technique the calculated proba-bility of heart injury is in all but two cases
small-er than 0.01. Thsmall-erefore, the MRHS technique may be considered safe for patients with left-sid-ed breast cancer. For the tangential technique in 4 cases only the NTCP values are smaller than 0.01. In three cases the probability is larger than 0.05. The mean values of the NTCP in the treat-ed group of patients were 0.004 and 0.030 for the MRHS and tangential techniques respective-ly. The MRHS technique resulted in signifi cant-ly lower NTCP than tangential technique (t test for average values of NTCP, p<0.0001). The re-sult for the MRHS technique is very close to the result obtained by Pierce (0.005) for the RHS technique [23]. For the tangential technique, the result obtained in this work is a little worse than obtained by Gagliardi (0.02) [12].
For both techniques, there is a very good correla-tion between V30Gy and NTCP (t test, p<0.001). In
most commercially available treatment planning systems, NTCP calculations are not performed or are calculated at most according to only some mathematical methods, e.g. in the XiO treatment planning system only the Lyman method is
im-plemented. V30Gy may be easily obtained from
DVH and the correlation enables NTCP to be estimated quite precisely. However, it should be remembered that the formulae for correlation obtained in this work may be applied for the tan-gential and MRHS techniques only. NTCP can be calculated using the formulae:
NTCP = 0.151·V30Gy + 0.024 for the MRHS
tech-nique, and
NTCP = 0.283·V30Gy + 0.348 for the tangential
technique.
V30Gy and NTCP are given in percentages.
NT CP 0.09 0.09 0.07 0.06 0.05 0.04 0.03 0.02 0.01 0.00 0 5 10 15 20 25 30 Patient number NTCP for right side
Mean lung dose
MRHS Tangential
Figure 7. The NTCP for lung for right-sided patients calculated based on V13Gy for MRHS and tangential techniques.
Mean biological dose (
Gy) 25 24 23 22 21 20 19 18 17 16 15 14 13 12 11 10 15 16 17 18 19 20 21 22 23 24 25 26 2728 29 30 Mean physical dose (Gy)
Correlation between physical and biological doses MRHS left
y=1.034x_3.015 R2=0.948
Figure 8. Correlation between the mean physical and biological doses for the MRHS technique for left side.
Mean biological dose (
Gy) 16 14 12 10 8 6 4 2 0 9 10 11 12 13 14 15 16
Mean physical dose (Gy)
Correlation between physical and biological doses MRHS right
y=0.990x_1.350 R2=0.99
Figure 9. Correlation between the mean physical and biological doses for the MRHS technique for right side.
The dose delivered to the heart depends strong-ly on the position of the heart with respect to the PTV and the shape of the PTV itself. In the case of a very close position of the heart to the PTV, reduction of the cardiac volume may be obtained by applying a deep inspiration breath hold irra-diation technique [16,17]. The shape of the PTV and its infl uence on the cardiac doses depends mainly on the decision whether, and if so which, internal mammary nodes should be included in the PTV. In the work of Pierce only those in-ternal mammary nodal volumes in interspaces one to three were included in the PTV [23]. In this publication, the internal mammary nodes in the fourth interspaces were also delineated. Still there are controversies concerning the def-inition of the target volume with respect to in-ternal mammary nodes. However, at least for pa-tients receiving postamastectomy irradiation for advanced primary and nodal disease the irradia-tion of the internal mammary nodes appears jus-tifi able [18]. The MRHS technique is very time consuming in preparation. At least three times more time is needed for preparation of the op-timal plan with the MRHS technique than with the tangential technique. However, as shown in this work, for left-sided breast patients the MRHS technique is superior to the tangential technique, even though for some patients the difference is very small. Therefore a decision concerning the safe irradiation method at an early stage of plan-ning would be important. Marks showed that for the tangential technique there is a very high cor-relation between the maximum heart distance and the risk of heart injury [7]. If the maximum heart distance is smaller than 17 mm the NTCP is smaller than 0.01. For the MRHS technique, the maximum heart distance may by identifi ed with the heart distance in the 50% isodose. If such an interpretation is valid for the MRHS technique, for most plans for this technique the maximum heart distance is smaller than 17mm. If for the tangential technique the maximum heart dis-tance is smaller than 17mm, this technique may be considered superior to MRHS because it is pler than the MRHS technique. The virtual sim-ulation enables a very quick evaluation of some geometrical parameters, such as the maximum heart distance [19]. It is important to make it during CT examination for treatment planning because a treatment position for the tangential technique is different from the position for the MRHS technique.
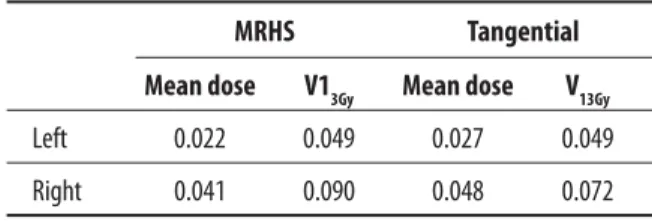
The estimated NTCP for lungs depends on the parameter used for calculations. NTCP
calculat-ed with V13Gy are always about two times larger
than those calculated with the MD. The mean val-ues of NTCP in the group of patients are shown in Table 1.
There may be two reasons for such a difference. The fi rst is the uncertainty of parameters used in both models. Table 2 shows the 95% confi dence intervals for parameter values for two models used for calculations of risk of lung injury taken from Seeppenwoolde [11].
The second one is that the V13Gy parameter –
volume above a threshold dose – is sensitive to uncertainty of dose distribution calculations. The mathematical model of dose-response re-lationships was based on the dose distributions calculated with a tissue inhomogeneity correc-tion, according to the equivalent path length method which is the simplest correction meth-od [20]. Therefore, the results based on the MD parameter seem to be more reliable and they will be discussed. It should be also emphasized that even though in the present study widely accepted mathematical models for NTCP cal-culations were used, all models are more phe-nomenological than mechanistic. This means that the validity of the models is proved by fi t-ting parameters of a model to clinical data. Moiseenko et al. analyzed the infl uence of the choice of several mathematical models on NTCP estimation for the liver [21]. They found con-siderable variability in predicted NTCP values depending on what model and what parame-ters were used. One may also expect large un-certainties in NTCP estimation for the lung and heart.
MRHS Tangential
Mean dose V13Gy Mean dose V13Gy
Left 0.022 0.049 0.027 0.049
Right 0.041 0.090 0.048 0.072
Table 1. Mean values of the NTCP for both techniques.
Model TD50 m
V13Gy 62–107 0.31–0.51
MD 27–42 0.36–0.54
The risk of lung injury is higher for irradiation on the right side (t test for the average value of NTCP in the group of patients irradiated on the left and right side, p<0.001). On the left side the irradiated volume of the lung with a high dose is smaller, because of the position of the heart. On the left side for the MRHS technique for all pa-tients the risk is very small. For 23 of 25 papa-tients the NTCP is smaller than 0.03. For the tangen-tial technique, the average value of the risk in the group of patients is close to the risk for the MRHS technique. For one patient the NTCP is close to 0.05. Both techniques seem to be very safe. Gagliardi et al. published data of clinical in-cidence of lung complications for 138 patients treated with the RHS technique [9]. The clin-ical incidence was 22.0% (NTCP=0.22), which is much higher than the value obtained in this work. In this paper, there were no details con-cerning the technique so it is diffi cult to com-pare dose distributions for the RHS and MRHS technique used in our case. The individually de-signed bolus applied in the MRHS technique diminishes the dose delivered to the lung and decreases the NTCP. In the same paper for a group of patients treated with the tangential technique the NTCP was 0.0018. This result is close to the result obtained in this work. Marks reported a 2.6% risk of clinical pneumonities in patients treated with so-called partially wide tan-gent fi elds [22]. The NTCP for the lung for left-sided patients calculated by Pierce for the RHS technique was 0.05, which is almost 0.03 larg-er than in this work [23]. The difflarg-erence may be attributed to the additional preventing in-fl uence of the individually designed bolus. For right-sided tumours the NTCP is higher. The average value of the NTCP in the group of pa-tients for the MRHS and tangential techniques is 0.041 and 0.048 respectively. For the tangen-tial technique for 12 patients the NTCP is larger than 0.05. For the MRHS technique the NTCP is larger than 0.05 for only 3 patients. For irra-diation on both sides, there is a very high corre-lation between the mean physical dose and bi-ological dose for the MRHS techniques. Also a very high correlation was obtained for the tan-gential technique but because the dose distribu-tions were calculated based on the CT made not in the typical treatment position for this tech-nique it is likely that the relationship between the mean physical and biological dose would be slightly different. Therefore, the author decided not to present these data. The biological dose
with the a/b model with the a/b parameter of
3Gy may be calculated from:
Meanbiol = 1.034·Meanphysical – 3,015 for the MRHS technique for the left side
Meanbiol = 0.990·Meanphysical – 1,350 for the MRHS technique for the right side
The relationship is a straight line but not going through the origin, so using it for doses much smaller than the smallest mean dose value in Figures 8 and 9 should be done with special cau-tion. The correlations were highly signifi cant (t test, p<0.0001).
C
ONCLUSIONSFor patients irradiated on the left side, the MRHS technique enables smaller heart toxicity. The risk of lung injury is similar for both techniques and sides. However for some patients irradiated on the right side in the case of the tangential technique the risk of lung injury may be larger than 5%. For the MRHS and tangential techniques there is a
very high correlation between V30Gy and NTCP
and between the physical mean dose and the
bi-ological dose. The relationship between V30Gy and
NTCP enables very fast estimation of the risk of heart injury. The relationship between the mean dose and biological dose enables easy calculation of the biological mean dose, which is an input pa-rameter for calculation of NTCP for the lungs. For the tangential techniques these correlations should be confi rmed based on the dose distribu-tions calculated with CT data acquired in the treat-ment position used for this technique.
R
EFERENCES:
1. Overgaard M, Hansen PS, Overgaard J et al: Postoperative radiotherapy in high-risk premeno-pusal women with breast cancer who received ad-juvant chemotherapy. N Engl J Med, 1997; 337: 949–55
2. Favourable and unfavourable effects on long-term survival of radiotherapy for early cancer: an over-view of the randomized trials. Early Breast Cancer Trialists’ Collaborative Group. Lancet, 2000; 335: 1757–70
3. Locoregional Radiation Therapy in Patients With High-Risk Breast Cancer Receiving Adjuvant Chemotherapy: 20-Year Results of the British Columbia Randomized Trial. J Nat Cancer Institute, 2005; 97: 116–26
4. Pierce LJ, Butler JB, Martel MK et al: Postmastectomy radiotherapy of the chest wall: dosimetric compari-son of common techniquee. Int J Radiat Biol Phys, 2002; 52: 1220–30
5. Host H, Brennhovd I, Loeb M: Postoperative radi-otherapy in breast cancer – long term results from Oslo study. Int J Radiat Oncol Biol Phys, 1986; 12: 727–32
6. Cuzic J, Steward H, Rutqvist LE et al: Cause-specif-ic mortality in long-term survivors of breast cancer who participated in trials of radiotherapy. J Clin Oncol, 1994; 12: 447–53
7. Hurkmans CW, Borger JH, van der Horst A et al: Cardiac and lung complication probabilities after breast cancer irradiation. Radioth Oncol, 2000; 55: 144–51
8. Kwa SL, Lebesque JV, Theuws JCM et al: Radiation pneumonitis as a function of mean lung dose: an analysis of pooled data of 540 patients. Int J Radiat Oncol Biol Phys, 1998; 42: 1–9
9. Gagliardi G, Bjohle J, Lax I et al: Radiation pne-unomities after breast cancer irradiation: analy-sis of the complication probability using the rela-tive seraility model. Int J Radiat Oncol Biol Phys, 2000; 46: 373–81
10. Hardman PDJ, Tweedale PM, Kerr GR et al: Radiation pneumonities following radiotherapy to thr breast cancer: A retrospective study. (Abstr.) Radiother Oncol, 1994; 32: S15
11. Seppenwoolde Y, Lebesque JV, De Jaeger K et al: Comparing different NTCP models that predict the incidence of radiation pneumonitis. Int J Radiat Oncol Biol Phys, 2003; 55: 724–35
12. Gagliardi G, Lax I, Soderstrom S et al: Prediction of excess risk of long-term cardiac mortality af-ter radiotherapy of stage I breast cancer. Radioth Oncol, 1998; 46: 63–71
13. Pezner RD, Lipsett JA, Forell B et al: The reverse hockey stick technique: postmastectomy radiation therapy for breast cancer patients with locally ad-vanced tumor presentation or extensive loco-re-gional recurrence. Int J Radiat Oncol Biol Phys, 1989; 17(1): 191–7
14. Hancock SL, Tucker M, Hoppe RT: Factors affect-ing late mortality from heart disease after treatment
of Hodgkin’s disease. J Am Med Assoc, 1993; 16: 1949–55
15. Gagliardi G, Lax I, Ottolenghi A et al: Long term cardiac mortality after radiotherapy of breast can-cer – Application of the relative seriality model. Br J Radiol, 1996; 69: 839–46
16. Sixel KE, Aznar MC, Ung YC: Deep inspiration breath hold to reduce irradiation heart volume in breast cancer patients. Int J Radiat Oncol Biol Phys, 2001; 49: 199–204
17. Remouchamps VM, Letts N, Vicini FA et al: Initial clinical experience with moderate deep-inspira-tion breath hold using and active breathing con-trol device in the treatment of patients with the left-sided breast cancer using external beam radi-otherapy. Int J Radiat Oncol Biol Phys, 2003; 56: 704–15
18. Buchholz TA: Internal mammary lymph nodes: to treat or not to treat. Int J Radiat Oncol Biol Phys, 2000; 46: 801–3
19. Das IJ, Cheng EC, Freedman G et al: Lung and heart volume analyses with CT simulator in radia-tion treatment of breast cancer. Int J Radiat Oncol Biol Phys, 1998; 42: 11–9
20. Wong JW, Purdy JA: On methods of inhomogene-ity corrections for photon transport. Med Phys, 1990; 17: 807–14
21. Moiseenko V, Battista J, Van Dyk J: Normal tis-sue complication probabilities: dependence on choice of biological model and dose-volue histo-gram reduction scheme. Int J Radiat Oncol Biol Phys, 2000; 46: 983–93
22. Marks LB, Clough R, Fan M et al: Radiation (RT)-induced pmeumonities following tangential breast/ chest wall irradiation. (Abstract) Int J radiat Oncol Biol Phys, 2000; 48: 294
23. Pierce LJ, Butler JB, Martel MK et al: Post-amastectomy radiotherapy of the chest wall dosi-metric comparison of common techniques. Int J Radiat Oncol Biol Phys, 2002; 55: 1220–30