Laboratory for Atmospheres
2006 Technical Highlights
NASA/TM—2007–214150
Teams for the MISR and CERES instruments did not record data for a full minute on Sunday, June 4, 2006 as NASA’s Terra and
Aqua satellites flew over Goddard Space Flight Center in Greenbelt, MD. Likewise, the POLDER instrument aboard the French Space Agency’s (CNES) PARASOL satellite and a global network of upward-looking sensors (called sun photometers) within NASA’s Aerosol Robotic Network (AERONET) remained inactive during that same span. Each of these instruments observed a moment of data “silence” in honor of Dr. Yoram J. Kaufman. A pioneering climate researcher, Kaufman died on Wednesday, May 31, from injuries he received in a collision with a car while biking near the NASA Goddard campus on May 26.
The images showcased on our cover pay a respectful tribute to Yoram and the legacy he left behind for the Earth science community and mankind itself. These images are a small, yet powerful sample of his contributions and foci.
Yoram will be remembered as a brilliant scientist, a charismatic leader, and a positive influence within NASA. He collaborated with many scientists around the world in helping to advance our understanding of Earth’s climate system. In the days before his untimely death, Yoram was not yet aware that he had been selected by the American Meteorological Society to receive its prestigious Verner E. Soumi Award, which is granted to one individual each year in recognition of highly significant technological achievement in the atmospheric (or related) sciences. We are deeply saddened to lose a valued friend, mentor and leader, and we are proud of Yoram’s considerable accomplishments.
Cover Images Top Left
The global aerosol system with the same color scheme as Image 3, but plotted on a different global projection. Blue colors denote low aerosol optical depth. Greenish tints and reddish tints of increasing intensity denote increasing aerosol optical depths of coarse mode and fine mode aerosols, respectively. The top panel is from aerosol retrievals derived from Terra-MODIS data, and the bottom panel from simulations of the GOddard Chemistry Aerosol Radiation and Transport (GOCART) Model.
Top Right
Satellite image acquired at 12:00 UTC (Universal Coordinated Time) on August 25, 2004 by the Moderate Resolution Imaging Spectroradiometer (MODIS) sensor aboard the Earth Observing System (EOS) Terra satellite, and provided courtesy of the MODIS Rapid Response team. The image shows a huge yellowish-brown dust plume rising from the Sahara desert. The dust plume traverses parts of the Canary Islands, heading north. After approximately 1,000 km, it changes direction and heads west toward North America, but then, almost above the region of the Azores, something spectacular happens: the dust apparently begins to interact with clouds.
Bottom Left
A recirculating Saharan dust plume observed by MODIS from the Aqua satellite. True color composite (top panel), total aerosol optical thickness (bottom left panel), and fine mode optical thickness (bottom right panel)
These images of recirculating Saharan dust aerosol were retrieved by MODIS aboard Aqua, on March 6, 2004. Within the true color composite image (top panel), the dust is obviously sand colored, while clouds are white. By observing reflected sunlight in visible and longer wavelengths, MODIS is able to derive quantitative estimates of total aerosol optical thickness (a measure of aerosol concentration), and fine mode weighting (to differentiate between dust and other aerosol types). These quantities are represented by the two bottom panels. An optical thickness of 1.0 means that the aerosol obscures about two-thirds of the direct sunlight from reaching Earth’s surface. A fine mode weighting less than 0.5 implies that dust is present. Areas in black are either masked by clouds, or are not observed by the satellite. Land or ocean surfaces too bright for aerosol detection (such as the desert or ocean sun glint) are shaded in gray. Due to the unique optical properties of dust aerosol (its brown color as shown in the top panel), MODIS is able to observe heavy dust over ocean sun glint. Here, the brown dust “finger” is quantitatively analyzed over the ocean sun glint.
Bottom Right
The global aerosol system derived from the data collected by MODIS aboard the Terra satellite. Coarse mode aerosols are generated by wind-driven processes and include sea salt and airborne desert dust. Fine mode aerosols are generated by combustion processes and include smoke and air pollution. The image is constructed from an eleven-day running average with a Gaussian weight centered on June 10, 2001. Gray regions indicate no retrievals in the eleven-day period.
National Aeronautics and
Space Administration
Goddard Space Flight Center Greenbelt, Maryland 20771
Laboratory for Atmospheres
2006 Technical Highlights
NASA Center for AeroSpace Information National Technical Information Service
7115 Standard Drive 5285 Port Royal Road
Hanover, MD 21076-1320 Springfield, VA 22161
Goddard Space Flight Center
Greenbelt, Maryland 20771
Laboratory Chief’s Summary Dear Reader:
Welcome to the Laboratory for Atmospheres’ 2006 Technical Highlights report. I thank you for your interest. We publish this report each year to describe our research and to summarize our accomplishments.
This document is intended for a broad audience. Our readers include colleagues within NASA, scientists outside the agency, science graduate students, and members of the general public. Inside are descriptions of our organization and facilities, our major activities and science highlights, and our education and outreach accomplishments for calendar year 2006.
The Laboratory’s approximately 230 scientists, technologists, and administrative personnel are part of the Earth Sciences Division in the Sciences and Exploration Directorate of the NASA Goddard Space Flight Center. The Laboratory for Atmospheres is continuing our mission of advancing knowledge and understanding of the Earth’s atmosphere.
Laboratory scientists continued having a productive year organizing and participating in international field campaigns, developing and refining instruments, analyzing data, expanding data sets, and improving models.
The Aura spacecraft, launched in July 2004 is an important component of the Lab’s science activities through validation campaigns and data analysis and modeling. These efforts are helping us better understand our home planet’s environment, and are increasing our knowledge of the complex chemistry of the atmosphere.
Several noteworthy events took place during 2006. Field campaigns contributing to Aura validation efforts
in 2006 began with the Costa Rica Aura Validation Experiment (CR-AVE) in January. Others were the Intercontinental Chemical Transport Experiment – Part B (INTEX-B) and the Megacity Initiative: Local and Global Research Observations (MILAGRO) in Mexico, Scout-O3 UV in Greece, and the Water Vapor Validation Experiment-Satellites/Sondes (WAVES) at the Howard University Research Campus in Beltsville, MD. These, and several other field campaigns in which Laboratory members participated are described in detail in Section 4, Major Activities. WAVES, which involved students from Howard University as well as Laboratory members, is
further discussed in Section 6, Education and Outreach.
As in previous years, Laboratory scientists garnered many top professional honors. The TOMS Science and Data Processing Team won the 2006 Pecora Award. This is given to individuals or groups that have made outstanding contributions toward understanding Earth through remote sensing. Pawan Bhartia accepted the award for the
team at the AGU fall meeting in San Francisco. Yoram Kaufman (deceased) won the 2006 Verner E. Suomi Award granted to individuals in recognition of highly significant achievement in the atmospheric or related oceanic and hydrologic sciences. The TOMS and UARS Teams were selected by the NASA Headquarters
Incentive Awards Board to receive Group Achievement Awards. These were presented in June at a ceremony held at Martin’s Crosswinds in Greenbelt, MD. These, and numerous other awards received by Laboratory members are described in Section 5.6 of this report.
The year 2006 was also a time to bid farewell to Geary Schwemmer, a highly valued instrument scientist who was a member of our Laboratory for many years. I am pleased to greet Jackie Haywood, our new administrative assistant, as the only new civil servant member of the Laboratory hired during 2006.
This report is being published in two media: a printed version, and an electronic version on our Laboratory for Atmospheres Web site, http://atmospheres.gsfc.nasa.gov. Check out our Web site. It continues to be redesigned to be more useful for our scientists, colleagues, and the public. We welcome comments on this 2006 report and on the material displayed on our Web site. Your comments may be submitted online. Please check out our Web site.
Finally, we note that a major tragedy struck the Laboratory during 2006. Yoram Kaufman, a friend and colleague whose outstanding service to our Laboratory spanned a period of more than 25 years, died on May 31 from injuries he received in a collision with a car while biking near Goddard on May 26. His death has been a traumatic experience for all of us in the Laboratory. The cover of this year’s report is dedicated to his work. His life and many accomplishments are reviewed immediately following this letter: Yoram Kaufman, A Retrospective.
It is to his memory that this report is respectfully dedicated. In memory of Yoram,
William K.-M. Lau,
Chief, Laboratory for Atmospheres, Code 613 March 2007
In Memory of Yoram J. Kaufman (1948–2006)
Dr. Yoram J. Kaufman, a senior atmospheric scientist in the Climate and Radiation Branch at NASA Goddard Space Flight Center, died on May 31 from injuries he received in a collision with a car while biking near Goddard on May 26.
Yoram was a highly regarded Goddard Senior Fellow in the Earth-Sun Exploration Division, now the Earth Sciences Division, who worked on a number of high-profile Earth Science missions developed by NASA or its international partners, especially CNES (French Space Agency) and ISA (Israel Space Agency).
He received his B.S. and M.S. degrees in physics from the Technion–Israeli Institute of Technology and his Ph.D. from the Tel-Aviv University in Israel. He came to NASA’s Goddard Space Flight Center in 1979 on a National Research Council resident research fellowship.
Among his many accomplishments, he served as the Project Scientist for NASA’s very successful Terra mission for four years, carrying this leadership role through its launch in December 1999 and into its first year of Earth observations. He developed methods for remote sensing of fires and aerosols, and he conducted field research on how emissions from fires play a major role in Earth’s climate system. Yoram wrote or co-authored over 200 scientific papers published in refereed journals, including several papers in
His recent work included theoretical and experimental research on atmospheric radiative transfer and remote sensing, including remote sensing of aerosol particles on a global scale, water vapor and their interaction with clouds, their impact on climate, and their relationship to their sources, for example, fires due to biomass burning in the tropics.
From 1993–1995 he conducted the Smoke/Sulfate, Clouds and Radiation (SCAR) field experiments in both Brazil and the U.S. to characterize smoke aerosol properties, their emissions from fires, and their effect on clouds and radiation.
He was a recipient of the NASA GSFC William Nordberg Award for Earth Science and has received the NASA Medal for Exceptional Scientific Achievement. In 2005, Yoram was presented the NASA GSFC Special Act Award, and was elected a Fellow of the American Meteorological Society. Additionally, during his career at NASA, he received six meritorious awards, including the Peer Award, Exceptional Achievement, Exceptional Performance, and Best Mentor Awards.
His colleagues at NASA and the worldwide Earth science community mourn the loss of an exceptional scientist, a compassionate man, a charismatic leader, and a true visionary with a passion for protecting our planet.
TABLe oF CoNTeNTS
Preface1. Introduction. . . 1
2. Staff, Organization, and Facilities . . . 3
2.1 Staff . . . 3
2.2 Organization . . . 4
2.3 Branch Descriptions . . . 4
2.4 Facilities . . . 6
3. Our Research and Its Place in NASA’s Mission . . . 7
4. Major Activities . . . . 9
4.1 Measurements . . . .9
4.2 Field Campaigns . . . 11
4.3 Validation Experiment Data Sets . . . 28
4.4 Data Analysis . . . 38
4.5 Modeling . . . 39
4.6 Support for NOAA Operational Satellites . . . . 44
4.7 Project Scientists . . . 46
4.8 Interactions with Other Scientific Groups . . . 47
4.9 Commercialization and Technology Transfer . . . 49
5. Highlights of Laboratory Activities in 2006 . . . 51
5.1 Mesoscale Atmospheric Processes Branch, Code 613.1 . . . 51
5.2 Climate and Radiation Branch, Code 613.2 . . . 54
5.3 Atmospheric Chemistry and Dynamics Branch, Code 613.3 . . . . 56
5.4 Laboratory Research Highlights . . . 59
5.5 Instrument Development. . . . 64
5.6 Awards . . . . 65
6. Education and Outreach . . . 67
6.1 Introduction . . . 67
6.2 Education. . . 67
6.3 Summer Programs . . . 69
6.4 University Education. . . 74
6.5 Open Lecture Series . . . 76
6.6 Public Outreach . . . 77
6.7 Project Outreach . . . 80
7. Acronyms . . . 83
Appendix 1. The Laboratory in the News . . . 89
Appendix 2. Refereed Articles . . . 105
PReFACe
The Technical Highlights for 2006 is the product of the efforts of all the members of the Laboratory for Atmo-spheres. Their dedication to advancing Earth Science through conducting research, developing and running models, designing instruments, managing projects, running field campaigns, and numerous other activities has produced many significant results. These can only be briefly highlighted in this report.
Production of this report has been guided by William K.–M. Lau, Chief of the Laboratory for Atmospheres who, along with Charles Cote, our Associate Chief, checked the report for accuracy, made suggestions regard-ing its content, and contributed to several sections. Walt Hoegy, editor for several years and now an emeritus member of the Laboratory, continued his association with this report by participating in teleconferences, and making valuable suggestions concerning the organization of this report and its content. Andy Negri contributed to sections of this report, gathered material for other sections and helped with its organization. Laura Rumburg gathered material for the Major Activities section, carefully proofread the report, and corrected many errors present in the initial drafts. Members of the administrative staff of the Laboratory and its branches: Caroline Maswanganye, Pat Luber, and Cathy Newman were instrumental in gathering material for the report and so-liciting the contributions of Lab members. Elaine Firestone performed the final formatting, turning this report into a polished product in a timely manner.
Goran Halusa, our Laboratory Web Master, created the final cover design and published this report on our Web site, http://atmospheres.gsfc.nasa.gov.
Mission: Advance Knowledge and Understanding of the Atmospheres, of the earth and other Planets
1.
INTRodUCTIoN
The Laboratory for Atmospheres (Code 613) is part of the Earth Sciences Division (Code 610), formerly the Earth–Sun Exploration Division, under the Sciences and Exploration Directorate (Code 600) based at NASA’s Goddard Space Flight Center in Greenbelt, Maryland.
In line with NASA’s Exploration Initiative, the Laboratory executes a comprehensive research and technology develop-ment program dedicated to advancing knowledge and understanding of the atmospheres of the Earth and other planets. The research program is aimed at understanding the influence of solar variability on the Earth’s climate; predicting the weather and climate of the Earth; understanding the structure, dynamics, and radiative properties of precipitation, clouds, and aerosols; understanding atmospheric chemistry, especially the role of natural and anthropogenic trace species on the ozone balance in the stratosphere and the troposphere; and advancing our understanding of physical properties of the Earth’s atmosphere.
The research program identifies problems and requirements for atmospheric observations via satellite missions. Laboratory scientists conceive, design, develop, and implement ultraviolet, infrared, optical, radar, laser, and lidar technology for remote sensing of the atmosphere. Laboratory members conduct field measurements for satellite data calibration and validation, and carry out numerous modeling activities. These modeling activities include climate model simulations, modeling the chemistry and transport of trace species on regional to global scales, cloud-resolv-ing models, and development of next-generation Earth system models. Interdisciplinary research is carried out in collaboration with other laboratories and research groups within the Earth Sciences Division, across the Sciences and Exploration Directorate and with partners in universities and other government agencies.
The Laboratory for Atmospheres is a vital participant in NASA’s research agenda. Our Laboratory often has relatively large programs, sizable satellite missions, and observational campaigns that require the cooperative and collaborative efforts of many scientists. We ensure an appropriate balance between our scientists’ responsibility for these large collaborative projects and their need for an active individual research agenda. This balance allows members of the Laboratory to continuously improve their scientific credentials.
Members of the Laboratory interact with the general public to support a wide range of interests in the atmospheric sciences. Among other activities, the Laboratory raises the public’s awareness of atmospheric science by presenting public lectures and demonstrations, by making scientific data available to wide audiences, by teaching, and by men -toring students and teachers. The Laboratory makes substantial efforts to attract new scientists to the various areas of atmospheric research. We strongly encourage the establishment of partnerships with Federal and state agencies that have operational responsibilities to promote the societal application of our science products.
This report describes our role in NASA’s mission, gives a broad description of our research, and summarizes our scientists’ major accomplishments during calendar year 2006. The report also contains useful information on human resources, scientific interactions, and outreach activities. This report is published in a printed version, and an electronic version on our Laboratory for Atmospheres Web site, http://atmospheres.gsfc.nasa.gov/.
2.
STAFF, oRGANIzATIoN, ANd FACILITIeS
2.1 Staff
The diverse staff of the Laboratory for Atmospheres is made up of scientists, engineers, technicians, adminis-trative assistants, and resource analysts, with a total staff of 228.
The civil servant composition of the Laboratory consists of 57 members; 50 are scientists, 2 are engineers, 3 administrative support, 1 a technical manager, and 1 a technician. Of the 52 civil servant scientists and
engi-neers, 92% hold doctoral degrees.
An integral part of the Laboratory staff is composed of onsite research associates and contractors. The research associates are primarily members of joint centers involving the Earth Sciences Division and nearby university
associations, e.g., the Joint Center for Earth Systems Technology (JCET), the Goddard Earth Sciences and Technology Center (GEST), and the Earth System Science Interdisciplinary Center (ESSIC), or are employed by universities with which the Laboratory has a collaborative relationship, such as George Mason University, University of Arizona, and Georgia Tech. Of the 76 research associates, 81% hold Ph.D.’s. The onsite contrac
-tors are a very important component of the staffing of the Laboratory. Out of the total of 89 onsite contrac-tors, 20% hold Ph.D.s. The makeup of our Laboratory, therefore, is 28% civil servants, 33% associates, and 39%
contractors.
The number of refereed publications (from 1992) and proposals (from 1997) written by Laboratory members
is shown in Figure 2.1. The number in each category is shown above the bars. The difference between the red and blue bars gives the number of papers that our scientists co-authored with outside scientists and is one measure of our extensive collaboration. The yellow bars show the number of proposals written in recent years and indicate an increasing percentage as a function of papers written. The reduced number of refereed papers in 2004 and 2005 are due in part to the loss of the Atmospheric Experiment Branch, which is no longer part of our Laboratory, to reduction in civil service scientists from attrition, and to the implementation of full cost accounting, which necessitates increased time spent on proposal writing.
Figure 2.1. Number of proposals and refereed publications by Laboratory for Atmospheres members over the years. The red bar is the total number of publications where a
Labora-tory member is the first author or co-author, and the blue bar is the number of publications where a Laboratory member is first author. Proposals submitted are shown in yellow.
2.2 organization
The management and branch structure for the Laboratory for Atmospheres at the end of 2006 is shown in Figure 2.2.
Figure 2.2. Laboratory for Atmospheres organization chart at the end of calendar year 2006.
2.3 Branch descriptions
The Laboratory has traditionally been organized into branches; however, we work on science projects that are becoming more and more cross-disciplinary. Branch members collaborate with each other within their branch, across branches and laboratories, and across divisions within the Directorate. Some of the recent cross- disciplinary research themes of interest in the Laboratory are the Global Water and Energy Cycle, Carbon Cycle, Weather and Short-Term Climate Forecasting, Long-Term Climate Change, Atmospheric Chemistry, and Aerosols. The employment composition of the Senior Staff Office (613) and the three branches is broken down by Civil Servant, Associate, and Contractor as shown in Figure 2.3.
A brief description is given for each of the Laboratory’s three branches. Later, in Section 5, the Branch Heads summarize the science goals and achievements of their branches. The branch summaries are supplemented by a selection of news items, publication lists, and samples of highlighted journal articles given in Appendices 1 through 3, respectively.
Mesoscale Atmospheric Processes Branch, Code 613.1
The mission of this Branch is to understand the physics and dynamics of atmospheric processes through the use of satellite, airborne, and surface-based remote sensing observations and model simulations. Development of advanced remote sensing instrumentation (primarily lidar and radar) and techniques to measure aerosols, clouds, water vapor and winds in the troposphere is an important focus. Key areas of investigation are cloud and precipitation systems (including aerosol/cloud interaction) and their environments, ranging from the scale of individual clouds and thunderstorms to mesoscale convective systems and cyclonic storms. The climate impacts at regional and global scales, e.g., El Niño Southern Oscillation (ENSO), are a major focus. State-of-the-art efforts involve coupling various NASA Goddard physical packages (microphysics, radiation, and land surface models) into a next generation weather forecast model (known as the weather and research forecast model or WRF), and implementing a mesoscale cloud-resolving model (Goddard Cumulus Ensemble Model) into a global model. In summary, the Branch focuses its research on all aspects of the atmospheric hydrologic cycle, its connections to the global energy cycle, and associated hazards, such as hurricanes, floods and landslides. The Branch plays a key science leadership role in satellite missions, such as the Tropical Rainfall Measurement Mission (TRMM) and the Geoscience Laser Altimeter System (GLAS) on ICESat. Similarly, we contribute to the formulation of new mission concepts, such as the Global Precipitation Mission (GPM). Participation in field campaigns such as the NASA African Monsoon Multidisciplinary Analysis (NAMMA), Costa Rica Aura Validation Experiment (CR-AVE), and the Calipso/CloudSat Validation Experiment (CC-VEx) continues to be a high priority. Further information about Branch activities may be found on the Web at http://atmospheres.gsfc.nasa.gov/meso/.
Climate and Radiation Branch, Code 613.2
The Climate and Radiation Branch has a threefold mission:
(1) to understand, assess, and predict climate variability and change, including the impact of natural forcing and human activities on climate now and in the future;
(2) to assess the impacts of climate variability and change on society; and
(3) to consider strategies for adapting to, and mitigating, climate variability and change.
To address this mission, a wide range of scales is studied, from the spatial microscales of nucleation processes to the Sun–Earth distance, and from microsecond to geologic time scales. Research focus areas include obser-vational and modeling studies of tropospheric aerosols, cloud processes, rainfall, solar radiation, and surface properties. Key disciplines are radiative transfer, both as a driver for climate studies and as a tool for the remote sensing of parameters of the Earth’s climate system; climate theory and modeling over the full range of scales; and the development of new methods for the analysis of climate data. Ongoing projects in cooperation with other NASA centers, government agencies, and with university partners include development and assessment of observational climate data records, incorporation of microphysical cloud-aerosol interactions in climate models, addressing gaps in the current climate observing system, development and deployment of new instruments, and planning for future space-based and in situ missions. Further information about Branch activities may be found at http://climate.gsfc.nasa.gov/.
Atmospheric Chemistry and Dynamics Branch, Code 613.3
The Atmospheric Chemistry and Dynamics Branch conducts research on remote sensing of atmospheric trace gases and aerosols from satellite, aircraft, and ground, and develops computer-based models to understand
and predict the long-term evolution of the ozone layer , changes in global air quality caused by human activity, and the interaction between atmospheric composition and climate change. The Branch develops and maintains research quality, long-term data sets of ozone, aerosols, and surface ultraviolet (UV) radiation for assessment of the health of the ozone layer and its environmental impact. It continues its long history of providing science leadership for NASA’s atmospheric chemistry satellites, such as the Total Ozone Mapping Spectrometer (TOMS) and Upper Atmosphere Research Satellite (UARS), and the recently launched Earth Observing System (EOS) Aura satellite, and works closely with the National Oceanic and Atmospheric Administration (NOAA) on ozone sensors on the operational weather satellites (NOAA-N), the National Polar Orbiting Environmental Satellite System (NPOESS), and the NPOESS Preparatory Project (NPP). The Aura satellite hosts four advanced atmo -spheric chemistry instruments designed to study the evolution of strato-spheric ozone, climate, and air quality. Analysis of Aura data will be the central focus of the Branch activities in the coming years. Modeling activities in the branch will continue to focus on simulations for the analysis of Aura data, and assessment of the impact of anthropogenic activity on the atmospheric composition and climate. Further information on Branch activities may be found on the Web http://atmospheres.gsfc.nasa.gov/acd/.
Branch Web sites may also be found by clicking on the branch icons at the Laboratory home page http://atmo-spheres.gsfc.nasa.gov/.
2.4 Facilities
Computing CapabilitiesComputing capabilities used by the Laboratory range from high-performance supercomputers to scientific workstations to desktop personal computers. Each Branch maintains its own system of computers, which are a combination of Windows, Linux, and Mac OS X computers. A major portion of scientific data analysis and manipulation, and image viewing is still done on Unix cluster machines with increasing amounts of data analysis and imaging done on single-user personal computers.
Lidar
The Laboratory has well-equipped facilities to develop lidar systems for airborne and ground-based measure -ments of clouds, aerosols, methane, ozone, water vapor, pressure, temperature, and winds. Lasers capable of generating radiation from 266 nm to beyond 1,000 nm are available, as is a range of sensitive photon detectors for use throughout this wavelength region. Details may be found in the Laboratory for Atmospheres Instrument Systems Report, NASA/TP-2005-212783 which is also available on the Laboratory’s home page.
Radiometric Calibration and Development Facility
The Radiometric Calibration and Development Facility (RCDF) supports the calibration and development of instruments for ground- and space-based observations for atmospheric composition including gases and aero-sols. As part of the EOS calibration program, the RCDF provides calibrations for all national and international ultraviolet and visible (UV/VIS) spaceborne solar backscatter instruments, which include the Solar Backscatter Ultraviolet/Version 2 (SBUV/2) and TOMS instruments, and the European backscatter instruments flying on the Environmental Satellite (EnviSat) and Aura. The RCDF also provides laboratory resources for developing and testing of advanced spaceborne instruments being developed in the Laboratory for Atmospheres. In addition, ground-based sky-viewing instruments used for research and validation measurements of chemistry missions, such as Envisat and Aura, are also supported in the RCDF. The facility maintains state-of-the-art instrument radiometric test equipment and has a close relationship with the National Institute of Standards and Technol -ogy (NIST) for maintaining radiometric standards. For further information contact Scott Janz, Scott.J.Janz@ nasa.gov.
3.
oUR ReSeARCH ANd ITS PLACe IN NASA’S MISSIoN
The direction of our research effort is influenced by NASA’s overall program, outlined in the Agency’s 2006 Strategic Plan available at http://www.nasa.gov/pdf/142302main_2006_NASA_Strategic_Plan.pdf. The new vision for space exploration resulted in the transformation of NASA’s goals and produced a reorganization of NASA Headquarters and the NASA Centers during 2004 and 2005. The former seven strategic enterprises have been transformed into four directorates: Science Mission Directorate, Space Operations Mission Directorate, Exploration Systems Mission Directorate, and Aeronautics Mission Directorate. These directorates are charged with accomplishing six goals described in the 2006 Strategic Plan.
Following NASA Headquarters, Goddard Space Flight Center has reorganized and formed one Directorate combining Earth and Space Science into the Sciences and Exploration Directorate. The four Divisions under the new Sciences and Exploration Directorate are Earth Sciences (Code 610), Heliophysics Science (Code 670), Solar System Exploration (Code 690), and Astrophysics Science (Code 660). The Laboratory for Atmospheres is under the Earth Sciences Division (ESD). Our three Branches, Mesoscale Atmospheric Processes, Climate and Radiation, and Atmospheric Chemistry and Dynamics will continue their strong programs of research in Earth Sciences and in this way, will make significant contributions to the President’s Exploration Initiative. In October 2005, the Earth–Sun Exploration Division, now ESD, published a strategic plan outlining the Division’s mission and goals in greater detail than the Agency plan http://webserv.gsfc.nasa.gov/images/esappdocs/ESED-stratplanv2.pdf. The Laboratory’s research is guided by the goals contained in these plans. The remainder of this section outlines the connection of our research to NASA’s mission and strategic plans.
The Laboratory for Atmospheres has a long history (40+ years) in Earth Science and Space Science missions studying the atmospheres of Earth and the planets. The wide array of our work reflects this dual history of atmospheric research from:
(1) the early days of the Television Infrared Observation Satellite (TIROS) and Nimbus satellites with emphasis on ozone, Earth radiation, and weather forecasting; and
(2) the thermosphere and ionosphere satellites, the Orbiting Geophysical Observatory (OGO), the Explorer mis -sions, and the Pioneer Venus Orbiter, to the more recent Galileo and Cassini missions and the current Earth Observing System (EOS) mission.
A current focus is on global climate change and one goal is to increase the accuracy and lead-time with which we can predict weather and climate change. The Laboratory for Atmospheres conducts basic and applied research in the cross-disciplinary research areas outlined in Table 3.1, and Laboratory scientists focus their efforts on satellite mission planning, instrument development, data analysis, and modeling
Table 3.1: Science themes and our major research areas.
Science Themes Major Research Areas
Aerosol
Atmospheric Chemistry Carbon Cycle
Climate Change
Global Water and Energy Cycle
Weather and Short-term Climate Forecasting
• Aerosol
• Atmospheric Chemistry and Ozone • Atmospheric Hydrologic Cycle
• Carbon Cycle
• Clouds and Radiation
• Climate Variability and Prediction • Mesoscale Processes
• Precipitation Systems • Severe Weather
• Chemistry-Climate Modeling
• Global and Regional Climate Modeling • Data Assimilation
• Tropospheric Winds
Our work can be classified into four primary activities or products: measurements, data sets, data analysis, and modeling. Table 3.2 depicts these activities and some of the topics they address.
Table 3.2: Laboratory for Atmospheres science activities.
Measurements Data Sets Data Analysis Modeling
Aircraft Balloon Field campaigns Ground Space Assimilated products Global precipitation MODIS cloud and aerosol TOMS aerosol
TOMS surface UV TOMS total ozone TOVS Pathfinder
TRMM Global precipita-tion products
TRMM validation prod-ucts
Aerosol cloud climate interaction
Aerosol
Atmospheric hydrologic cycle
Climate variability and climate change
Clouds and precipitation Global t e mp e r at u re trends
Ozone and trace gases Radiation
UV-B measurements Validation studies
Atmospheric chemistry Clouds and mesoscale Coupled climate–ocean Data assimilation Data retrievals General circulation Radiative transfer Transport models Weather and climate
Classification in the four major activity areas: measurements, data sets, data analysis, and modeling, is somewhat artificial, in that the activities are strongly interlinked and cut across science priorities and the organizational struc -ture of the Laboratory. The grouping corresponds to the natural processes of carrying out scientific research: ask the scientific question, identify the variable needed to answer it, conceive the best instrument to measure the variable, generate data set, analyze the data, model the data, and ask the next question.
4.
MAjoR ACTIvITIeS
The previous section outlined the science activities pursued in the Laboratory for Atmospheres. This section presents summary paragraphs of some of our major activities in measurements, field campaigns, data sets, data analysis, and modeling. In addition, we summarize the Laboratory’s support for NOAA’s remote sensing requirements. The section concludes with a listing of project scientists, and a description of interactions with other scientific groups.
4.1 Measurements
Studies of the atmosphere of Earth require a comprehensive set of observations, relying on instruments borne on spacecraft, aircraft, balloons, or those that are ground-based. Our instrument systems 1) provide informa -tion leading to basic understanding of atmospheric processes, and 2) serve as calibra-tion references for satellite instrument validation.
Many of the Laboratory’s activities involve developing concepts and designs for instrument systems for space-flight missions, and for balloon-, aircraft-, and ground-based observations. Airborne instruments provide critical in situ and remote measurements of atmospheric trace gases, aerosol, ozone, and cloud properties. Airborne instruments also serve as stepping-stones in the development of spaceborne instruments, and serve an important role in validating spacecraft instruments.
Table 4.1 shows the principal instruments that were built in the Laboratory, for which a Laboratory scientist has had responsibility as Instrument Scientist, or for which Laboratory scientists are responsible for algorithm development, calibration and data analysis. The instruments are grouped according to the scientific discipline each supports. Table 4.1 also indicates each instrument’s deployment—in space, on aircraft, balloons, on the ground, or in the laboratory. In most cases, details are presented in a separate Laboratory technical publication, the Instrument Systems Report, NASA/TP-2005-212783 which is also available on the Laboratory’s home page,
http://atmospheres.gsfc.nasa.gov/.
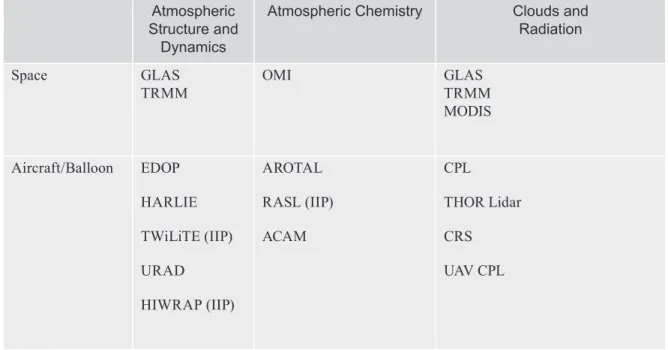
Table 4.1: Principal instruments supporting scientific disciplines in the Laboratory for Atmospheres.
Atmospheric
Structure and
Dynamics
Atmospheric Chemistry Clouds and Radiation Space GLAS TRMM OMI GLAS TRMM MODIS Aircraft/Balloon EDOP HARLIE TWiLiTE (IIP) URAD HIWRAP (IIP) AROTAL RASL (IIP) ACAM CPL THOR Lidar CRS UAV CPL
Ground/ Laboratory/ Development SRL GLOW STROZ LITE AT Lidar Brewer UV Spectrometer KILT Pandora Spectrometers L2-SVIP GeoSpec (IIP) MPL COVIR SMART COMMIT
ACAM Airborne Compact Atmospheric Mapper
AROTAL Airborne Raman Ozone, Temperature, and Aerosol Lidar
ATL Aerosol and Temperature Lidar
COMMIT Chemical, Optical, and Microphysical Measurements of In situ Tropopause
COVIR Compact Visible and Infrared Radiometer
CPL Cloud Physics Lidar
CRS Cloud Radar System
EDOP ER-2 Doppler Radar
GeoSpec Geostationary Spectrograph
GLAS Geoscience Laser Altimeter System
GLOW Goddard Lidar Observatory for Winds
HARLIE Holographic Airborne Rotating Lidar Instrument Experiment
HIWRAP High-Altitude Imaging Wind and Rain Airborne Profiler
IIP Instrument Incubator Program
KILT Kiritimati Island Lidar Trailer
L2-SVIP Lagrange-2 Solar Viewing Interferometer Prototype
MODIS Moderate Resolution Imaging Spectroradiometer
MPL Micro-Pulse Lidar
OMI Ozone Monitoring Instrument
RASL Raman Airborne Spectroscopic Lidar
SMART Surface-sensing Measurements for Atmospheric Radiative Transfer
SRL Scanning Raman Lidar
STROZ LITE Stratospheric Ozone Lidar Trailer Experiment
THOR cloud THickness from Offbeam Returns
TRMM Tropical Rainfall Measuring Mission
TWiLiTE Tropospheric Wind Lidar Technology Experiment
UAV Unmanned Aerial Vehicle URAD Unmanned Aerial Vehicle Radar
4.2 Field Campaigns
Field campaigns use the resources of NASA, other agencies, and other countries to carry out scientific experi -ments, to validate satellite instru-ments, or to conduct environmental impact assessments from bases throughout the world. Research aircraft, such as the NASA ER-2, DC-8, and WB-57F serve as platforms from which remote sensing and in situ observations are made. Ground-based systems are also used for soundings, remote sensing, and other radiometric measurements. In 2006, Laboratory personnel supported eleven such activities as scientific investigators, or as mission participants, in the planning and coordination phases.
4.2.1 Aura validation experiment (Ave)
AVE is a measurement campaign designed to acquire correlative data needed for the validation of the Aura satellite instruments. Aura was launched in July 2004 with four instruments: the Ozone Monitoring Instrument (OMI), Tropospheric Emission Spectrometer (TES), Microwave Limb Sounder (MLS), and the High Resolution Dynamics Limb Sounder (HIRDLS). Aura has three science objectives: 1) analyze the recovery of the ozone layer, 2) assess air quality problems, and 3) determine how the Earth’s climate is changing.
During 2004 and 2005 three AVE missions were flown using the NASA WB-57F and NASA DC-8 aircraft. These missions have continued in 2006 with the Costa Rica Aura Validation Experiment (CR-AVE).
4.2.2 Costa Rica Aura validation experiment (CR-Ave)
The Costa Rica Aura Validation Experiment (CR-AVE), running from January 15 to February 14, 2006 was the fourth in a series of similar NASA-led science missions to acquire high quality measurements of the tropical atmosphere to validate data from NASA’s Aura satellite. Such experiments allow scientists to directly measure the transport of gases and aerosols in the lower atmosphere (or troposphere) and their exchange with the lower stratosphere. This data is then compared with that from Aura to enable improved modeling of global-scale air quality and climate change predictions.
The fourth AVE campaign was staged in Costa Rica in January and February 2006. The NASA WB-57F carried a total of 29 instruments in two separate payloads. The first payload was composed of both in situ and remote sensing instruments. A total of six flights were conducted that were precisely timed to coincide with the Aura overpass. For more information, contact Paul A. Newman ([email protected]).
Figure 4.1. Photograph of a thin layer of cirrus clouds taken from the NASA WB-57F from an altitude of 60,000 feet on January 14, 2006. This extensive but thin layer of cirrus is not visible from the ground. Photo by John Bain (NASA JSC).
4.2.2.1 Cloud Physics Lidar (CPL)
In January 2006, the CPL instrument was part of the Costa Rica Aura Validation Experiment (CR-AVE). This experiment was based in San Jose, Costa Rica for the express purpose of validating instruments onboard the Aura satellite. Seven science flights were conducted to acquire high quality test data for the CloudSat and CALIPSO satellites using well characterized simulators for the primary satellite sensors. CloudSat and CALIPSO were subsequently launched in spring of 2006. For CR-AVE, the CPL was operated on the WB-57F aircraft. For more information on the CPL instrument, or for access to CPL data, visit http://cpl.gsfc.nasa.gov/ or contact Matthew McGill ([email protected]).
4.2.2.2 Cloud Radar System (CRS)
The CRS is a Doppler radar developed for autonomous operation in the NASA ER-2 high-altitude aircraft and for ground-based operation. It was flown for the first time during CR-AVE on the WB-57F aircraft. The goals for CPL and CRS were to prepare a remote sensing package for the CloudSat and CALIPSO satellites after their launch in Spring 2006. For further information on the CRS visit http://rsd.gsfc.nasa.gov/912/edop/crs_id_de-scription.htm or contact Gerry Heymsfield, [email protected].
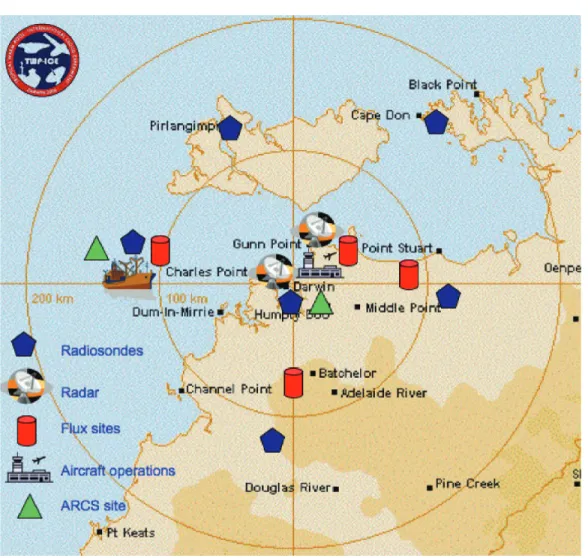
4.2.3 Tropical Warm Pool–International Cloud experiment (TWP-ICe)
Figure 4.2. The map shows the extensive ground network of cloud sensing radar. Lidar, and passive instruments were located on a ship as well as several ground sites throughout the TWP-ICE experimental domain.
David Starr, Code 613.1, served on the Mission Management Team for TWP-ICE that took place in the area around Darwin, Australia in early 2006. Andy Ackerman, and Anne Fridlind, both Code 611 (GISS), participated in the in-field theory team. David Starr contributed to the daily mission planning and real-time operational execution of this complex airbone experiment which involved a fleet of 5 aircraft. The aim of the experiment was to examine convective cloud systems from their initial stages through to the decaying and thin high-level cirrus and measure their impact on the environment. The experiment design included an unprecedented array of soundings, research-grade volumetric radar coverage, and other information to support cloud-resolving and other modeling studies as well as in situ and remote sensing airborne observation platforms. This large multi-agency experiment involved substantial contributions from the following entities:
• U.S. Department of Energy, ARM Program;
• U.S. National Aeronautics and Space Administration (NASA); • Australian Bureau of Meteorology (BoM); and
• Commonwealth Scientific and Industrial Research Organization (CSIRO)
A number of universities and a group sponsored by the European Union also contributed instrumentation to the experiment.
A key component of the field campaign was the fleet of aircraft including the Dornier for sampling aerosols and chemistry in the boundary layer, the Dimona for flux measurements in the boundary layer, the Egrett and Proteus for high-altitude in situ and remote sensing measurements, and a Twin Otter which carried lidar and radar for CloudSat and CALIPSO validation studies. The Egrett and Dornier comprised the European Union sponsored AC -TIVE (Aerosol and Chemical Transport In tropical conVEction) component of TWP-ICE. The Proteus and Twin Otter were sponsored by ARM with support from the CloudSat and CALIPSO projects. Together, these aircraft collected measurements of cloud properties and the meteorological environment from the planetary boundary layer up to 15 km, often in-anvil at the upper levels. The airborne sampling was coordinated with observations from cloud sensing radar, lidar and passive instruments located at the ARM facility site, operated at Darwin by the BoM, and on a ship in the Timor Sea approximately 100 km northeast of Darwin. The experiment was a great success with data collected for a variety of convective systems and in upper tropospheric clouds at various stages of their lifecycle from freshly generated to quite aged. Cirrus outflow from both monsoon systems and highly continental systems were extensively sampled. In November, a post-experiment science workshop was held at GISS. The reported data quality was quite good and significant progress was being made on a number of key science issues such as characterizing differences in microphysical properties of cirrus based on age and nature of convective source.
For further information contact David Starr, [email protected].
4.2.4 Intercontinental Chemical Transport experiment – Part B (INTeX-B) and
Megacity
Initiative: Local and Global Research observations (MILAGRo)
The main mission goals of INTEX-B were to study the export of pollutants out of the Mexico City region, to study the transport of pollutants from Asia, across the Pacific Ocean to North America, and to provide data for the validation of Aura instrument products. The mission ran from March to May, 2006 and included local flights from three locations: Houston, TX, Honolulu, HI, and Anchorage, AK. The Houston, TX deployment coincided with the MILAGRO campaign in Mexico (see below). For mission details see: http://www-air.larc. nasa.gov/missions.htm.
Ken Pickering (Code 613.3) and Tom Kucsera (SSAI) developed, produced, and interpreted a set of trajectory- and satellite-based forecast products to aid in flight planning for the INTEX-B experiment. These products were run for all three deployments and were interpreted and presented to the flight planning team in the field.
Products included the OMI Aerosol Index (AI) observations and a forecast product predicting aerosol exposure based on a field of back trajectories run through the AI data. Lightning observations from a global network and a trajectory-based forecast of exposure to lightning NOx emissions were also made available to the team. Other
products included forecast meteorological fields from Goddard’s Global Modeling and Assimilation Office (GMAO), a reverse-domain-fill forecast of potential vorticity, and maps of total column ozone and tropospheric NO2 from OMI.
The Code 613.3 AROTAL instrument was deployed on the NASA/UND DC-8 aircraft (UND is University of North Dakota) for the INTEX-B mission. The AROTAL instrument makes vertical profile measurements of ozone, aerosols and temperature above the aircraft. For further information on this aspect of INTEX-B contact Tom McGee ([email protected]).
Lorraine Remer (Code 613.2) and D. Allen Chu (JCET/UMBC) joined the forecast team for INTEX-B, preparing satellite imagery and analysis for flight planning. Their particular specialty was the forecast of aerosol events using MODIS data. During the deployment in Anchorage, AK they noted several Asian dust events entering the Pacific study area and also an interesting biomass burning event from Siberia that moved over Scandinavia and into the Arctic. During the analysis phase Remer and Chu will use data collected during the deployments to make estimates of aerosol radiative effects and forcing.
Megacity Initiative: Local And Global Research Observations (MILAGRO) Mexico City, March 2006
The MILAGRO field campaign represents an umbrella initiative that encompassed simultaneous campaigns from NCAR, ASP/DOE, MIT, NASA and several Mexican agencies and universities. The campaign took place during March 2006, centered on Mexico City, but extended throughout central Mexico. The NASA component of MILAGRO was the first phase of INTEX-B. The objectives of the campaign were to characterize the pol -lutant exports of the world’s second largest megacity (18 million people). Ground-based, airborne, and satellite measurements complemented an extensive modeling effort.
The Laboratory, in collaboration with UMBC, participated in making measurements on the ground and as part of NASA’s payload on the J31 aircraft (PI: P. Russell of NASA/Ames). The composite image, Fig. 4.3, shows the Sky Research Jetstream-31 (J31) as it was deployed during the MILAGRO experiment in Mexico during March 2006.
The objectives of MILAGRO included characterizing the pollutant plume that originates in the greater Mexico City area and the evolution of that plume as it exits the basin. The J31 was just one of six aircraft participating in the experiment, along with three main ground sites, several auxiliary ground sites and several tethered bal-loons. Five of the aircraft, including the J31, were based in Veracruz on the east coast of Mexico.
The J31 was unique in that it was equipped to measure solar energy and how that energy is affected by the pollu -tion and the Earth’s surface. The aircraft carried six instruments. The Ames Airborne Tracking Sunphotometer-14 (AATS-14) provided total column spectral aerosol optical depth and precipitable water vapor, and vertical profiles of aerosol extinction and water vapor density. The Research Scanning Polarimeter (RSP) measured the spectral and polarized radiance from the surface and atmosphere beneath the plane. The Solar Spectral Flux Radiom-eter (SSFR) measured the upwelling and downwelling spectral hemispheric irradiance. The Cloud Absorption Radiometer (CAR) measured spectral and angular distribution of scattered light by clouds and aerosols. It also provided bidirectional reflectance of various surfaces, and imagery of cloud and Earth surface features. The Position and Orientation System (POS) and the Met Sensors and Navigation Data System (NavMet) provided useful information on aircraft position, orientation and meteorological variables.
Figure 4.3. Remote Sensing Aircraft, J31, during MILAGRO. The images starting from the top left show the heavily polluted environment that was encountered in the basin north of Mexico City on March 19, 2006., the J31 scientists and engineers waiting to board the aircraft, the flight tracks of all of the J31’s flights during MILAGRO, and instrument loca -tions on the aircraft. Images were provided by Phil Russell (NASA/Ames) who was PI of the aircraft, Kirk Knobelspiesse (Columbia Univ.) and Dominik Cieslak (UMBC).
The Laboratory’s participation was led by Lorraine Remer, J. Vanderlei Martins (JCET/UMBC), Michael King, and Charles Gatebe (GEST/UMBC). Our particular interests were to characterize the absorption properties of the aerosol, the extinction of the aerosol as a function of humidity, the bidirectional reflectance of the surface, especially the highly urban surface of Mexico City, and to test a new remote sensing technique for deriving aerosol absorption over ocean sun glint. We deployed instrumentation and team members at one of the MILA-GRO sites to the northeast of Mexico City, but still within the caldera. We also deployed instrumentation at three sites along the Mexican east coast. The J31 flew 14 missions from the city of Veracruz, some over the ocean to intercept the outgoing pollution plume and some over Mexico City to characterize the pollution near the source and to characterize the bidirectional reflectance distribution function (BRDF) of the urban landscape.
In Fig. 4.4, the photograph in the background shows aged pollution from Mexico City over a ground-based station in the city of Pachuca, Hidalgo State, which is located about 150 km north of Mexico City. The relatively low visibility, fading the mountains in the background, is a result of the scattering of solar radiation by the aerosol particles in suspension in the atmosphere. These particles scatter and absorb solar radiation contributing to cooling the Earth’s surface and potentially heating some atmospheric layers. These aerosols also act as cloud condensation nuclei, initiating the formation of cloud droplets in the Earth’s atmosphere. The graph shows an example of the interaction between these aerosols and water vapor in the atmosphere measured with a humidi-fied scattering/extinction cell during the March 2006 MILAGRO Field Experiment
Figure 4.4. Growth of Mexico City aerosols vs. relative humidity superimposed on a picture of background pollution .
For further information contact Ken Pickering, [email protected] or Lorraine Remer, Lorraine. [email protected]. For additional information on MILAGRO and the CAR instrument visit http://www.eol. ucar.edu/projects/milagro/ and http://car.gsfc.nasa.gov/data/.
4.2.5 Biomass-burning Aerosols in South east Asia: Smoke Impact Assessment Field
experiment (BASe-ASIA)
Biomass burning has been a regular practice for land clearing and land conversion in many countries, especially those in Africa, South America, and Southeast Asia. Southeast Asia, home to more than 60% of the world’s population, is one of the fastest growing regions in population density and economic activity and is experiencing vital changes in land use and land cover. This leads to increases in fossil fuel, coal, and biomass burning with consequent increases in man-made aerosols in the atmosphere.
“Are Smoke Aerosols responsible for changing Cloud Life-Cycle and redistributing Fresh Water?Since light-absorbing particles (e.g., smoke, soot, or black carbon) warm the atmosphere, they reduce surface evapo-ration and cut off convection, essential parts of the hydrologic cycle.”
In the spring of 2006, a joint U.S.-Thailand research group conducted the BASE-ASIA pilot study, seeking to better understand regional aerosol radiation forcing on the Earth-Atmosphere system. Participants include sci-entists from the U.S., NASA GSFC Laboratory for Atmospheres, Univ. Hawaii, Univ. Maryland; from Thailand, Chulalongkorn University, Bureau of Royal Rainmaking and Agricultural Aviation; and many individuals from the regions. Accurately assessing the impact of smoke aerosols on aerosol-cloud interactions requires continuous observations from satellites and networks of ground-based instruments as well as dedicated field experiments utilizing aircraft and ground-based instruments. Figure 4.5 illustrates the operations of BASE-ASIA, including the utilization of NASA’s Terra, A-Train satellites and other satellite data sets in Southeast Asia, NASA GSFC
hyperspectral imagers (solar and thermal) flown aboard Thai’s rainmaking fleet (CASA-100 aircraft, based at Khora, Thailand), and GSFC’s SMART (Surface-sensing Measurements for Atmospheric Radiative Transfer) & COMMIT (Chemical, Optical, Microphysical Measurements of In situ Troposphere) mobile observatory (http://smart-commit.gsfc.nasa.gov/) and COPAA (Chemistry & Optical Properties of Absorbing Aerosols) facility from University of Hawaii deployed in the middle of agricultural fields at Phimai, Thailand. During the peak-burning season (e.g., February–March–April), a frequently observed phenomenon is smoke-induced clouds (Fig. 4.5), even in small-scale burning. On a cloud-free day (visually in the zenith direction), the temperature profiles (panel g, blue line for noontime, red for afternoon) often depict one (noontime) or multiple (afternoon) inversion layers. It may be that local biomass-burning practices are relatively more active in the afternoon, leading to elevated levels of light-absorbing aerosols in the boundary layer and a subsequent warming within such layers. A challenging task in understanding aerosol-cloud interactions is underway by combining these surface in situ and remote-sensing measurements, aircraft and satellite observations, together with modeling efforts. For further information, contact Si-Chee Tsay ([email protected]).
Figure 4.5. (a) Satellite image (Terra/MODIS for red, 0.66 µm; green, 0.55 µm; blue, 0.47 µm) depicts active fires (red dots) and extensive layer of haze/smoke aerosols over Southeast Asia. (b, c) A GSFC solar hyperspectral imager explores spectral and spatial features of biomass burning. (d) GSFC’s SMART-COMMIT mobile observatory was deployed in the middle of agricultural fields at Phimai, Thailand, from the pre-burning, peak-burning, to the pre-monsoon seasons. (e, f, g, h, i).
Many attempts were made to investigate the atmospheric state parameters (e.g., pressure, temperature, water vapor, and wind) by launching tethered balloons (up to 2 km within 30 min) in the boundary layer, as well as the optical, microphysical, and chemical measurements (e.g., aerosol optical depth, Ångström exponent, black
4.2.6 Sodankylä Total Column ozone Intercomparison (SAUNA)
Validation of ground-based and satellite total ozone measurements are usually performed under ideal measure -ments conditions at mid-latitudes where total ozone is near 300 DU. In general, agreement between ground-based instruments is within 2%, giving confidence to the methods and algorithms under these conditions. However, total column ozone retrievals at high latitudes show persistent differences of 5–10%, especially under condi -tions of low sun, high total column ozone (> 400DU) and high column variability. Satellite and ground-based measurements must be compared under a greater variety of ozone column amounts and profile shapes if such differences are to be resolved.
The objective of the Sodankylä Total Column Ozone Intercomparison was to assess the comparative performance of the ground-based instruments and algorithms that measure total column ozone at large solar zenith angles and high total column ozone amounts. SAUNA was organized by the NASA GSFC Laboratory for Atmospheres, in collaboration with the Finnish Meteorological Institute Arctic Research Center (FMI-ARC) and the European Space Agency (ESA-ESRIN), and involved 30 participants from 10 institutions in 9 countries. A list of partici -pants and instruments is given in Table 4.2. The SAUNA campaign was carried out from March 20 to April 14 at the FMI-ARC located 120 km north of the Arctic Circle at Sodankylä, Finland (Figure 4.6).
Table 4.2: List of SAUNA Instruments and Principal Investigators.
Instrument Principal Investigator Affiliation
Brewer: single monochromator E. Kyrö FMI-ARC (Finland)
Brewer: 1 single (World standard), 1 double
T. McElroy MSC (Canada)
Brewer: double A. Cede
R. McPeters
NASA GSFC (USA)
Brewer: 1 double (European Standard)
A. Redondas E. Cuevas
INM-Izana (Spain)
Dobson (Traveling standard) R. Evans NOAA/ESRL/GMD (USA)
Dobson (European standard) U. Koehler DWD-MOHp (Germany)
DOASs: 1 UV, 1 vis, 1 miniDOAS M. van Roozendael BIRA-IASB (Belgium)
miniDOAS E. Brinksma KNMI (Netherlands)
SAOZ (permanently at FMI-ARC) F. Goutail CNRS-SA (France)
STROZ-LITE LIDAR (NDSC standard)
T. McGee NASA-GSFC (USA)
Ozonesondes R. Kivi
B.R. Bojkov
FMI-ARC (Finland) NASA-GSFC (USA)
Figure 4.6. Finland and the location of Sodankylä, 120 km north of the Arctic Circle (67.37°N, 26.63°E).
The early springtime at this high latitude provides the ideal large solar zenith angles for the mission, and total ozone is consistently higher than 400 DU over Sodankylä at this time of year. The timing of the SAUNA mis -sion took advantage of these geophysical conditions.
Figure 4.7. Measurements of the three participating Brewer double monochromator spec-trophotometers as seen for April 5, 2006. This high column increase through the course of the day was typical for the SAUNA campaign.
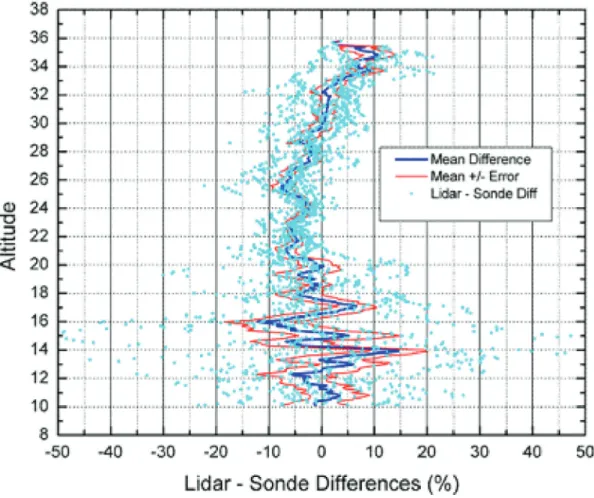
A typical measurement day is depicted in Figure 4.7 showing a variability of 60 DU in 9 hours. Observations made by space based instruments aboard several satellites are tightly integrated into the intercomparison strategy of the mission as well. The effect of ozone and temperature profile on total column measurements will also be explored using LIDAR and ozone sonde observations. The Laboratory STROZ Lidar participated in this campaign to provide stratospheric vertical profiles of ozone and temperature during each of the clear nights during the campaign. Ozone and temperature profiles were retrieved during six nights, and were compared to the profiles from sondes launched from Sodankylä (although these were not always coincident in time.) Figure 4.8 shows the results of these lidar/sonde comparisons. The overall mean difference was 0.86% ± 0.28%. The majority of the difference is due to the extreme variability of the atmosphere and the different measurement geometries.
Figure 4.8. Lidar/Sonde differences in O3 profiles during SAUNA.
The scientific findings from the SAUNA mission should improve the absolute accuracy of historic and future total ozone observations made under the extreme conditions of high ozone and large solar zenith angles. A data workshop was held in November 2006 and consensus was reached to redeploy at Sodankylä in February 2007 to focus on the profile shape dependence of the ground-based and satellite algorithms at very large solar zenith angles (> 80 deg.). In addition to the ground-based instruments of the first SAUNA campaign, intensive STROZ Lidar measurements and about 50 ozonesondes will be launched during the 4 week SAUNA-2 campaign. For further information on SAUNA contact Bojan R. Bojkov (UMBC/GEST, [email protected]) and for information on the STROZ Lidar, contact Tom McGee, [email protected]).
4.2.7 NASA African Monsoon Multidisciplinary Analysis (NAMMA)
This mission, running from August 15 to mid-September, examined the formation and evolution of tropical hurricanes in the eastern and central Atlantic and their impact on the U.S. East Coast, the composition and structure of the Saharan Air Layer (SAL), and whether aerosols affect cloud precipitation and influence cyclone development. During the 2006 hurricane season, a group of scientists spent a month in Cape Verde, a republic of 10 small islands off the western coast of Africa, to learn more about the birth of these storms. Some of most intense hurricanes that cause serious influence over the East Coast and Caribbean Islands originate from Af -rican Easterly Wave(s) (AEWs), which are disturbances moving westward from the Af-rican continent over the
Atlantic Ocean. Only a limited number of disturbances grow into hurricanes. How these disturbances become hurricanes, or more generally tropical cyclones, is not well known. The SAL, a warm, dry and often dust-laden air mass, is believed to influence tropical cyclones according to some theories. This intrigues scientists studying the structure and composition of the SAL and its interaction with AEWs. Several instruments participating in NAMMA and a sampling of some of their results are shown in Figure 4.9.
Figure 4.9. Schematic of Laboratory instruments participating in the NAMMA field campaign.
Two mobile laboratories, SMART (Surface-sensing Measurements for Atmospheric Radiative Transfer; bottom-left) and COMMIT (Chemical, Optical, and Microphysical Measurements of In situ Troposphere; middle-left) were deployed at Sal Island, Cape Verde to continuously monitor the structure and composition of the atmosphere in the major path of the SAL and the AEWs.
Hurricane Helene in the North Atlantic Ocean and a dust storm passing over Sal Island were observed by NASA’s Terra/MODIS satellite (Top-left). When Saharan dust descended down near the surface, its physical and chemical properties were captured by SMART-COMMIT. An instrument in SMART, Micro-Pulse Lidar (MPL), which continuously measures the vertical distribution of atmospheric particulates, caught such an epi -sode (top-right image). Backward trajectory analysis, which traces a parcel of air mass back to find out where it came from, suggests the dust aerosol layer seen by the MPL may have originated from a dust storm over Niger
(middle-center). “Deep Blue” satellite-based aerosol retrievals to infer the optical properties of aerosols also support this result from the backward trajectory analysis (bottom-center). The three graphs in the bottom-right show measurements from COMMIT at the near surface (10 meter), which represent the amount of aerosols (scattering coefficient), their size (Angstrom exponent; the smaller values, the larger aerosols), and a measure of their capability to take up water vapor and grow in size as humidity increases (aerosol humidification factor, ratio of scattering coefficients measured at two distinct relative humidity values—normally at 85% and 40%), respectively. These graphs indicate changes in aerosol optical properties as dust particles increase with time in the marine boundary layer where sea-salt particles would be a dominant type of aerosol otherwise. These preliminary measurements will be used to characterize properties of dust and the SAL to help understand their interactions with AEWs and their impact on hurricane genesis.
NASA’s DC-8 medium altitude research aircraft also participated in the NAMMA investigations. Sensors on-board the aircraft measured cloud and particle sizes and shapes, wind speed and direction, rainfall rates, atmospheric temperature, pressure and relative humidity. The DC-8 aircraft made 13 research missions that sampled 7 different waves/circulations, most of them for 2 different days. They included about 3 developing and 4 non-developing systems. The last system studied developed into Hurricane Helene. There were a number of dedicated missions or modules that addressed microphysics and SAL issues.
For further information contact Gerry Heymsfield, [email protected].
4.2.8 Scout-o3 Uv: Total Column No
2Measurements of direct-sun irradiances were made at the city of Thessaloniki, in Greece (latitude 40.5° North, longitude 22.9° East). The instrument was set up on an elevated platform on top of the Thessaloniki University Physics building, about 60 meters above sea level, as part of the Greek-EU Scout-O3 campaign in July 2006. After instrument setup, a Brewer, PAN-1, Ultraviolet Multifilter Rotating Shadowband Radiometer (UV-MFRSR), and a CIMEL made measurements throughout the day from July 13 to 23 under all sky conditions. All four instruments measured 2 out of 3 aerosol parameters (optical depth, Ångstrom coefficient, and absorption coef -ficient) in different ways, the Brewer and PAN-1 measured NO2, PAN-1 and the CIMEL measured H2O, and
the Brewer and the UV-MFRSR measured O3. The measurements of interest are those mainly related to NO2,
with the measurements of other gases and aerosols serving as auxiliary data. The auxiliary data permits us to remove Rayleigh scattering, aerosol effects, and ozone absorption, leaving the NO2 residual in the data.
Recent satellite measurements have shown the relationship between industrial activity and the apparent amount of NO2 in the atmosphere. However, comparisons between satellite NO2 column amounts obtained from the
Aura/OMI spacecraft instrument with accurate ground-based direct-sun measurements made with a Brewer double monochromator show a 50% OMI underestimate of NO2 in moderately polluted areas like Greenbelt, MD
and Thessaloniki, Greece. We have used a new technique based on DS-DOAS (Direct Sun–Differential Optical Absorption Spectroscopy) to retrieve ground-based measurements of NO2 at high precision (0.01 DU) and good
accuracy (0.1 DU). The measurements are made using a newly developed portable system (PANDORA) based on a small temperature stabilized commercial 1024 element CMOS-detector spectrometer connected by fiber optic cable to a 1.6° field of view collimator and filter wheel assembly. A precision pointing mechanism, 0.01°, is used to track the sun. The spectrometer simultaneously measures sun irradiances I(λ) from 265 to 500 nm at ∆λ = 0.4 nm spectral resolution with ~3 pixels per 0.4 nm. We average 2500 cloud-free spectra obtained over 20 seconds to obtain high signal to noise. New data were obtained from a field campaign in Thessaloniki, Greece during July 2006 that have a clear-sky precision of 0.01 DU of NO2, which is sufficient to track minute
by minute changes in column NO2 throughout each day with typical values of 0.5 to 3 DU. Since PANDORA
NO2 measurements can be made in the presence of light to moderate clouds with reduced precision (~0.2 DU
The daily NO2 data for the period July 14 to 24, 2006 are shown (Figure 4.10) for both the Brewer and for PAN-1.
The Brewer data are obtained approximately every 20 minutes while the PAN-1 data are obtained every 2 min-utes. Some of the days when the data were obtained were partly cloudy, with the sun going in and out of thin clouds. Thin clouds do not affect the PAN-1 data, since the wavelengths are obtained simultaneously. The same is not true for the Brewer, where the 6 wavelengths are obtained sequentially over a short interval. The result is additional scatter in the Brewer estimates of NO2 as is clearly shown in Figure 4.10. This effect is particularly
seen on Saturday July 15 where the PAN-1 data are highly correlated from measurement to measurement, while the Brewer data show substantial random scatter that is greater than their estimated error. It is important to have time resolved measurements to correspond to the OMI overpass time to remove the bias effect of the hourly variation in NO2 for observations at other times, especially early morning observations (DOAS). Cur
-rent satellite measurements have shown that there is a great deal of spatial variability in NO2 amounts because
of its relatively short chemical lifetime and its dependence on proximity to sources of NO2, mostly automobiles
and power plants.
Figure 4.10. NO2 daily course for Friday July 14 to Monday July 24, 2006 at Thessaloniki,
Greece as a function of GMT (Local time = GMT + 3). The blue dots represent clear-sky PAN-1 data and black dots and error bars are from the Brewer spectrometer. Red dots in-dicate the presence of clouds. The precision of the PAN-1 NO2 values is 0.01 DU. The OMI
overpass time is about 13:30 local time or 10:30 GMT. For more information, contact Jay Herman ([email protected]).