Ontology-Driven, Guided
Visualisation Supporting Explicit
and Composable Mappings
Dissertation
zur Erlangung des akademischen Grades
Doktoringenieur (Dr.-Ing.)
vorgelegt an der
Technischen Universität Dresden
Fakultät Informatik
eingereicht von
Dipl.-Medieninf. Jan Polowinski
geboren am 3. März 1981
in Gelsenkirchen
Gutachter
Prof. Dr. rer. nat. habil. Uwe Aßmann,
Technische Universität Dresden
Prof. Dr. Ulrich W. Eisenecker,
Universität Leipzig
Tag der Verteidigung: 20. Januar 2017
Abstract
Data masses on the World Wide Web can hardly be managed by humans or machines. One option is the formal description and linking of data sources using Semantic Web and Linked Data technologies. Ontologies written in standardised languages foster the sharing and linking of data as they provide a means to formally define concepts and relations between these concepts. A second option is visualisation. The visual representation allows humans to perceive information more directly, using the highly developed visual sense. Relatively few efforts have been made on combining both options, although the formality and rich semantics of ontological data make it an ideal candidate for visualisation. Advanced visualisation design systems support the visualisation of tabular, typically statistical data. However, visualisations of ontological data still have to be created manually, since automated solutions are often limited to generic lists or node-link diagrams. Also, the semantics of ontological data are not exploited for guiding users through visualisation tasks. Finally, once a good visualisation setting has been created, it cannot easily be reused and shared. Trying to tackle these problems, we had to answer how to define composable and shareable mappings from ontological data to visual means and how to guide the visual mapping of ontological data.
We present an approach that allows for the guided visualisation of ontological data, the creation of effective graphics and the reuse of visualisation settings. Instead of generic graphics, we aim at tailor-made graphics, produced using the whole palette of visual means in a flexible, bottom-up approach. It not only allows for visualising ontologies, but uses ontologies to guide users when visualising data and to drive the visualisation process at various places: First, as a rich source of information on data characteristics, second, as a means to formally describe the vocabulary for building abstract graphics, and third, as a knowledge base of facts on visualisation. This is why we call our approachontology-driven. We suggest generating anAbstract Visual Model(AVM) to represent and »synthesise« a graphic following a role-based approach, inspired by the one used by J. v. Engelhardt for the analysis of graphics. It consists of graphic objects and relations formalised in theVisualisation Ontology(VISO). Amappings model, based on the declarativeRDFS/OWL Visualisation Language(RVL), determines a set of transformations from the domain data to the AVM. RVL allows for composable visual mappings that can be shared and reused across platforms. To guide the user, for example, we discourage the construction of mappings that are suboptimal according to an effectiveness ranking formalised in the fact base and suggest more effective mappings instead. The guidance process is flexible, since it is based on exchangeable rules. VISO, RVL and the AVM are additional contributions of this thesis. Further, we initially analysed the state of the art in visualisation and RDF-presentation comparing 10 approaches by 29 criteria. Our approach is unique because it combines ontology-driven guidance with composable visual mappings. Finally, we compare three prototypes covering the essential parts of our approach to show its feasibility. We show how the mapping process can be supported by tools displaying warning messages for non-optimal visual mappings, e. g., by considering relation characteristics such as »symmetry«. In a constructive evaluation, we challenge both the RVL language and the latest prototype trying to regenerate sketches of graphics we created manually during analysis. We demonstrate how graphics can be varied and complex mappings can be composed from simple ones. Two thirds of the sketches can be almost or completely specified and half of them can be almost or completely implemented.
Acknowledgements
I would like to thank my supervisor, Prof. Uwe Aßmann, for giving me the opportunity to work on my topic, which fascinated me from day one until now. I appreciate this very much. Thank you as well for many helpful comments. I also would like to thank Prof. Ulrich W. Eisenecker, who accepted to be my external reviewer, for taking the time to comment on my work in detail. Many thanks also to Jendrik Johannes and Katja Siegemund, who carefully reviewed chapters of this work, for their constructive comments. Thank you also to my former colleagues and friends from the software technology group at TU Dresden for commenting on talks I gave there and for helping me out in my research life. Especially, I would like to thank Christoff Bürger, who shared the office with me, for the discussions on graph transformations and language definitions. Thank you also to Christian Wende for introducing me to OWLText.
The VISO ontology is the result of fruitful discussions with my colleague Martin Voigt from the chair for multimedia technology. As noted in the respective chapter, the chapter on the VISO ontology has been built on work previously published and co-authored with Martin. The initial version of the VISO documentation and its bibliographic annotations was set up and improved many times by Fabian Prager. Thank you for your endurance. Many thanks also to Pooran Patel, one of the students I supervised, who successfully built the second (OntoWiki-based) prototype in spite of many changes to the then premature RVL specification. Thank you Anna and Hermann for proofreading on short call.
This work would not have been possible without the patience and trust of many people including my family and especially my wife Anna. Standing by me all the time I worked on this thesis is something that cannot be taken for granted. Thank you for supporting and encouraging me.
Work on this thesis received financial support from the European Social Fund and the Free State of Saxony, contract no. 80937064.
Publications
This thesis is partially based on the following peer-reviewed publications:
• J. Polowinski. Towards RVL: a declarative language for visualizing RDFS/OWL data. In Proceedings of the 3rd International Conference on Web Intelligence, Mining and Semantics (WIMS ’13), 38:1–38:11. New York, NY, USA, 2013. ACM.
• J. Polowinski and M. Voigt. VISO: A shared, formal knowledge base as a foundation for semi-automatic InfoVis systems. InCHI ’13 Extended Abstracts on Human Factors in Computing Systems (CHI WIP ’13). Paris, France, 2013. ACM.
The following peer-reviewed publications cover work onfaceted browsing, which is closely related to the content of the thesis, but not contained herein (we suggest the mechanism of faceted browsing to be used for filtering and selection tasks in our approach):
• J. Polowinski. Widgets for faceted browsing. InHuman Interface and the Management of Information. Designing Information Environments, LNCS 5617 proceedings, pages 601–610. 2009. Springer-Verlag Berlin Heidelberg.
• M. Schmidt, J. Polowinski, J. Johannes, and M. A. Fernandez. An integrated facet-based library for arbitrary software components. In ECMFA 2010, LNCS 6138 proceedings, pages 261–276. 2010. Springer-Verlag Berlin Heidelberg.
• M. Voigt, A. Werstler, J. Polowinski, and K. Meißner. Weighted faceted browsing for characteristics-based visualization selection through end users. InProceedings of the 4th ACM SIGCHI symposium on Engineering interactive computing systems (EICS ’12), pages 151–156. New York, NY, USA, 2012. ACM.
• U. Aßmann, A. Bartho, C. Bürger, S. Cech, B. Demuth, F. Heidenreich, J. Johannes, S. Karol, J. Polowinski, J. Reimann, J. Schroeter, M. Seifert, M. Thiele, C. Wende, and C. Wilke. DropsBox: the Dresden Open Software Toolbox. InSoftware & Systems Modelling. 2012.
Contents
Legend and Overview of Prefixes xiii
1 Introduction 1
2 Background 11
2.1 Visualisation . . . 11
2.1.1 What is Visualisation? . . . 11
2.1.2 What are the Benefits of Visualisation? . . . 12
2.1.3 Visualisation Related Terms Used in this Thesis . . . 12
2.1.4 Visualisation Models and Architectural Patterns . . . 12
2.1.5 Visualisation Design Systems . . . 14
2.1.6 What is the Difference between Visual Mapping and Styling? . . . 14
2.1.7 Lessons Learned from Style Sheet Languages . . . 15
2.2 Data . . . 16
2.2.1 Data – Information – Knowledge . . . 17
2.2.2 Structured Data . . . 17
2.2.3 Ontologies in Computer Science . . . 19
2.2.4 The Semantic Web and its Languages . . . 19
2.2.5 Linked Data and Open Data . . . 20
2.2.6 The Metamodelling Technological Space . . . 21
2.2.7 SPIN . . . 21
2.3 Guidance . . . 22
2.3.1 Guidance in Visualisation . . . 22
3 Problem Analysis 23 3.1 Problems of Ontology Visualisation Approaches . . . 24
3.2 Research Questions . . . 25
3.3 Set up of the Case Studies . . . 25
3.3.1 Case Studies in the Life Sciences Domain . . . 26
3.3.2 Case Studies in the Publishing Domain . . . 26
3.3.3 Case Studies in the Software Technology Domain . . . 27
3.4 Analysis of the Case Studies’ Ontologies . . . 27
3.5 Manual Sketching of Graphics . . . 29
3.6 Analysis of the Graphics for Typical Visualisation Cases . . . 29
3.7 Requirements . . . 33
3.7.1 Requirements for Visualisation and Interaction . . . 34
3.7.2 Requirements for Data Awareness . . . 34
3.7.3 Requirements for Reuse and Composition . . . 34
3.7.4 Requirements for Variability . . . 35
3.7.5 Requirements for Tooling Support and Guidance . . . 35
4 Analysis of the State of the Art 37
4.1 Related Visualisation Approaches . . . 38
4.1.1 Short Overview of the Approaches . . . 38
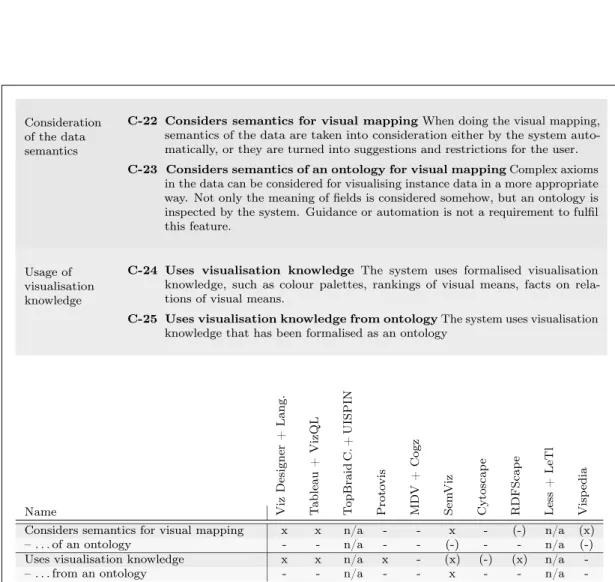
4.1.2 Detailed Comparison by Criteria . . . 46
4.1.3 Conclusion – What Is Still Missing? . . . 60
4.2 Visualisation Languages . . . 62
4.2.1 Short Overview of the Compared Languages . . . 62
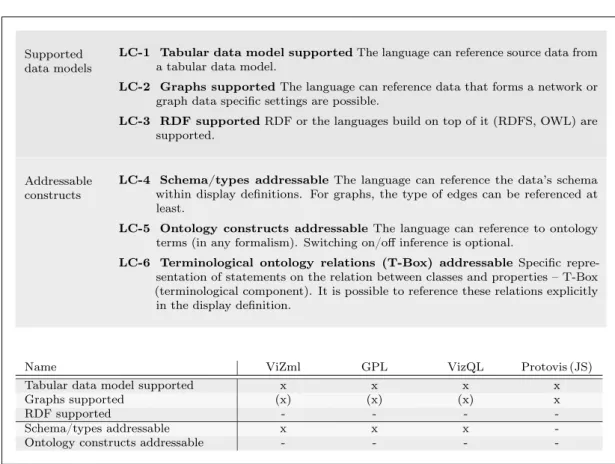
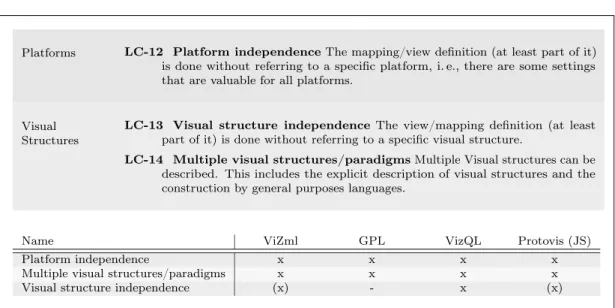
4.2.2 Detailed Comparison by Language Criteria . . . 66
4.2.3 Conclusion – What Is Still Missing? . . . 71
4.3 RDF Presentation Languages . . . 72
4.3.1 Short Overview of the Compared Languages . . . 72
4.3.2 Detailed Comparison by Language Criteria . . . 76
4.3.3 Additional Criteria for RDF Display Languages . . . 87
4.3.4 Conclusion – What Is Still Missing? . . . 89
4.4 Model-Driven Interfaces . . . 90
4.4.1 Metamodel-Driven Interfaces . . . 90
4.4.2 Ontology-Driven Interfaces . . . 92
4.4.3 Combined Usage of the Metamodelling and Ontology Technological Space 94 5 A Visualisation Ontology – VISO 97 5.1 Methodology Used for Ontology Creation . . . 100
5.2 Requirements for a Visualisation Ontology . . . 100
5.3 Existing Approaches to Modelling in the Field of Visualisation . . . 101
5.3.1 Terminologies and Taxonomies . . . 101
5.3.2 Existing Visualisation Ontologies . . . 102
5.3.3 Other Visualisation Models and Approaches to Formalisation . . . 103
5.3.4 Summary . . . 103
5.4 Technical Aspects of VISO . . . 103
5.5 VISO/graphic Module – Graphic Vocabulary . . . 104
5.5.1 Graphic Representations and Graphic Objects . . . 105
5.5.2 Graphic Relations and Syntactic Structures . . . 107
5.6 VISO/data Module – Characterising Data . . . 110
5.6.1 Data Structure and Characteristics of Relations . . . 110
5.6.2 The Scale of Measurement and Units . . . 112
5.6.3 Properties for Characterising Data Variables in Statistical Data . . . 113
5.7 VISO/facts Module – Facts for Vis. Constraints and Rules . . . 115
5.7.1 Expressiveness of Graphic Relations . . . 116
5.7.2 Effectiveness Ranking of Graphic Relations . . . 118
5.7.3 Rules for Composing Graphics . . . 119
5.7.4 Other Rules to Consider for Visual Mapping . . . 124
5.7.5 Providing Named Value Collections . . . 124
5.7.6 Existing Approaches to the Formalisation of Visualisation Knowledge . . 126
5.7.7 The VISO/facts/empiric Example Knowledge Base . . . 126
5.8 Other VISO Modules . . . 126
5.9 Conclusions and Future Work . . . 127
5.10 Further Use Cases for VISO . . . 127
5.11 VISO on the Web – Sharing the Vocabulary to Build a Community . . . 128
6 A VISO-Based Abstract Visual Model – AVM 129 6.1 Graphical Notation Used in this Chapter . . . 129
6.2 Elementary Graphic Objects and Graphic Attributes . . . 131
6.3 N-Ary Relations . . . 131
6.4 Binary Relations . . . 131
6.6 Composition of Graphic Relations Using Roles . . . 132
6.7 Composition of Visual Mappings Using the AVM . . . 135
6.8 Tracing . . . 135
6.9 Is it Worth Having an Abstract Visual Model? . . . 135
6.10 Discussion of Fresnel as a Related Language . . . 137
6.11 Related Work . . . 139
6.12 Limitations . . . 139
6.13 Conclusions . . . 140
7 A Language for RDFS/OWL Visualisation – RVL 141 7.1 Language Requirements . . . 142 7.2 Main RVL Constructs . . . 145 7.2.1 Mapping . . . 145 7.2.2 Property Mapping . . . 146 7.2.3 Identity Mapping . . . 146 7.2.4 Value Mapping . . . 147 7.2.5 Inheriting RVL Settings . . . 147 7.2.6 Resource Mapping . . . 148 7.2.7 Simplifications . . . 149
7.3 Calculating Value Mappings . . . 150
7.4 Defining Scale of Measurement . . . 153
7.4.1 Determining the Scale of Measurement . . . 154
7.5 Addressing Values in Value Mappings . . . 156
7.5.1 Determining the Set of Addressed Source Values . . . 156
7.5.2 Determining the Set of Addressed Target Values . . . 157
7.6 Overlapping Value Mappings . . . 158
7.7 Default Value Mapping . . . 158
7.8 Default Labelling . . . 159
7.9 Defining Interaction . . . 159
7.10 Mapping Composition and Submappings . . . 160
7.11 A Schema Language for RVL . . . 160
7.11.1 Concrete Examples of the RVL Schema . . . 163
7.12 Conclusions and Future Work . . . 166
8 The OGVIC Approach 169 8.1 Ontology-Driven, Guided Editing of Visual Mappings . . . 172
8.1.1 Classification of Constraints . . . 172
8.1.2 Levels of Guidance . . . 173
8.1.3 Implementing Constraint-Based Guidance . . . 173
8.2 Support of Explicit and Composable Visual Mappings . . . 177
8.2.1 Mapping Composition Cases . . . 178
8.2.2 Selecting a Context . . . 180
8.2.3 Using the Same Graphic Relation Multiple Times . . . 181
8.3 Prototype P1(TopBraid-Composer-based) . . . 182
8.4 Prototype P2(OntoWiki-based) . . . 184
8.5 Prototype P3(Java Implementation of RVL) . . . 187
8.6 Lessons Learned from Prototypes & Future Work . . . 190
8.6.1 Checking RVL Constraints and Visualisation Rules . . . 190
8.6.2 A User Interface for Editing RVL Mappings . . . 190
8.6.3 Graph Transformations with SPIN and SPARQL 1.1 Update . . . 192
8.6.4 Selection and Filtering of Data . . . 193
8.6.5 Interactivity and Incremental Processing . . . 193
9 Application 197
9.1 Coverage of Case Study Sketches and Necessary Features . . . 198
9.2 Coverage of Visualisation Cases . . . 201
9.3 Coverage of Requirements . . . 205 9.4 Full Example . . . 206 10 Conclusions 211 10.1 Contributions . . . 211 10.2 Constructive Evaluation . . . 212 10.3 Research Questions . . . 213
10.4 Transfer to Other Models and Constraint Languages . . . 213
10.5 Limitations . . . 214
10.6 Future Work . . . 214
Appendices 217 A Case Study Sketches 219 B VISO – Comparison of Visualisation Literature 229 C RVL 231 D RVL Example Mappings and Application 233 D.1 Listings of RVL Example Mappings as Required by Prototype P3 . . . 233
D.2 Features Required for Implementing all Sketches . . . 235
D.3 JSON Format for Processing the AVM with D3 – Hierarchical Variant . . . 238
Bibliography 238
List of Figures 251
List of Tables 254
Legend
Overview of Prefixes and Namespaces
xsd: XML Schema http://www.w3.org/2001/XMLSchema# rdf: Resource Description Framework http://www.w3.org/1999/02/22-rdf-syntax-ns# rdfs: RDF Schema http://www.w3.org/2000/01/rdf-schema# owl: Web Ontology Language http://www.w3.org/2002/07/owl# dct: Dublin Core Terms http://purl.org/dc/terms/ dc: Dublin Core Elements 1.1 http://purl.org/dc/elements/1.1/ spin: SPARQL Inferencing Notation http://spinrdf.org/spin# sp: SPIN SPARQL Syntax http://spinrdf.org/sp# smf: SPIN Functions http://spinrdf.org/spif/ spl: SPIN Standard Library http://spinrdf.org/spl#
fn: XPath Functions http://www.w3.org/2005/xpath-functions# afn: Jena ARQ Functions http://jena.hpl.hp.com/ARQ/function# rvl: RDFS/OWL Visualisation Language http://purl.org/rvl/
rvl-cs: RVL SPIN-Constraints http://purl.org/rvl/spin-constraints/
rvl-fb-cs: RVL Fact-Based SPIN-Constraints http://purl.org/rvl/fact-based-spin-constraints/ rexc: RVL Example Commons http://purl.org/rvl/example-commons/ viso: Visualisation Ontology http://purl.org/viso/graphic/
viso-graphic: / vg: VISO/graphic module http://purl.org/viso/graphic/ viso-data: / vd: VISO/data module http://purl.org/viso/data/ viso-facts: VISO/facts module http://purl.org/viso/facts/
common-shapes: VISO Common Shapes http://purl.org/viso/shape/commons/ bio-shapes: Examples of shapes for the
domain of Biology
http://purl.org/viso/addon/shapes/bio/
amino-acid: Amino-Acids Ontology http://www.co-ode.org/ontologies/amino-acid/2006/05/18/amino-acid.owl# cito: Citation Typing Ontology http://purl.org/spar/cito/ obo: Open Biomedical Ontologies (OBO) http://purl.org/obo/owl/obo# obo-rel: OBO relations http://purl.org/obo/owl/OBO_REL# po: OBO Plant Ontology http://purl.org/obo/owl/PO# zfo: OBO Zebra Fish Anatomy Ontology http://purl.org/obo/owl/ZFA ro: Requirements Ontology http://purl.org/ro/ont#
Chapter 1
Introduction
The amount of information available on the World Wide Web and in isolated databases can hardly be managed, neither by machines, nor by humans. Data from social networks, sensor data and raw data from governments and industry, as currently postulated by the open data movement, will further increase the problem of information overflow.
One option to move from data masses to meaningful information is the formal description and linking of data sources using Semantic Web and Linked Data technologies. Ontologies written in Semantic Web languages, as recommended by the W3C, foster the sharing and linking of data by providing a means to formally define concepts and relations between these concepts. Due to the formal description and standardisation, it becomes easier for machines to connect data sources, infer implicit facts from existing knowledge and provide meaningful, semantically rich, data.
A second option is information visualisation, which combines the abilities of machines and humans to prepare, visualise, conclude and refine – in order to finally gain a graphic representation of the knowledge that was previously hidden in a data set. In contrast to the
textualrepresentation, the visualrepresentation of facts allows humans to perceive information more directly, using the highly developed visual sense. At the core of the visualisation process is thevisual mapping, i. e., the mapping of data variables or relations to visual means. Examples of such visual means are graphic attributes such ascolour hue,colour lightness orshape and graphic relations between the objects in a graphic, e. g.,linkingorcontainment.
Relatively few efforts have been made so far on combining both of the options that we mention above – that is applying information visualisation to Semantic Web data, although the formality and rich semantics of the data make it an ideal candidate for visualisation. The general need for effective ontology visualisations has early been noted [SBLH06, KHL+07]
and also Paulheim and Probst conclude in their survey of ontology-enhanced UIs: »There are clear research gaps in [..] advanced visualizations, and exploiting the possibilities of highly formal ontologies in user interfaces« [PP10]. This is not to say that there are no approaches to visualising ontological data [GSGC08, CTW+09, VPM13, LNHE14], and it also has to be stated that there are advanced visualisation design systems available, which support the user in visualising tabular, typically statistical data. An example for such a design system, is the commercial software Tableau [TAB]. However, we see many unsolved problems that can be summarised as follows:
First, specific, tailor-made visualisations of ontological data are still difficult and time consuming, since they have to be created manually. Many (semi-)automated solutions for generic visualisations exist, but they are usually limited to lists or node-link diagrams as illustrated in Fig. 1.1. In other cases, the available visual means (e. g.,colour hueorshape) are not directly used to encode information, but only to structure and style a textual representation of the underlying data. Second, the additional semantics that the ontological data offers, are not exploited for guiding the end-user through visualisation tasks. And finally, once a good visualisation setting has been created, it cannot easily be combined with other existing settings or shared with
CHAPTER 1. INTRODUCTION
Figure 1.1: Example of a generic node-link representation of theZebrafish Anatomy Ontology as
created by the graph view on BioPortal1. To date, generic visualisation tools for ontological data often
create node-link representations. In contrast, with the visualisation approach proposed in this thesis, we aim at tailor-made graphics as shown in Fig. 1.2.
other users. The lack of reuse also applies to visualisation knowledge (e. g., results from empiric visualisation studies). Such results could be used across different systems.
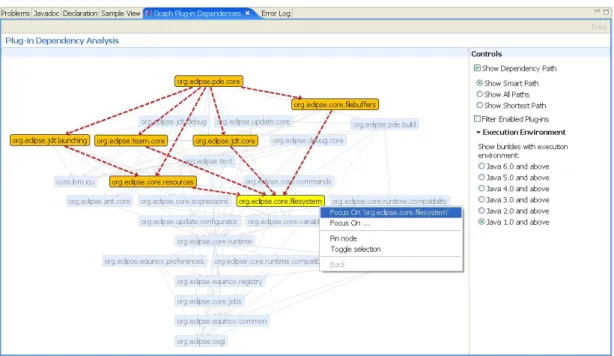
Trying to tackle these problems, the overall goal of this thesis is to present an approach that allows for a flexible, guided visualisation of ontological data, the creation of tailor-made, effective graphics and the reuse of visualisation settings. Instead of generating the above-mentioned generic graphics such as node-link diagrams or lists of resources, we want to enable domain-experts and other end-users to create fine-tailored graphics such as the one shown in Fig. 1.2. In contrast to many similar ontology representations known from ontology modelling environments – e. g., TopBraid Composer’s2 Graph view, the Protégé3 plugins OntoGraf4,
OWLViz5 or Protégé VOWL [LNB14] – we aim at using the whole palette of visual means. These include commonly used graphic attributes such as colour hue and (spatial) relations between graphic objects such as linking (e. g., used in node-link diagrams) and containment
(e. g., used in Venn-diagrams) but also simple and effective, though more rarely used, ones, such asproportional repetition(e. g., used in »star rankings«),proportional division(pie charts),
clustering andline-up of graphic objects. Furthermore, we do not aim at a visual notation for OWL like VOWL [LNHE14] or SOVA6. The fact that we aim at tailor-made graphics in a bottom-up approach [LNS06], distinguishes this work from top-down approaches such as
1 BioPortal – http://bioportal.org (now http://bioportal.bioontology.org; accessed: 29.03.2010)
2 TopBraid Composer – Ontology modelling environment. http://www.topquadrant.com, accessed: 12.04.2015. 3 Protégé – Ontology modelling environment. http://protege.stanford.edu/, accessed: 16.04.2016.
4 OntoGraf. http://protegewiki.stanford.edu/wiki/OntoGraf/, accessed: 16.04.2016. 5 OWLViz. http://protegewiki.stanford.edu/wiki/OWLViz/, accessed: 16.04.2016.
Figure 1.2: Example of a tailor-made graphic representing several concepts described in theZebrafish Ontology. Various visual means such ascontainment, line-up, widthandpositionare used to encode
ontological relations such aspart-ofor thestart and end timesof phases during the fish’s development.
Multiple of these visual mappings are composed to yield a complex graphic. Pointing to parts of the zebra fish anatomy in the upper half of the graphic interactively highlights the corresponding development phases.
Vispedia[CTW+09] orVizBoard [VPM13], which take the approach of building »mash-ups« by
instantiating and connecting ready-made graphic types.
To receive an impression of how a user may interact with such a visualisation design system, and to further motivate our approach, we start with a concrete example taken from our case studies: Let us assume, we want to visualise data about software requirements that is described using theRequirements Ontology[STZ+11]. In the following, we go through steps of an iterative, guided visualisation process as the system should offer it for visualising the requirements data. The resulting intermediate graphic after each step is shown in Fig. 1.3. During the interactive process, the designsystem and theusertake action in turn:
• Initially, thesystemshows only a graphic object with its default appearance for each entity to be visualised (Shape = Rectangle, Colour = Grey, Position = Random . . . ; Fig. 1.3a). • System: The following relations are relevant: »has priority«, »has response time in ms«,
»is in conflict with«, . . . • Userselects »has priority«
Based on formally stored knowledge from the field of graphics and visualisation, the system can suggest effective visual means and guide the user:
• System: The following visual means are recommended: »lightness«, »position«, . . . • Userselects »lightness« . . .
• Systemshows Fig. 1.3b and suggests further relations . . . • Userselects »is in conflict with«
For the selected relation from the domain data – »is in conflict with« – information is available regarding the characteristics of this relation. For example, the system knows that it is a symmetric relation. Since symmetric relations are not directed, this should be reflected by the
CHAPTER 1. INTRODUCTION
(a) Graphic objects, each representing a
re-quirement, before applying visual mappings.
(b) After mapping tolightness.
(c) After mapping tolinking with
double headed arrow.
(d) After mapping tocontainment
andlabelling.
(e)Generic representation of the same information encoded in (d).
Figure 1.3: Example for steps of an iterative, guided visualisation process using ontological data from
the case studyRequirements Ontology (a–d). The labels (RO,R1,R2) are shown from the beginning
without requiring explicit labelling settings, because we assume that graphic objects are labelled by
default with the local identifier (e. g., RO) of the represented resources (here requirements). For
graphic representation accordingly:
• Systemrealises »is in conflict with« is a symmetric relation. Hence, it offers theundirected
visual means »linking by line«, »linking by double-headed arrow«, . . . • Userselects »linking by double-headed arrow«
• Systemupdates the view and shows Fig. 1.3c
Following these steps, the system could offer adding further relations to the visualisation, such as »is refinement of«, »has response time in ms«, . . . and the user could perform further mappings. After additional visual mapping steps the result could look like Fig. 1.3d, which is already a complex composed graphic employing five different visual means. Instead of a pure generic node-link diagram (cf. Fig. 1.3e), we replaced some links and nodes by alternative ways of graphic representation, thereby obtaining a less crowded diagram.
This example already demands some of the requirements7 that we have for our visualisation approach: First, we need a guidance system for end-users that is aware of types and characteristics of the relations used in the source data and that has access to a collection of formalised, machine-readable visual means such ascolour andcontainment. Second, this graphic vocabulary needs to be formally defined. Third, for recommending visual means, the system also requires access to a collection of perceptual facts on visualisation.
A second set of requirements emerges, when we have a closer look at what different actors may want to do with the visual mappings, once they have defined a set of mappings that suits their purposes. Let us assume that the user wants to share the visualisation settings she created with a colleague. The colleague has similar needs of visualising requirements (which have also been specified with the Requirements Ontology), but works with different visualisation software on a different platform. Additionally, she uses an extension of the requirements ontology that introduces a set of missing relations she requires. From this use case, we derive further requirements: To support reuse and sharing of the visual mappings that we define with our system, these mappings should be stated explicitly, they should be composable and usable on different platforms. In order to further support the sharing of visual mappings, existing standards such as the W3C languages for the Semantic Web – RDF(S), OWL and SPARQL – should be used wherever possible.
Having presented current problems in visualising ontological data and having motivated our general goal, in the following, we briefly outline how this thesis contributes to a solution: Contributions
In this thesis, we make the following main contributions, each of which corresponds to a chapter in the remainder:
C-1 Our first contribution is the OGVIC approach to Ontology-Driven, Guided Visu-alisation Supporting Explicit and Composable Mappings(Chapter 8), which we conceptually describe in Fig. 1.4. Using this figure, we briefly introduce the overall approach and point to additional contributions that were created as necessary prerequisites. We assume that ontological data described in RDFS/OWL is selected from a Linked Data source or read from local files (a, b). Once available to the visualisation system, this data can be filtered at any time to change the subset of filtered data that will be visualised (c, d). Selection and interactive filtering are not in focus of this thesis, since a variety of mechanisms have already been proposed for these process steps such as faceted browsing and other visual query mechanisms [ODD06, VWPM12, HZL08].
7 We give a complete list of additional visualisation cases, concrete problems, research questions and
CHAPTER 1. INTRODUCTION
Following the principle of the Model Driven Architecture8 (MDA), we suggest to generate anAbstract Visual Model – the AVM – in a next step (e, f). In terms of the MDA, the AVM is aPlatform-Independent Model. It consists of graphic objects and relations that have been formalised in the Visualisation Ontology– the VISO (g1–g3). The information on which transformations (including the visual mapping) from the domain data (c) to the AVM (f) are to be performed is described in a fourth model – theRVL mappingsmodel (h), which is based on the declarative RVL language (introduced further below). Finally, in a rendering9step (j), the actual concreterendered graphic(k) for a final platform such as SVG, HTML or X3D is created from the AVM. One reason for this extra abstract graphic model becomes apparent, when we look at the remaining process step – the guided editing of visual mappings(i), which is at the core of this thesis: During this step – while guiding the user through the process of creating and editing a set of visual mappings – not only the available data and the possible visual means need to be taken into consideration; also the AVM needs to be available for introspection. This is because additional mappings may be constrained by existing ones. This would be impossible if we had only access to the resulting final (SVG) graphic.
As foundations for our approach, multiple technologies, ontologies and languages have been developed and published as additional contributions of this thesis.
C-2 The developed ontologies comprise theVISO ontology[PV13, VP11] (g1–g3) that was al-ready mentioned above, consisting of multiple modules such asVISO/graphic (formalising graphic concepts),VISO/data (for formalising data-characteristics) andVISO/facts (of-fering vocabulary to describe knowledge gained from visualisation research). Additionally, a default fact baseVISO/facts/empiric (g4) was created to store facts on the effectiveness of visual means as described in visualisation literature (Chapter 5).
C-3 Theprinciple of the Abstract Visual Model (AVM)can be seen as a contribution on its own, since it is the first approach to formalise the various, complex relations between graphic objects following the observations from Engelhardt [vE02]. The AVM allows for modelling roles of graphic objects and, thereby, lays the foundation for a precise composition of multiple visual mappings (Chapter 6).
C-4 A further contribution and foundation of our approach is theRDFS/OWL Visualisation Language (RVL)[Pol13]. RVL allows for composable, declarative mappings that can be shared among users and systems and may be stored along with the RDF domain data. An RVL mapping could, for example, explicitly define a visual mapping of an RDF property to a specific visual means, such as: »Map the property dc:hasPartto the graphic relation viso-graphic:Containment_Relation« (Chapter 7).
Fig. 1.4 also clarifies why we call our approachontology-drivenand shows how ontologies are used to drive the visualisation process at various places: First, as a rich source of information on the data characteristics (c), second, as a means to formally describe the vocabulary for building abstract graphics (g1), and third, as a formal knowledge base to store facts on the effective use of visualisations (g4). We give a precise definition of »ontology-driven« in Sect. 4.1.2.
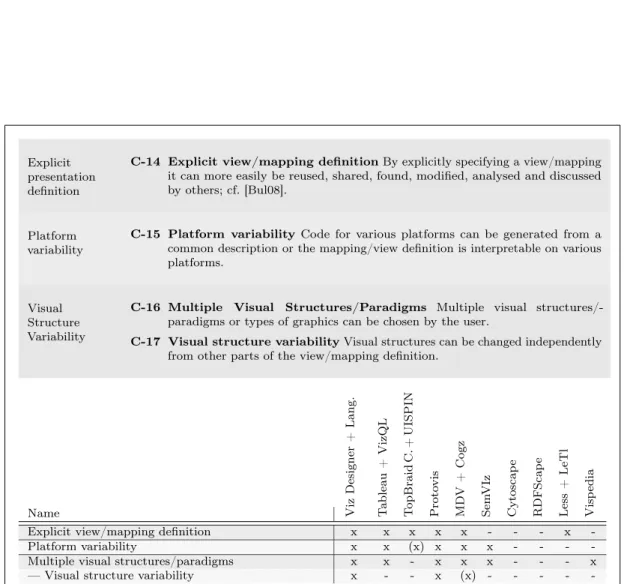
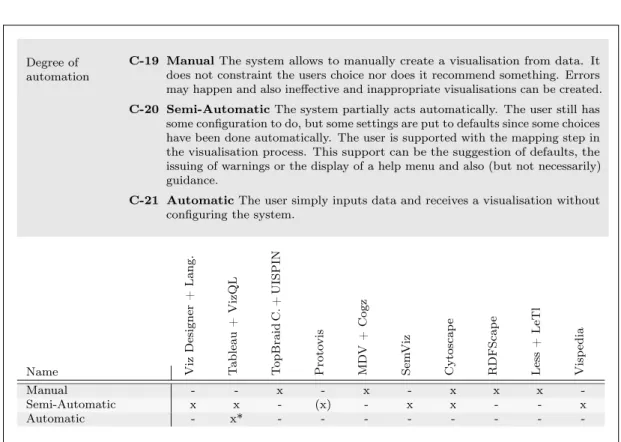
C-5 Besides the contributions shown in Fig. 1.4, we made adetailed analysis of the state of the artin the field of visualisation approaches and languages used for visualisation and RDF-presentation, which we see as an additional contribution of this thesis (Chapter 4). For the analysis of related visualisation approaches, a set of 29 criteria was established and applied to compare ten approaches in detail. Existing work only covers a subset of
8 Model Driven Architecture. http://www.omg.org/mda/, accessed: 12.12.2015.
9 Byrendering, in this thesis, we do not refer to the process of creating a rasterised image, but we use the term
Figure 1.4: The principle of OGVIC – Schematic overview. This figure illustrates the complete OGVIC approach showing the main process steps and models (a–k), which are referenced in this section. For each of the three models – the »Filtered (domain) data« model, the »RVL mappings« model and the
CHAPTER 1. INTRODUCTION
the four aspectsVisual mapping,Composability,GuidanceandOntology-driven. Fig. 1.5 summarises the results from our analysis of related visualisation approaches and shows the combination of aspects that makes the OGVIC approach unique: The approach is the first to combine ontology-driven guidance with the possibility to define composable visual mappings.
Figure 1.5: Unique selling points of OGVIC – The approach is the first to combine ontology-driven guidance with the possibility to define composable visual mappings. Existing work only covers a subset
of the four aspectsVisual mapping,Composability,GuidanceandOntology-driven.
C-6 Finally, we compare three prototypical implementations that have been created10to cover the essential parts of the OGVIC approach and show its feasibility. Two of them are embedded into existing editors for RDF data – TopBraid Composer and OntoWiki. A third one has been built from scratch. While no prototype covers all aspects of the OGVIC approach, our first two prototypes serve demonstrating the constrained-based guidance for defining RVL mappings as well as the rule-based interpretation of RVL mappings. The last one puts the focus on interpreting as much of the RVL specification as possible and rendering concrete interactive (web) graphics (Sect. 8.3–8.5).
Is this approach limited to Ontologies or RDFS/OWL?
The OGVIC approach is exemplified in the RDF technical space, which offers the benefit that the graphic knowledge we formalised as an OWL ontology can directly be accessed and the contained implicit knowledge can be exploited. As a second benefit, we can directly use terms of the graphics vocabulary for building the Abstract Visual Model (AVM) without translating back and forth between technological spaces. In order to concentrate on the relevant research questions, we completely stay within the (RDF-based) ontology technological space in the following chapters. However, the general ideas described in this thesis as the OGVIC approach are not bound to RDF-based ontological data and could at least partly be transferred to other models than ontologies (e. g.,Ecoremodels; Sect. 2.2.6), once stable bridging technology is available (cf. the work of Gašević et al. [GDD05] and Aßmann et al. [AEWW13a] for first approaches in this direction).
Outline of the Thesis
This thesis is structured as follows: After this introduction, where we have motivated our approach by a concrete example and pointed to our main research goals, questions and contributions, we provide background information on enabling technologies used in this thesis for readers who are not familiar to the field of Semantic Web or Information visualisation (Chapter 2).
We then describe each of the contributions of this thesis in its own chapter: First, we present a detailed problem analysis (Chapter 3) and an analysis of the state of the art (Chapter 4). The next chapters present our formalisation of terms in the field of graphics, the Visualisation Ontology (VISO), in Chapter 5, the Abstract Visual Model (AVM) in Chapter 6 and the RDFS/OWL Visualisation Language (RVL) in Chapter 7.
After having presented all necessary foundations for our approach, we introduce the OGVIC approach to Ontology-Driven, Guided Visualisation (Chapter 8) and briefly present prototypical implementations as well as lessons learned from building these prototypes. Chapter 9 presents the results of applying the prototypes to ontologies from our case studies. Finally, in Chapter 10, we conclude from our findings and discuss current limitations of OGVIC as well as future work.
Chapter 2
Background
In the following, we briefly introduce the fields of visualisation, ontologies and guidance and point to how the OGVIC approach relates to these fields. Since this chapter mainly serves as a place to look up basic knowledge for readers lacking some of this background, readers may skip sections accordingly.
2.1
Visualisation
In the first section of this chapter, we define basic terms from the field of visualisation such as
visualisation itself andvisualisation design system. Further, we give reasons for using visuali-sation and introduce existing visualivisuali-sation models and architectures. Finally, we distinguish visualisation languages from well-established style sheet languages and summarise lessons learned from the design of these languages.
2.1.1
What is Visualisation?
The termvisualisationoften refers to both – the process and the product. On the one hand visualisation can be seen as the mapping from data to visual form. This mapping includes transformation and often human interaction, so it is not a static document, but a process. On the other hand, often also the product of a visualisation process is called a visualisation. As the product often allows further interactive settings, especially in information visualisation, the process of visualisation continues with the product. This way the product and the process are closely intertwined. For clarity, we refer to the product of a visualisation process as agraphic representationor shortgraphicin this thesis. Maps are one of the oldest examples of graphic representations. Charts, tree maps, class diagrams, timelines and interactive visual browsers are other examples.
Definition 1 (Visualisation)
The process of creating visual graphic representations from data.
Additionally,visualisationstands for a field of research. Since we are formulating an approach to visualise abstract information stored in ontologies – rather than raw physical data – our work can be assigned to the field ofinformation visualisation(InfoVis). If we consider that ontologies store knowledge (and not only information), we could even more precisely classify our approach under the less popular term ofknowledge visualisation. A distinction of data, information and knowledge is given in Sect. 2.2.1.
CHAPTER 2. BACKGROUND
2.1.2
What are the Benefits of Visualisation?
The question »Why should we use visualisation?« is easier to answer than the question what visualisation actually is: It amplifies cognition. This is widely accepted, for example, according to Card et al. [CMS99], visualisation amplifies cognition by
(a) increasing the memory and processing resources available to the users, (b) reducing search for information,
(c) using visual representations to enhance the detection of patterns, (d) enabling perceptual inference operations,
(e) using perceptual attention mechanisms for monitoring, (f) encoding information in a manipulable medium.
The authors list references and give examples, which support each of the statements. For example, the increase of memory and processing resources (a) can be explained by the fact that some graphic attributes can be processed faster and in parallel, compared to text, which needs to be processed serially. The reduced search (b) is explained by the fact that visualisations can often »represent a large amount of data in a small space«, a phenomenon that has been described by [Tuf83] as theData–Ink Ratio. The reader is referred to Card et al.’s work for further reading.
2.1.3
Visualisation Related Terms Used in this Thesis
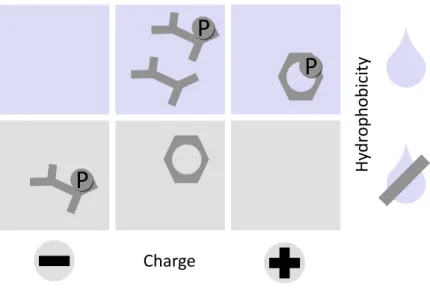
While we give detailed definitions of visualisation related terms in Chapter 5, we would like to give the reader a brief introduction to two terms that will frequently be used in the following chapters already: visual means andvisual structure. In the less technical chapters of this thesis, we use the termvisual meansfor attributes (e. g.,colour,width,x-position) as well as relations between graphic objects such as linking, overlapping, containment. The latter group, the relations, form larger constructs that are often referred to asvisual structures. Themain visual structure, i. e., the one that dominates a graphic, is sometimes also calledvisual paradigm.
2.1.4
Visualisation Models and Architectural Patterns
Several abstract models with different focuses were developed to allow for a better understanding of the visualisation process. The pipeline models of Mackinlay [Mac86a], and Haber and McNabb [HM90] describe visualisation as a process consisting of a series of transformation steps that convert data into a displayable image. Other researchers adopted this model and extended it, e. g., with human interaction and tasks [CMS99], focused on modelling data states [Chi00] or the coordination of different views [BRR03].
Applica
�
on
Database Rela�onsextract
Data Graphicaldesign Image
Presenta
�
on
Tool
synthesize render
Figure 2.1: A pipeline model as used by Mackinlay to demonstrate a linear process of generating graphics, redrawn after Mackinlay [Mac86a].
2.1. VISUALISATION
Raw Data Data Tables StructuresVisual Views
Data
Transforma�ons MappingsVisual TransformaView�ons
HumanInterac�on
Figure 2.2: Visualisation Reference Model, redrawn after Card et al. [CMS99].
Pipeline Models for Visualisation
Fig. 2.1 shows a typical linear pipeline model, as used by Mackinlay [Mac86a] to illustrate the stepwise visualisation process taken by the tool he developed. Extracted data is used to synthesise an intermediate Graphical design, which is then rendered to the final Image. Mackinlay already noted that for »difficult design problems« »feedback loops« are required, i. e., the model needs to be extended by human interaction. Also Haber and McNabb [HM90] describe three transformation steps, which »convert« raw data to aDisplayable Image (not shown). However, they emphasise the fact that data variables are mapped to graphic attributes by calling the central transformation stepVisualisation Mapping.
The Visualisation Reference Model – Modelling Interaction Interaction is a defining characteristic of information visualisation:
»
Information visualisation is about the not just creation of visual images, but alsothe interaction with those images in the service of some problem.Stuart Card [CMS09]
«
As examples of interactive visualisation structures Card et al. [CMS99] listDynamic queries,
Magic lens, Overview and detail, Linking and brushing, Extraction and comparisonand the
Attribute explorer.
As an extension of the pipeline models with respect to human interaction, Card et al. developed theVisualisation Reference Model (Fig. 2.2). The user can interact with the system by modifying all three transformation steps – data transformations, visual mappings and view transformations. Navigation in the scene and changing the perspective are examples of view transformations, which can be triggered from within an existing view, but also the data transformations and the visual mappings can be modified interactively.
While the model of Card et al. became popular as theVisualisation Reference Model in the InfoVis community, visualisation reference models in general have been discussed already in 1993 by Butler et al. [BAB+93]. A further reference model with a different focus is theData State
Reference Modeldeveloped by Chi [Chi00], which emphasises the intermediate results in the visualisation process and allows for modelling multiple operations on each of four data stages (not shown). The intermediate stage between data and views is not calledVisual Structures, butVisualization Abstractionby Chi – similarly, we call the intermediate graphic model that we introduce in Chapter 6 theAbstract Visual Model(AVM).
CHAPTER 2. BACKGROUND
The Reference Model Pattern for Visualisation
Analysing the models of Chi and Card et al., Heer and Agrawala [HA06] described theReference Model pattern (Fig. 2.3) as a visualisation specific software design pattern [GHJV94], which captures the essential structure of a software architecture that supports interactive visualisation. The authors note that the Reference Model pattern can be interpreted as a »tiered version of MVC [Model View Controller, [Bur92]], with the model divided into separate abstractions for the data and visual properties«.
DataSet
poten�alreferences
Visualisa
�
on
View
DataSource
Control
creates
Figure 2.3: The Reference Model pattern for visualisation, redrawn after Heer and Agrawala [HA06].
2.1.5
Visualisation Design Systems
The OGVIC approach presented in this thesis is an approach to create visualisation design systems for ontological data. Therefore, we define the termVisualisation Design Systemand summarise classifications of these systems.
Definition 2 (Visualisation Design System) A system that takes data as input and either creates a visualisation automatically or helps the user to do so.
Lange, Nocke and Schumann [LNS06] distinguish systems following a top-down approach from those followingbottom-upapproaches. Top-down approaches use templates of complex, »predesigned« [Mac86a] graphic representations, which are then populated with data. While this allows for offering proven and tested graphics for frequently occurring scenarios, the extensibility of these approaches is limited. Bottom-up approaches synthesise graphics, for example using an algebra, which allows for creating graphics in a more flexible way. However, composing multiple visual means is challenging, since many rules have to be considered in order to achieve useful graphics. The OGVIC approach describes a bottom-up approach for creating graphics.
Visualisation design systems can further vary with respect to their degree of automation and the supported customisation times [Bul08]. We discuss visualisation systems and approaches in Sect. 4.1.1 in detail.
2.1.6
What is the Difference between Visual Mapping and Styling?
Visual mapping differs from styling. For styling, a wide-spread declarative language for the definition of styles exists – the Cascading Style Sheets (CSS) – which are used in combination with HTML and other XML languages such as SVG. We defineStyling for the scope of this thesis as follows:
Definition 3 (Styling) The process of adding styles to a structured document, where styles are variations of how a structured document and its parts are presented.
2.1. VISUALISATION
Styles usually concern visual properties, for example, variations of font-face, font-colour, border-width and position, but they may also be created for aural properties such as the intonation or volume. The W3C states on its website [W3C13] that style sheets, which bundle a set of styles into a file, »describe how documents are presented on screens, in print, or perhaps how they are pronounced.« Typical situations for defining styles include the following and are always
anchored to parts of the document structure (in this case an HTML structure): • Set the font style of a specific DIV-element to »italic«.
• Set the border-width of all DIV elements to »1.5 cm«. • Set the style of anchors to »underline«.
Visual mappings are at the core of the visualisation process. We define them as follows:
Definition 4 (Visual Mapping) Also referred to as »visual encoding«. During the visual mapping process, data relations and values are mapped to (encoded as) visual rela-tions and values. Besides for the mapping process, we also use the term visual mapping for descriptions of visual mappings that state source and target in a declarative way.
We can distinguish three types of visual mappings:
a) Manual mapping to constants Here a data relation (e. g.,age) or a value (e. g.,40 years) is mapped to a constant visual attribute value (e. g.,red).
b) Manual mapping to visual relations Here a data relation (e. g.,part of) is mapped to a constant visual relation (e. g.,containment orlinking).
c) Dynamic, value-depending mapping o visual attributes A binding between values of data relations and graphic attributesdynamically depending on the relation between a set of values (e. g.,map the range of age values [0,100] to a range of colour values between red and yellow).
The assignment of styles with CSS is different from the definition of visual mappings for RDF properties for two reasons: First, styles are applied to parts of a structured document, while visual mappings directly refer to data relations and data values. Second, styles are usually not dynamic and value-dependent. Similar to mapping type (a), they define constant values – but usually with the intention to achieve a more aesthetic or readable presentation, rather than to encode data values. A calculation of values, type (c), could only be done with XSL, not with CSS (both languages will be compared in detail in the next section). The problem that we cannot attach styles directly to RDF properties is targeted by Fresnel, which we introduce in Sect. 4.3.1. Fresnel allows for describing how an RDF graph should be turned into a document structure and, in a second step, then allows for assigning styles to the elements of the newly created structure. To define visual mappings, we do not need to first transform a knowledge graph into a document shape.
2.1.7
Lessons Learned from Style Sheet Languages
– Separation of Concerns
Having pointed out the difference between styling and visual mapping, it is still worth looking at style sheet languages in more detail to learn from these languages. Therefore, we briefly introduce and compare the style sheet languages CSS and XSL. By separating the styling information from the rest of the document (structure and content), device independence is supported. Using a selection mechanism, the document parts that are to be styled can be selected and then be used in style rules.
CHAPTER 2. BACKGROUND
Cascading Style Sheets(CSS), initially CHSS, the H standing for HTML, were invented to prevent HTML from turning into a full »page description language« [Lie05]. They are now a W3C standard for defining presentation, not only of HTML webpages, but also of XML documents, vector graphics (SVG) and UIs (XUL1). The term cascading refers to a priority scheme that determines, which style to select in case of multiple applicable style rules. For example, styles are inherited (propagated) along the box structure of the document, i. e., inner elements will inherit style values from outer elements unless an explicitly defined style (with higher priority) overrides the more general, inherited one. Cascading also allows for combining styles from multiple style sheets, which distinguishes it from other style languages and lends itself for the use on the web.
CSS XSL
Declarative? [Lie05] yes yes
Can be used with HTML? yes no
Can be used with XML? yes yes
Transformation language? no yes
Loss of machine-readable semantics? [Lie05] no yes
Syntax CSS XML
Table 2.1: Comparison of XSL and CSS, extended after a table from the W3C’s »Web Style Sheets home page« [W3C13].
Extensible Stylesheet Language (XSL) is actually a bundle of W3C-recommended languages, consisting of XSL-Formatting objects (XSL-FO) – a page description language, Extensible Stylesheet Language Transformations (XSLT) as a language for transformations between XML documents and X-Path as a query language for (XML) trees, which provides the selection mechanism in XSL.
While both CSS and XSL are declarative and use the same formatting principles, impor-tant differences between the two languages exist: A major difference is that XSL follows a transformational approach, whereas CSS is interpreted by the presenting client. Lie points to the problems that occur with transformation-based style sheet languages: Applied on the server side »there will be a loss of semantics since the transmitted content is at a lower level of abstraction«. Applied at the client side he argues that »the browser will not be able to support progressive rendering of content where content is displayed in small chunks as the document is downloaded. Since the transformation may specify that the last element in the logical structure should come first in the presentational structure, the whole document must be downloaded before the transformation can take place«. Another difference between CSS and XSL is that XSL uses the syntax of XML, while CSS defines its own syntax. Table 2.1 summarises differences and commonalities between CSS and XSL.
2.2
Data
In this section, we define basic terms from the field of data such as what isstructured data
and how it relates to ontologies and ontological data. Further, we give a brief overview of the Semantic Web technologies mentioned in this thesis and clarify what is meant by
Linked Open Data.
1 XML User Interface Language. https://developer.mozilla.org/en-US/docs/Mozilla/Tech/XUL/,
2.2. DATA
2.2.1
Data – Information – Knowledge
Since we speak of visualising structureddata while many of the approaches we review in this thesis belong to the field ofinformation visualisation and some even use the termknowledge
visualisation, we briefly need to clarify these three terms, which are often used interchangeably in everyday language, but also in scientific literature. Chen et al. [CEH+09] tried to resolve the terminological confusion by introducing a set notation, which distinguishes between data, information and knowledge in theperceptual and cognitive space (P) on the one hand and the
computational space (C) on the other hand. For the perceptual space Chen et al. reuse the definitions from Ackoff [Ack89]:
Pdata Pinf ormation Pknowledge
symbols data that are processed to
be useful, providing answers to ‘who’, ‘what’, ‘where’, and ‘when’ questions
application of data and infor-mation, providing answers to ‘how’ questions
Cdata Cinf ormation Cknowledge
computerized representations of models and attributes of real or simulated entities
data that represents the re-sults of a computational pro-cess, such as statistical analy-sis, for assigning meanings to the data, or the transcripts of some meanings assigned by human beings
data that represents the re-sults of a computer-simulated cognitive process, such as per-ception, learning, association, and reasoning, or the tran-scripts of some knowledge ac-quired by human beings
2.2.2
Structured Data
Structured data is the prerequisite for visualising data, since we need to identify some structure in the data that we can map to visual means or use in interactions such as filtering and faceted browsing [Kar13]. This structure is defined by means of a data model such as a database schema, an XML schema – or an ontology. A definition ofontology will follow in the next subsection.
Often three classes of data are distinguished –unstructured data,semi-structured data and
structured data. While some agreement exists on the distinction between unstructured data (e. g., text documents, images) and structured data, the definition of semi-structured data is harder than it might appear at first sight. Abiteboul lines up the following main characteristics of semi-structured data (among others): »the structure is irregular«, »partial«, and »implicit«, »the schema is very large« and »the distinction between schema and data is blurred« [Abi97]. However, according to Buneman [Bun97], it is not always differentiated betweensemi-structured data and
unstructured data in literature.
A related question concerns the formality of the data: Instead of a three-fold classification, Uschold et al. [UG04] suggest a continuum of languages for data modelling (Fig. 2.4), ranging from glossaries and thesauri via XML and database schemas to frames, description logics and first-order logic. From left to right they describe an increasing »amount of meaning specified« and an increasing degree of formality, which leads to a reduction of ambiguity. Further, they also describe an »increasing support for automatic reasoning« (i. e., the ability to infer new explicit facts from implicit knowledge) towards the right end of the continuum. Formal ontologies, stated in logic languages, are at the rightmost end of the spectrum.
Rauschmeyer [Rau10] characterises structured data by five criteria: First, theflexibility of the schema, with respect to annotation and schema evolution. Second,globally unique symbols,
to ensure all data on a given concepts can be gathered from distributed sources and third, simple
CHAPTER 2. BACKGROUND
cross-referencing and fifth,standardised exchange formatsto allow for applying external tools. Ontologies written in standard ontology languages, as described in the next subsections, fulfil these criteria. XMLDTDs Terms structured Glossaries adhoc Hierarchies (Yahoo!) 'ordinary' Glossaries Data Dic�onaries (EDI) Thesauri Pricipled, informal Hierarchies XML Schema DB Schema formal Taxonomies Descrip�on Logics (OWL-DL) DataModels (UML,STEP) Frames (OKBC) General Logic Glossaries&
Datadic�onaries Thesauri,Taxonomies MetaData,XMLSchemas &DataModels
FormalOntologies &Inference
Figure 2.4: Continuum of data modelling languages (simplified, after Uschold et al. [UG04]).
Uschold et al. refer to all these languages as ontologies, while we only use the termOntology where we
2.2. DATA
2.2.3
Ontologies in Computer Science
An often cited definition for ontologies in computer science was given by Gruber [Gru93]: »An ontology is an explicit specification of a conceptualization.« Guarino et al. [GOS09] give a good overview of how this broad definition was combined by Studer et al. [SBF98] with the definition from Borst [Bor97] to include the two additional aspects of beingformal, i. e., machine-readable, andshared. For the readers of this thesis, we also consider the following excerpt of a more verbose definition ofOntology helpful, which was given by Gruber in 2009 [Gru09] pointing out the differences and commonalities between an ontology and a database:
»
[. . . ] an ontology defines a set of representational primitives with which to modela domain of knowledge or discourse. The representational primitives are typi-cally classes (or sets), attributes (or properties), and relationships (or relations among class members). The definitions of the representational primitives include information about their meaning and constraints on their logically consistent ap-plication. In the context of database systems, ontology can be viewed as a level of abstraction of data models, analogous to hierarchical and relational models, but intended for modelling knowledge about individuals, their attributes, and their relationships to other individuals. Ontologies are typically specified in languages that allow abstraction away from data structures and implementation strategies; in practice, the languages of ontologies are closer in expressive power to first-order logic than languages used to model databases. For this reason, ontologies are said to be at the »semantic« level, whereas database schema are models of data at the »logical« or »physical« level. Due to their independence from lower level data models, ontologies are used for integrating heterogeneous databases, enabling interoperability among disparate systems, and specifying interfaces to independent, knowledge-based services. [. . . ]Thomas R. Gruber [Gru09]
«
Ontologies usually consist of two components, theT-Box(terminological component) containing classes, relations and their properties and theA-Box(assertion component) containing state-ments about instances or individuals. While the OGVIC approach also supports the visualisation of the T-Box, we sometimes use the termontological data, orontology instance datato stress that we are foremost concerned with visualising instance data and not the »schema« of ontologies2.
2.2.4
The Semantic Web and its Languages
In this thesis, we focus on ontologies written in the languages standardised by the W3C as part of the Semantic Web technology stack.
The Resource Description Framework (RDF) [RDF04a] is the basis of this stack. It allows for describing a graph and offers the principle of defining simple statements as triples consisting of subject, predicate, object. The RDF Schema (RDFS) [RDF04b] allows for defining relations (properties in RDFS) and classes for typing the RDF data. The Web Ontology Language (OWL) [OWL04] allows for using Description Logics to reason about RDF resources. Following the principle of Description Logics, which allow for describing a specific logic by combining the required operators, also OWL is not one single language, but was specified as a language family in three variants with different expressivity and decidability.
OWL Full offers the maximum expressivity. OWL Light offers decidability, but focuses on a few basic language constructs, which are sufficient to describe taxonomies, for example. OWL DLis
2 Some authors use the termontology only for the T-Box andinstance datafor the A-Box, e. g., in [UG04]
CHAPTER 2. BACKGROUND
a compromise, which offers reasonable reasoning times for many purposes at the cost of some constraints on expressivity, e. g., relations (properties) may not appear as objects or subjects in a statement. Our approach is specific to OWL and not only RDFS, since with OWL it is possible, for example, to define characteristics of relations such assymmetry ortransitivity.
In the following, we give a brief overview on some important concepts of OWL that we refer to in the next chapters. To describe classes by restrictions, OWL provides:
owl:allValuesFrom is equivalent to the universal quantifier (∀) from predicate logic. Restrict-ing a classC1on a propertyP1toC2using owl:allValuesFrommeans that an individual belonging to classC1 is any individual that is related byP1only to individuals belonging toC2.
owl:someValuesFrom is equivalent to theexistential quantifier (∃) from predicate logic. Re-stricting a class C1 on a property P1to C2using owl:someValuesFrom means that an individual belonging to classC1is any individual that is related byP1to at least one individual belonging toC2.
Furthermore, we sometimes refer to different classes of properties that OWL defines: owl:ObjectProperty is used to relate individuals.
owl:DataProperty is used to relate individuals to data values, e. g., integers or strings. SPARQL[SPA08] was developed as a query language for RDF data. Similar to SQL, queries can be formulated to select a tabular result set from an RDF graph (SELECT operation), or to construct a new RDF graph from the data (CONSTRUCT operation). From version 1.1, the SPARQL Query language is accompanied by a set of related recommendations such as the SPARQL 1.1 Update Language[SPA13], which provides functionality to delete triples and create new ones. The UPDATE, INSERT and DELETE operations introduced in SPARQL 1.1, expand SPARQL from a query language to a means for manipulating RDF data.
A benefit of focusing on the RDF technical space, is the wide spreading of ontologies written in RDFS and OWL. For many ontologies written in other popular formats – such as OBO [OBO] in the life science domain – translations to OWL exist [GHH+07].
2.2.5
Linked Data and Open Data
While many websites are internally based on structured data sources (e. g., relational databases like MySQL), data is usually only provided as unstructured documents to the users as HTML pages or PDF files. This lack of raw data has been criticised, for example, by Tim Berners Lee [BHBL09], who requests to open up data silos and provide structured data in machine-readable formats.
Linked datamakes structured data available for use. The idea is that browsers are enabled to download new information (new RDF triples) on a resource, by dereferencing its URI (Uniform Resource Identifier) and interpreting it as a URL [BHBL09]. The triples downloaded from the URL can point to further URIs, which the browser can follow in turns and so forth and so on, which has been called the »follow-your-nose strategy« (e. g., [Hau09]). First sources of Linked Data were the DBpedia3, an extract from structured Wikipedia data, and Freebase4.
The paradigm of Open Dataaims at data that is (among other criteria) freely accessi-ble [BK12]. Open Data can be stored in relational databases and made availaaccessi-ble for editing by the crowd. For example, on factual.com5 tables of Open Data can be edited. This means Open Data does not necessarily be stored asLinked Open Data, although the terms are often used in conjunction.
3 http://www.dbpedia.org; [ABK+07]
4 Freebase has been announced to be shut down.. http://www.freebase.com, accessed: 02.07.2015. 5 Factual. http://www.factual.com, accessed: 02.07.2015.
2.2. DATA
2.2.6
The Metamodelling Technological Space
Having provided some background on the ontology technological space and the technologies of the Semantic Web, we also need to briefly describe its counterpart commonly used in the software modelling domain – the metamodelling technological space. A definition ofmetamodelis given by Seidewitz:
»
A metamodel makes statements about what can be expressed in the valid modelsof a certain modelling language.Ed Seidewitz [Sei03]
«
Beyond this very general definition,metamodelling is often associated with the technologies and standards defined by theObject Management Group6 (OMG), such as theMeta Object Facility7(MOF). MOF is the metadata architecture the OMG recommends for metamodelling. It is a four-layered architecture consisting of four layers: M0 (objects, e. g., the objects in a program written in an object-oriented programming language), M1 (models, e. g., a concrete UML model), M2 (metamodels, e. g., UML), and M3 (the metametamodel). The layer M3 is the last layer, since it can be used to express the MOF in itself. As a means to specify constraints and object query expressions to a MOF model, theObject Constraint Language8
(OCL) is recommended by the OMG.
In this thesis we sometimes refer to Eclipse-specific9 technologies such as the Eclipse Modeling Framework10(EMF). The EMF implementation of the MOF isEcore.
2.2.7
SPIN
TheSPARQL Inferencing Notation11 (SPIN) [KHI11] is a W3C Member Submission promoted byTopQuadrant12. It represents SPARQL in RDF, so that it can be stored alongside the data that is queried. SPIN further is a set of RDF vocabularies that allow for defining inference rules and constraints. Defining a constraint on an RDFS class is similar to how constraints can be added to UML classes with OCL. Beyond rules and constraints, SPIN also allows for defining functions, reusing queries by parametrisable templates, and specifying attributes, like in UML. Thereby, SPIN brings the object-oriented paradigm and metamodelling capabilities to (RDF-based) ontologies.
Besides proprietary implementations of SPIN for products of TopQuadrant, an open-source implementation of SPIN, the SPIN API13, is available. Since constructs such as constraints and rules represent encapsulated SPARQL and SPARQL Update requests, they can internally be processed by a SPARQL engine.
We already refer to SPIN and related technologies such as UISPIN during the analysis of the state of the art (Sect. 4.3.1). Additionally, we discuss SPIN in more detail under various aspects in the remainder of this thesis: In the context of the RVL language (Sect. 7.11), we use the metamodelling capabilities of SPIN. In the context of guidance (Sect. 8.1), we use SPIN for formulating further constraints that are evaluated to guide the visualisation process.
6 Object Management Group. http://www.omg.org, accessed: 02.011.2015. 7 Meta Object Facility. http://www.omg.org/mof/, accessed: 02.011.2015.
8 Object Constraint Language. http://www.omg.org/spec/OCL/, accessed: 03.11.2015. 9 Eclipse. http://www.eclipse.org, accessed: 02.07.2015.
10Eclipse Modeling Framework. http://www.eclipse.org/modeling/emf/, accessed: 02.07.2015. 11SPIN. http://spinrdf.org/, accessed: 02.07.2015.
12TopQuadrant. http://www.topquadrant.com, accessed: 02.11.2015. 13SPIN API. http://topbraid.org/spin/api/, accessed: 02.11.2015.