Dissertations and Theses in Biological Sciences Biological Sciences, School of
Summer 6-6-2017
Nitrogen Addition and Ecosystem Functioning:
Changes in Species Composition Leaf Traits
Amplify Increases in Leaf Area Index and Canopy
Chlorophyll
Anna R. Tatarko
University of Nebraska-Lincoln, [email protected]
Follow this and additional works at:http://digitalcommons.unl.edu/bioscidiss
Part of theBiology Commons, and theEcology and Evolutionary Biology Commons
This Article is brought to you for free and open access by the Biological Sciences, School of at DigitalCommons@University of Nebraska - Lincoln. It has been accepted for inclusion in Dissertations and Theses in Biological Sciences by an authorized administrator of DigitalCommons@University of Nebraska - Lincoln.
Tatarko, Anna R., "Nitrogen Addition and Ecosystem Functioning: Changes in Species Composition Leaf Traits Amplify Increases in Leaf Area Index and Canopy Chlorophyll" (2017).Dissertations and Theses in Biological Sciences. 94.
NITROGEN ADDITION AND ECOSYSTEM FUNCTIONING: CHANGES IN SPECIES COMPOSITION LEAF TRAITS AMPLIFY INCREASES IN LEAF AREA
INDEX AND CANOPY CHLOROPHYLL
by
Anna R. Tatarko
A THESIS
Presented to the Faculty of
The Graduate College at the University of Nebraska
In Partial Fulfillment of Requirements
For the Degree of Master of Science
Major: Biological Sciences
Under the Supervision of Professor Johannes M. H. Knops
Lincoln, Nebraska
NITROGEN ADDITION AND ECOSYSTEM FUNCTIONING: CHANGES IN SPECIES COMPOSITION LEAF TRAITS AMPLIFY INCREASES IN LEAF AREA
INDEX AND CANOPY CHLOROPHYLL
Anna R. Tatarko, M.S.
University of Nebraska, 2017
Advisor: Johannes M. H. Knops
Increased nutrient inputs can cause shifts in plant community composition and plant functional traits, both of which affect ecosystem function. We studied community-and species-level changes in specific leaf area (SLA), chlorophyll, leaf thickness, leaf toughness, plant height and leaf dry matter content (LDMC) in a full factorial nitrogen (N), phosphorus (P), potassium (K) fertilization experiment in a semi-arid grassland. Nitrogen was the only nutrient addition to significantly affect leaf functional traits, and N addition increased community weighted SLA by 19%, leaf chlorophyll content by 34%, height by 26%, and resulted in an 11% decrease in LDMC while leaf thickness and toughness did not change significantly. At the species level, most species contributed to the community weighted trait and increased in SLA, chlorophyll, height and LDMC with N. These intraspecific changes in functional traits account for 51% - 71% of the
community-level increase in SLA and chlorophyll and plant height and decrease in LDMC. The remaining change is due to species abundance changes; the two most
abundant species (Bouteloua gracilisand Carex filifolia) decreased in abundance under N addition while subdominant species increased in abundance. We also found annual
traits as N addition, likely due to differences in precipitation. Aboveground net primary productivity (ANPP) did not change significantly with N addition. However, N addition caused a 34% increase in leaf area index (LAI) and a 67% increase in canopy chlorophyll density. We demonstrate that nitrogen-induced changes in functional traits and species abundances can have profound effects on community structure and function which can magnify changes ANPP as reflected by LAI and canopy chlorophyll density. Therefore, ANPP may underestimate ecosystem level changes in the canopy vegetation.
ACKNOWLEDGEMENTS
This work would not have been possible without the guidance of my advisor, Dr. Johannes Knops who has helped me develop my findings into a story. To my committee members, Dr. Dai Shizuka, Dr. Chad Brassil, and Dr. Sabrina Russo, I am sincerely grateful for the help focusing my studies, analyzing my data, and editing my manuscripts, among many other tasks. I would also like to thank SBS Special Funds and the J. Ve. Srb Memorial Fund for providing financial assistance.
The School of Biological Sciences family has provided me support and
encouragement, for which I am extremely grateful. In particular, I’d like to thank my lab, Cathleen McFadden, Yi Yang, and Kyle Funk for propagating ideas, cultivating
discussion, fostering my growth, and for being great buds. In addition, I would like to thank Jay Stafstrom for all of his thoughtful advice, motivation, and for reminding me that sometimes science is more art than science. Shivani Jadeja and Teresa Ely, thank you for your research help and the unforgettable adventures.
To my siblings, Peter and Sarah Tatarko, who inspire me, make me laugh, and are the best dog sitters a pup could ask for. Finally, to my parents Beth and John Tatarko, all of this has been made possible by your love and encouragement. Thank you.
TABLE OF CONTENTS Introduction ...1 Methods...7 Results ...13 Discussion ...16 References ...23 Multimedia Objects ...30
Table 1. MANOVA of nutrients effect on the suite of community weighted functional traits ...30
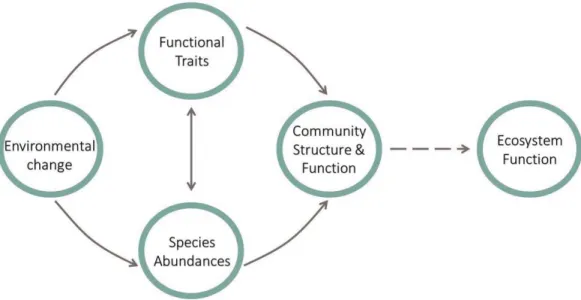
Figure 1. Conceptual diagram demonstrating how environmental change scales up to effect ecosystem function ...31
Figure 2. Nitrogen’s effecton community weighted functional traits ...32
Figure 3. Intraspecific change in abundance and functional traits with nitrogen ...33
Figure 4. Interaction of year and nitrogen addition on functional traits ...34
Figure 5. Nitrogen’s effecton productivity, leaf area index, and canopy chlorophyll density ...35
Appendix ...36
Table S1 ...36
INTRODUCTION
Human activities are altering the availability of resources in ecosystems
worldwide and environmental change can cause shifts in plant community structure and function (Vitousek et al. 1997, Peters and Meybeck 2000, Baer et al. 2004). Many studies examining the effects of environmental change on plant communities focus on its isolated impact on community composition, functional trait values, or above ground net primary productivity (ANPP) (Stevens et al. 2004, 2015, Yavitt et al. 2011, Fay et al. 2015, Harpole et al. 2016). Few studies consider the simultaneous effect of environmental change on both species functional traits and abundances, and how these effects scale up to alter community structure and function (La Pierre and Smith 2014, Siefert and Ritchie 2016). However, environmental change has the potential to indirectly alter ecosystem functions such as the cycling of water, nutrients, and energy by altering the physiology or morphology of individuals and structure of communities (Figure 1, Dı́az and Cabido 2001, Suding et al. 2008). Therefore, considering each level of ecological organization is crucial for our understanding and prediction of how environmental changes scales to influence ecosystem functions.
Studies using functional trait approaches have become widespread in plant
community ecology due to their universality and potential for understanding mechanisms of community structure and function (Lavorel and Garnier 2002, McGill et al. 2006, Violle et al. 2007). Plant functional traits can be defined as morphological, physiological, or phenological features which represents an individual’s ability to grow, survive, or reproduce (Violle et al. 2007). Functional traits vary along environmental gradients and can provide insights to community and ecosystem function in a variety of ecosystems
(Dı́az and Cabido 2001, Wright et al. 2004, Violle et al. 2007, Cornwell and Ackerly 2009). For example, specific leaf area (SLA, measured as leaf area per dry mass) is correlated with litter decomposition, photosynthetic capacity, growth, and productivity, which are factors that play key roles in ecosystem processes (Reich et al. 1997, Garnier et al. 2004). SLA has been shown to increase with increasing resource availability, which is related to faster growth, higher nutrient use, shorter lived leaves, and low water retention (Fonseca et al. 2000, Knops and Reinhart 2000, Wright et al. 2004). Leaf chlorophyll content itself is an indicator photosynthetic capacity, but is also highly correlated with leaf nitrogen content, which is important for plant growth and photosynthesis (Chapman and Barreto 1993, Wright et al. 2004). Plant height which is related to light capture, potential lifespan, and competitive ability, responds strongly to resource availability (Tilman 1987, Fonseca et al. 2000, Pérez-Harguindeguy et al. 2013). Leaf thickness, leaf toughness, and leaf dry matter content (LDMC), which are important for herbivory resistance and the retention of nutrients and water, tend to be higher in lower nutrient environments where leaves may be costly to replace (Choong et al. 1992, Cunningham et al. 1999, Pérez-Harguindeguy et al. 2013).
Community-level functional responses can be measured by weighing species traits by abundance so as to reflect the functional characteristics of dominant species (Grime 1998). This ‘community weighted trait’ allows for comparisons of communities with different composition, and thus we can investigate community-level responses to environmental change. However, when scaled to the community level, it can be challenging to assess whether changes in community functional traits are due to
turnover), or both. Studies have shown that intraspecific trait changes due to biotic and abiotic factors can be substantial (Albert et al. 2011). Nutrient additions also create novel environmental conditions in which certain species may gain a competitive edge,
outcompeting resident species and causing diversity loss and declines in species richness (Stevens et al. 2004, Funk 2008, Harpole et al. 2016). This change in abundance may cause a shift in ecosystem functioning by changing which species dominates the community level response. Ignoring the effects of either of these factors can lead to a mischaracterization of the community response to environmental change and partitioning the effects of each can help us quantify their respective effects on ecological processes (Grime 1998, Bolnick et al. 2011). It is possible that community weighted traits may only reflect the responses of dominant species, although rare species have been shown to contribute novel traits to measures of community functional diversity and may influence ecosystem function (Jain et al. 2014). In addition, functional traits have been shown to vary consistently with the environment at multiple scales and across multiple species (Reich et al. 1997, Siefert and Ritchie 2016). Disentangling each of these effects could help predict how communities will respond to changes in nutrient inputs and understand the implications of these shifts.
Leaf area index (LAI) or total leaf area per ground area (m2 m-2), and canopy chlorophyll density per square meter (mg m-2) are additional measures of community structure and function. LAI is calculated as the product of community weighted SLA and ANPP, and canopy chlorophyll density is the product of community weighted chlorophyll and LAI. Therefore, changes in SLA and ANPP for example, could cause a change of a larger magnitude in LAI, or counteract the change altogether. While ANPP reflects
accumulated aboveground biomass, LAI and canopy chlorophyll content better reflect ecosystem consequences of environmental change because they directly influence ecosystem ability to gain carbon and transfer water and energy (McWilliam et al. 1993, Chaves et al. 2002, Chapin et al. 2011). However, how ANPP and trait changes scale to canopy parameters such as LAI and canopy chlorophyll content is rarely examined.
Resource availability, mainly nitrogen (N), limits growth of terrestrial vegetation in many ecosystems, and N limitation of ANPP is particularly widespread (Vitousek and Howarth 1991, Lebauer and Treseder 2008, Vitousek et al. 2010, Stevens et al. 2015). Other nutrients such as phosphorus and in some cases, potassium and micronutrients, can also limit ANPP in some ecosystems, but N limitation predominates in temperate
ecosystems (Fay et al. 2015). Grasslands in particular are unique ecosystems as their productivity in a given year may be limited by nutrient availability (Fay et al. 2015) and also water availability (Heisler-White et al. 2008, Yang et al. 2008). Our study site, Cedar Point, is a relatively dry grassland and in a recent study, Wang et al. (in press) found productivity to be limited by precipitation in dry years and N in wet years. This relationship results in large annual variability of ANPP with N addition. Species functional traits have been found to respond to water gradients as well as nutrient availability (Fonseca et al. 2000, Wright et al. 2004, Cornwell and Ackerly 2009). This allows us to ask questions about the role of precipitation and nutrients in determining community structure and function.
We used a nutrient addition experiment to investigate how community structure and function change with nutrient addition, and what drives these changes. We also examined functional trait differences across years with differences in precipitation. This
study was carried out within the Nutrient Network, a global collaboration of grassland sites which examines nutrient limitation and its influences on the diversity-productivity relationship and its stability over time (Borer et al. 2014b). However, few studies within this experiment have examined functional traits (La Pierre and Smith 2014). We
hypothesized, (1) that N alone will cause a shift in community functional traits because of its known site-level importance for ANPP (Wang et. al., in press), while P and K will not have an effect; (2) community weighted traits will shift under N addition toward traits associated with faster growth rates and higher resource use (increased SLA, chlorophyll, height, and lower thickness, toughness, and LDMC); (3) at the species level, N addition will cause a shift in functional traits in the same direction as the community traits and will not be seen in the dominant species alone; (4) increases in community weighted SLA, chlorophyll, will magnify ANPP increases with N addition to larger percent increase in LAI and canopy chlorophyll density; and (5) an increase in precipitation will also cause shifts in functional traits toward traits associated with faster growth rates and higher resource use (increased SLA, chlorophyll, height, and lower thickness, toughness, and LDMC).
METHODS
Study Area
This study was conducted from late May to early August, 2015 at Cedar Point Biological Station in Western Nebraska, USA (41°.12′ N, 101°.38′ W). The site is a natural short grass prairie located on an upland summit located south of Nebraska’s Sandhill region in
a moderate relief grassland east of Lake McConaughy (Chapman et al. 2001). The elevation of the study site is 965 m above mean sea level and annual precipitation ranges from 190 to 565 mm from September to August. In the study year of 2015, the summer was particularly wet, receiving 236 mm of precipitation. The summer months of June to August have a relative humidity of 59.1% with average daily temperatures ranging from 15.4qC - 30.1qC. In the winter months of December to February, the relative humidity is 65.0% and average daily temperatures range from -7.4qC - 5.1qC. All climate data are based on 1996-2016 weather data from Cedar Point HPRCC Weather Station (HPRCC 2017).
Dominant species in this grassland include perennial C4 grasses such as Bouteloua gracilis, C3 grasses such as Hesperostipa comata and the perennial sedge Carex filifolia. Perennial shrubs Artemisia frigida and Artemisia filifolia also are abundant species in this grassland, and in some years, annual species such as Bromus tectorum and Helianthus annuus may become abundant. Species identity and functional type were verified with the USDA PLANTS database (USDA and NRCS 1995), Farrar (2011) and Barnard (2014).
Experimental Design
The plots used in this study are a part of the Nutrient Network (NutNet), a global collaboration of grassland ecosystems with nutrient addition and herbivore exclusion experiments, and therefore follow the core NutNet protocol (Borer et al. 2014a). The site contains 60, 5x5 m plots in a three-factorial design consisting of control plots with no
manipulation, plots with nitrogen (N), phosphorus (P), and potassium plus micronutrients (K) for a total of eight nutrient treatment combinations. In addition, there are two fencing treatments (n = 12 plots) designed to keep out herbivores; these plots were not utilized in this study. Each of the 8 fertilizer treatments were replicated six times in a randomized block design for a total of 48 plots. The nutrient treatments have been applied annually in late May or early June since 2008 at 10 g m-2. N was applied as time-release urea
[(NH2)2CO], P as triple-super phosphate [Ca(H2PO4)2], and K as potassium sulfate [K2SO4]. The micronutrient mix, which was only applied in 2008, included Fe (15%), S (14%), Mg (1.5%), Mn (2.5%), Cu (1%), Zn (1%), B (0.2%), and Mo (0.05%), applied as iron sulfate, calcium magnesium carbonate (dolomite), manganese sulfate, copper sulfate pentahydrate, zinc sulfate anhydrous, sodium borate, and sodium molybdate,
respectively. The treatments are referred to by their primary nutrient supplements of nitrogen (N), phosphorus (P), and potassium (K).
Species abundance data were collected annually in a 1x1m subplot in late June. Species abundances were visually estimated to the nearest 1% percent vegetation cover within the 1x1 m subplot using a modified Daubenmire method (Daubenmire 1959). All aboveground standing biomass were clipped in two 10 x 100 cm strips in each plot in late June. Collected biomass samples were dried at 60℃ to constant dry weight and were weighed to the nearest 0.01g to estimate ANPP. Light interception was estimated by taking two measurements at ground level from opposite corners of the 1x1 m subplot and one measurement above the canopy with a 1-m LI-191R Line Quantum sensor (LI-COR, Lincoln, NE, USA).
Functional traits were measured from plants in the remaining plot area in the summer of 2015. In total, 51 species were sampled. Of these species, 17 were early season species sampled in late May and June whereas the remaining 34 were late season species sampled in July and early August. The functional traits measured for each species include: Specific leaf area (SLA), chlorophyll content, height, leaf thickness, leaf
toughness, and leaf dry matter content (LDMC). For each species, plant standing height (cm) was recorded as average vegetative height for grasses and reproductive height for forbs for 1-10 individuals. Leaf functional traits were obtained by collecting the last, fully expanded leaves from several mature and undamaged individuals of that species,
collecting enough leaf matter to have at least 0.3 g dry mass. Leaves were then taken to the lab and scanned using a LI3000 (LI-COR, Lincoln, NE, USA) to determine leaf area (cm2). Measurements were also taken for chlorophyll (mg/m2) using Chlorophyll Content Meter Model CCM-300 (Opti-Science, Hudson, NH, USA), leaf thickness (mm) using Digimatic Micrometer Series 293 MDC-MX Lite (Mitutoyo, Aurora, IL, USA), and toughness (g) using 516-1000M Push Pull Gauge (Chatillon, Largo, FL, USA). The leaves were then dried in a forced air oven at 60℃ for 3 days or until constant dry weight. SLA was recorded as leaf area per dry mass (cm2 g-1) and LDMC was recorded as dry mass per fresh mass (mg g-1). Trait values were pooled by species for each plot to obtain an average trait value for each species within a plot.
To assess annual functional trait variation, we collected functional trait data in 2016 using the same field methods. Whereas 2015 was a wet year, 2016 was much drier, only receiving 116 mm of precipitation. To evaluate functional trait plasticity across
these two years, we used a subset of 12 species which were common in both years, occurring in at least 3 N added and 3 non-N added plots in both years.
Analyses
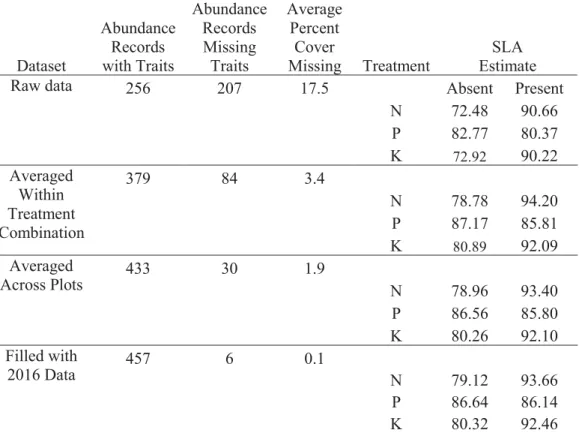
In total, we measured abundance for 51 species in all 60 plots at the site (463 observations x plot combinations). Functional trait data were not collected for every species observation in each plot. Of 463 occurrences of species in the 60 plots, we did not collect functional trait data for 207 occurrences, which accounts for an average 17.5% cover per plot (0.5% - 69.5%). Missing traits were substituted with the average trait values for the same species occurring in plots with the same fertilizer treatment combination or, where this was not possible due to lack of observations, missing traits were replaced with average values across all plots in which the species was found or from data collected in 2016 using the same methods. Differences between the substituted and raw datasets were assessed with a generalized linear model and were insignificant (Supplemental Table 1).
Community weighted traits were used to make comparisons across plots with different species compositions. This was calculated by summing the weighted trait values (product of species trait and abundance) for each species in a plot and dividing by the total abundanceof a plot to account for differences in total abundance from plot to plot. Changes in the resulting community weighted trait from plot to plot can be due to either species abundance changes (including species turnover) or intraspecific trait changes. To partition the effects of each of these two components, we used fixed community traits
following methods from Lepš et al. (2011). The fixed-community weighted trait assigns each species a fixed trait value, which was the mean trait value in the control plots for a species. Any change in the fixed-community weighted trait under fertilizer addition for example, can only be due to species abundance changes. Therefore, this fixed-community weighted trait can quantify how much of the community weighted trait change is due to abundance changes and intraspecific trait changes.
Multivariate analysis of variance (MANOVA) was used to assess the effects of fertilization on the suite of community weighted functional traits (see methods for community weighted trait below). The Pillai test statistic was used to assess the MANOVA’s goodness of fit. Nitrogen was the only fertilizer to effect community weighted traits (MANOVA, F = 17.31, p < 0.001, Table 1). Therefore, all fertilizer treatments were combined into two groups, with N addition and without N addition. Linear mixed-effects models with Gaussian distribution were then used to determine whether N addition predicts the community weighted trait, LAI, canopy chlorophyll density, and ANPP. Addition of N fertilizer was included as a fixed effect (coded as 1 or 0 for with and without N addition), and block was included as a random effect to account for natural variation between blocks. Models were checked for heteroscedasticity and no transformations were needed. Type II Wald Chi-square tests were used to assess the goodness of fit of each model.
Finally, individual species responses were assessed by observing the change in average trait value between treatments. Species that occurred in two or fewer plots or that required traits to be replaced with the average (as described above) in over half of their observations were not included in this analysis. A generalized linear model with Gaussian
distribution was then used to determine if the change is best explained by unique groups of species. Predictor variables were percent of total abundance, flowering (early or late), duration (annual or perennial), and growth habit (graminoid, forb, shrub ect.)
(Supplemental Table 2). We did not distinguish between C3 and C4 grasses or annual and biennial due to lack of sample size of C4 and biennial species. Predictor variables were also checked for correlation to avoid including highly correlated variables in the same model. No variables were highly correlated, though growth habit and duration were slightly correlated (r = 0.48). We also assessed species evenness in the fertilized and unfertilized plots using Pielou's evenness index. Functional trait data were also collected in 2016 using the same field methods. To evaluate functional trait plasticity across these two years, we used a subset of 12 species which were common in both years, occurring in at least 3 N fertilized and 3 non-N fertilized plots in both years. We used linear mixed-effects models with Gaussian distribution to see if nitrogen addition (coded as 0 or 1), year (coded as 0 for 2015 and 1 for 2016), and their interaction could predict SLA, chlorophyll, and plant height. Species and block were included as a random effect to account for their natural variation.
All statistical analyses were carried out in R version 3.3.1 (Development Core Team 2014) using the lmer function from the lme4 package (Bates et al. 2014), Type-II Anovas from the car package(Fox and Weisberg 2011), and glht function from the multcomp package (Hothorn et al. 2008).
Community-Level Traits
Nitrogen addition significantly influenced the community weighted traits
(MANOVA, F = 17.3, p < 0.001), but P, K, and all other pairwise combinations did not have an effect (Table 1). Therefore, we combined all nutrient addition treatments into two groups, with and without N addition. Nitrogen addition had a significant effect on four of the six community weighted traits measured in this study (Figure 2). Community SLA increased by 19% with N addition (X2 = 6.3, p = 0.012). Nitrogen addition also caused a 32% increase in community weighted chlorophyll and a 26% increase in community weighted plant height (X2 = 65.5, p < 0.001 and X2 = 23.6, p < 0.001 respectively). Community LDMC decreased by 11% with the addition of N (X2 = 11.5, p < 0.001). Community leaf thickness and leaf toughness did not respond significantly to N addition (X2 = 1.3, p = 0.251 and X2 = 2.8, p = 0.094 respectively).
We found that 51% - 71% of the change in community weighted traits was due to intraspecific trait changes and the remaining 29 - 49% to abundance changes. Community level chlorophyll concentration had the largest change in intraspecific traits. When N was added, the community weighted chlorophyll increased by 111 mg cm-2 whereas only 31.9 mg cm-2 (or 29%) was attributed to abundance changes. The remaining increase of 71.9 mg cm-2 or 71% was attributed intraspecific trait changes. Of the 15.1 cm2 g-1 increase in community weighted SLA with the addition of N, 4.6 cm2 g-1 (30%) of the change was attributed to variation in species abundances and the remaining increase of 10.5 cm2 g-1 (70%) was caused by intraspecific change in SLA. Community weighted plant height increased by 9.9 cm under N addition, 3.8 cm (38%) was attributed to species abundance changes and the remaining 6.1 cm (62%) is due to species level changes in height.
Finally, community weighted LDMC decreased by 50.6 mg g-1 with N addition with 24.6 mg g-1 (49%) of this decrease was caused by abundance changes and the remaining 24.0 mg g-1 (51%) was caused by intraspecific trait changes.
Species level changes
Neither abundances changes nor trait changes were predicted by any functional groups of species (p > 0.05, Figure 3). The two most dominant species Bouteloua gracilis and Carex filifolia declined in their abundance with N fertilization. All other species, with the exception of Dichanthelium oligosanthes,increased in abundance with the addition of N. There was an increase in plot evenness with the addition of nitrogen but the trend was not significant (J' = 0.75 without N, and J' = 0.73 with N, p = 0.10). Most species increased in SLA with the addition of N with an average increase of 6.7 cm2 g-1 within the 15 species with sufficient sample size. Only 4 moderately abundant to rare species declined in SLA. Notably, most species increased substantially in chlorophyll concentration, except for Agropogon smithii and Helianthus annuus. The average change in chlorophyll with N was an increase of 74.4 mg cm-2 within the 15 species tested. Plant height under the addition of N also increased across species with the exception of
Hesperostipa comata and four, predominantly rare, species. Overall, plants increased by an average of 6.4 cm with N fertilization. Finally, 10 of 15 species decreased in LDMC with an average decrease of 10.4 mg g-1 with the addition of N.
In both 2015 and 2016, N had a significant effect on species level SLA, chlorophyll, plant height, and LDMC (Figure 4). The year and N addition interaction
significantly influenced SLA, but no other functional traits. Nitrogen addition had the strongest effect on SLA in 2015, a Tukey post hoc comparison did not find a difference between the nitrogen and non-nitrogen plots in 2016 (p = 0.16). On average, N addition caused an 11% increase in SLA or an increase of 9.4 cm2 g-1, a 29% increase in
chlorophyll or 94.0 mg cm-2, a 28% increase in height or 10.3 cm, and a 7% decrease in LDMC or an average decrease of 27.2 mg g-1. However, from 2015 to 2016, there was an 11% decrease in average SLA (11.1 cm2 g-1), a 26% decrease in average chlorophyll (108.1 mg cm-2), a 14% decrease in average plant height (5.8 cm), and an average increase of 8% in LDMC (29.0 mg g-1).
ANPP, LAI, and canopy chlorophyll density
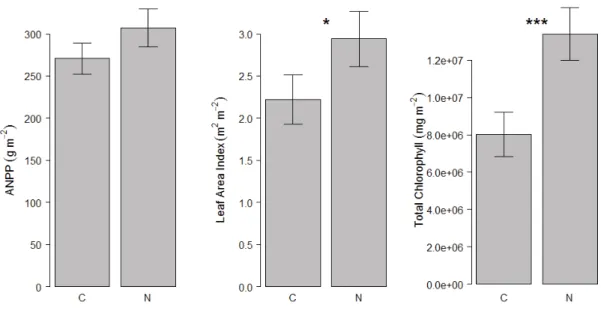
ANPP did not have a significant response to N addition (X2= 2.133, p = 0.144, Figure 5). Both the LAI and canopy chlorophyll density increased significantly under the addition of N (X2= 5.307, p = 0.021 and, X2= 5.953, p < 0.001 respectively). The
magnitude of change in LAI and canopy chlorophyll density was greater than those of community weighted SLA and chlorophyll. Community weighted SLA increased by 19% and the community weighted chlorophyll increased by 32%, whereas the LAI showed a 34% increase and the canopy chlorophyll density nearly doubled with a 67% increase.
DISCUSSION
Nitrogen addition was the only fertilizer treatment to significantly affect the suite of community weighted functional traits. This is consistent with the findings of Wang et al. (in press) which demonstrated that N was the only nutrient limiting ANPP across years at Cedar Point. Cedar Point contains shallow and rocky soil which are part of the Tassel series formed from calcareous sandstone which are high in cations and potassium (Scheinost et al. 1995), which may explain why K addition had no effect. Further, Cedar Point’s shallow soil is young and may have adequate weathering to prevent P limitation in soil (Scheinost et al. 1995). Thus, these sources of soil P, K, and cations may have led to stronger N limitation. However, other experiments within the Nutrient Network have found other nutrients to be important. For example, Fay et al (2015) found N to limit ANPP at 11 sites out of 31 which showed some nutrient limitation while P and K were limiting at 12 and 5 sites respectively, often this limitation occurred in the form of co-limitation. Other studies have reported that P, K, and cations can have effects on individual traits or other metrics of community structure and function (Fonseca et al. 2000, Vitousek et al. 2010, La Pierre and Smith 2014, Fay et al. 2015). Thus, how communities and functional traits respond to nutrient addition may vary across sites if different nutrients are limiting.
Community weighted functional traits
Nitrogen had significant effects on community weighted SLA, chlorophyll, height, and LDMC. This is consistent with other studies of the effect of nutrient addition on these functional traits (Tilman 1987, Knops and Reinhart 2000, Wright et al. 2004, Al Haj Khaled et al. 2005). La Pierre and Smith (2014) did a similar study within the
Nutrient Network at a tallgrass prairie site in Kansas (USA) examining functional trait response to nutrient addition. They found an increase in traits like SLA and plant height with P addition and a decrease in LDMC with N addition, but no relative change in leaf thickness or toughness. According to Fay et al. (2015), productivity at this site is co-limited by NP, which may explain some differences in functional trait response to nutrients between this site and our own. Other studies have found leaf thickness and toughness to be highest when nutrients are low and leaves are costly to replace (Choong et al. 1992, Cunningham et al. 1999). However, the effects of herbivory are moderate at our site, and the herbivore-excluding fences do not have any influence on ANPP (Wang et al., in press). Leaf toughness has also been found to be higher in shade tolerant species, again due to the costs of replacing leaves in these vulnerable habitats (Westbrook et al. 2011). Cedar Point, with its relatively low ANPP, is unlikely to have large aboveground competition for light and due to low risk of leaf loss to herbivory and low shade, leaves may not benefit from high thickness and toughness at our study site. However, the
strength of light competition and herbivory vary across grasslands and Borer et al. (2014) reported strong impacts of herbivory and light levels on ANPP in most Nutrient Network sites. Therefore, trait change in response to nutrient addition may vary depending on the degree to which herbivory, light competition, and/or water availability influence
vegetation. Finally, Cedar Point is a dry grassland and may have naturally high leaf thickness and toughness relative to other sites, although there are few studies with which to compare. Overall, these results suggest a shift in plant strategy with increasing nutrient availability toward higher resource acquisition and use, and lower resource storage (Lavorel and Garnier 2002, Collins et al. 2016) which could have implications for
biogeochemical cycling and precipitation regimes (Lavorel and Garnier 2002, Reichstein et al. 2014).
Many studies have documented that nutrient addition may cause change in plant community composition (Borer et al. 2014b, Craven et al. 2016). However, response of community weighted traits can be due to two factors: species abundance changes and intraspecific trait changes. We demonstrate that intraspecific trait changes also contribute substantially to the community functional response, even after eight years of nutrient addition. In fact, several previous studies have shown that intraspecific trait changes were more important than abundance changes under fertilization (Lepš et al. 2011, La Pierre and Smith 2014, Siefert and Ritchie 2016). However, this relationship may vary over time. La Pierre and Smith (2014) observed stronger changes in community composition in a 14-year fertilization experiment than in a nine-year experiment. Wang et al. (in press) also found abundance changes to be increasingly important over time at Cedar Point, partially due to an increase in annual species abundance over time. Further, these results are not limited to nutrient manipulation experiments. Jung et al. (2014) simulated an extreme drought event and found intraspecific variation drove the community functional trait response. However, Lepš et al. (2011) found species abundance changes were more important in some community traits in response to disturbances such a mowing.
Therefore, the type of environmental change a community is exposed to will likely influence the mechanisms of community response. Together these findings demonstrate that both species composition and intraspecific trait changes can influence community weighted traits and the relative importance of each can vary over time.
At the species level, functional trait responses varied, but most species shifted in trait values toward trait values associated with higher resource use and acquisition. These trait changes were consistent with the community trend and were not seen in a few dominant species only. Abundance of the two most dominant species declined as the subdominant species increased in abundance. The dominant plasticity hypothesis states that species gain a competitive advantage when they can exhibit plasticity in their resource use (Ashton et al. 2010). This was observed in Bromus tectorum and Cirsium undulatum, which had the largest increases in abundance. Bromus tectorum also had the largest increase in SLA under N addition and accompanied by slight increases in chlorophyll and height. Of the species studied, Cirsium undulatum had the largest increase in chlorophyll, a moderate increase in height, and a slight decline in SLA. Combined, this plasticity in resource use suggests that these species gained a competitive edge with N addition as seen by their increase in abundance. However, there was no correlation between trait plasticity and abundance changes of all species overall (analysis not shown). Thus, it may be that only a few annual species are more plastic than the majority of species.
We sampled 12 species in both 2015 and 2016 and combined these species showed that SLA, chlorophyll, and plant height were significantly lower in 2016 than in the study year of 2015. However, LDMC was significantly higher in 2016 than in 2015. Of these traits, SLA showed a significant year by N addition interaction, whereas the other traits did not. The summer of 2016 was much drier than 2015, only receiving 116 mm of precipitation in June and July while 2015 received 236 mm. Water availability has been shown to affect these traits in other studies and to limit plant growth in general
(Fonseca et al. 2000, Chaves et al. 2002, Chapin et al. 2011). Thus, annual fluctuations in climate can be just as important as nutrient availability in influencing species functional traits. This clearly highlights that the importance of nutrient induced trait changes varies among years, likely influenced by precipitation differences.
Scaling ANPP and community weighted traits to LAI and canopy chlorophyll density
Studies seeking to quantify the effect of changing biotic and abiotic factors on ecosystem function often measure shifts in ANPP (Tilman et al. 1997, Fay et al. 2015). However, LAI and canopy chlorophyll density are more directly related to photosynthesis and carbon gain (McWilliam et al. 1993, Chaves et al. 2002, Fitzgerald et al. 2010). In 2015, ANPP did not increase significantly and species richness was not significantly different with N addition, however LAI and canopy chlorophyll density increased by 34% and 67% respectively. In addition, even with no ANPP changes, N addition increases light interception in the canopy by 19% (N- 62 % +/- 2% SE, N+ 74% +/- SE 3%, n=48, Knops, unpublished data). Given this, ANPP can underestimate N induced changes in aboveground competition for light and ecosystem carbon gain as we saw an increase in light interception and chlorophyll content which are directly related to photosynthetic rates.
Nutrient addition can cause a shift in allocation from root to shoot biomass as competition aboveground for light increases and belowground competition for nutrients decreases (Nadelhoffer et al. 1985). However, a shift in root shoot ratio is not likely at our site for several reasons. First, we did not find a significant increase in aboveground
biomass, and Wang et al. (in press) only showed increased aboveground biomass in wet years. ANPP at our site is primarily precipitation limited (Wang et al., in press), and therefore a shift in root to shoot ratio as seen in sites that are primarily nutrient limited may not occur. Second, the increased aboveground biomass is largely driven by increased annual species abundances at our site (Wang et al., in press), and annual species typically have lower root to shoot ratio. However, we did not find differences an increase in annual species abundances in 2015. Finally, the observed shift in functional traits with N
addition are associated with faster growth rates and higher maintenance costs which require increased cellular respiration (Penning De Vries 1975). Therefore, carbon may have been lost to respiration rather than assimilated into ANPP. We have no direct estimate of belowground root biomass however, which is difficult to measure at our site due to the shallow and rocky soil.
Precipitation in June and July of 2015 was 236 mm which was the highest of the last 10 years. However, ANPP did not increase significantly with N addition in 2015. Wang et al. (in press) found that ANPP at Cedar Point was primarily limited by
precipitation, but in years when precipitation was not limiting, N was limiting. Therefore, with the high precipitation in 2015 a larger increase in ANPP with N addition was
expected. Wang et al. (in press) also found that annual species productivity drove the responses to N fertilizer in wet years. However, here we found that annual species did not differ significantly from the perennial species in their abundance change, or trait change, with N addition. Although total precipitation is an important factor determining ANPP variation, the timing of precipitation events is also important as it may serve as a crucial germination cue for annual plant species (Philippi 1993). Therefore, because community
weighted functional traits are calculated using species abundances and species traits, and because annual species exhibit large annual variability in abundance, the community weighted traits will also vary strongly over time.
We found that both N addition and annual precipitation to be important in
determining relative species abundance and species functional traits. Canopy parameters such as LAI and canopy chlorophyll content are the product of ANPP, relative species abundances, and species functional traits. Therefore, ecosystem level changes in canopy structure can be strongly influenced by species abundance changes and species functional trait changes, even when ANPP does not change. We also found large annual variation in species functional traits, likely induced by precipitation differences. Further, this annual variation can be just as important as nutrient addition in determining functional traits. Therefore, annual trait variability combined with annual variability in ANPP and species composition can lead to even larger variation in LAI and canopy chlorophyll content. To understand the ecosystem consequences of N addition, we need to examine not only ANPP, but also annual differences in species composition and functional traits, as they are crucial in determining canopy structure
REFERENCES
Albert, C. H., F. Grassein, F. M. Schurr, G. Vieilledent, and C. Violle. 2011. When and how should intraspecific variability be considered in trait-based plant ecology? Perspectives in Plant Ecology, Evolution and Systematics 13:217–225.
Ashton, I. W., A. E. Miller, W. D. Bowman, and K. N. Suding. 2010. Niche
complementarity due to plasticity in resource use: Plant partitioning of chemical N forms. Ecology 91:3252–3260.
Baer, S. G., J. M. Blair, S. L. Collins, and A. K. Knapp. 2004. Plant community
responses to resource availability and heterogeneity during restoration. Oecologia 139:617–629.
Barnard, I. 2014. Field guide to the common grasses of Oklahoma, Kansas, and Nebraska. University of Kansas Press, Lawrence, Kansas.
Bates, D., M. Mächler, B. Bolker, and S. Walker. 2014. Fitting linear mixed-effects models using lme4. Journal of Statistical Software 67:1–48.
Bolnick, D. I., P. Amarasekare, M. S. Araújo, R. Bürger, J. M. Levine, M. Novak, V. H. W. Rudolf, S. J. Schreiber, M. C. Urban, and D. A. Vasseur. 2011. Why
intraspecific trait variation matters in community ecology. Trends in Ecology and Evolution 26:183–192.
Borer, E. T., W. S. Harpole, P. B. Adler, E. M. Lind, J. L. Orrock, E. W. Seabloom, and M. D. Smith. 2014a. Finding generality in ecology: A model for globally distributed experiments. Methods in Ecology and Evolution 5:65–73.
Borer, E. T., E. W. Seabloom, D. S. Gruner, W. S. Harpole, H. Hillebrand, E. M. Lind, P. B. Adler, J. Alberti, T. M. Anderson, J. D. Bakker, L. Biederman, D. Blumenthal, C. S. Brown, L. A. Brudvig, Y. M. Buckley, M. Cadotte, C. Chu, E. E. Cleland, M. J. Crawley, P. Daleo, E. I. Damschen, K. F. Davies, N. M. DeCrappeo, G. Du, J. Firn, Y. Hautier, R. W. Heckman, A. Hector, J. HilleRisLambers, O. Iribarne, J. A. Klein, J. M. H. Knops, K. J. La Pierre, A. D. B. Leakey, W. Li, A. S. MacDougall, R. L. McCulley, B. A. Melbourne, C. E. Mitchell, J. L. Moore, B. Mortensen, L. R. O’Halloran, J. L. Orrock, J. Pascual, S. M. Prober, D. A. Pyke, A. C. Risch, M. Schuetz, M. D. Smith, C. J. Stevens, L. L. Sullivan, R. J. Williams, P. D. Wragg, J. P. Wright, and L. H. Yang. 2014b. Herbivores and nutrients control grassland plant diversity via light limitation. Nature 508:517–520.
Chapin, F. S. I., P. A. Matson, and P. Vitousek. 2011. Principles of terrestrial ecosystem ecology. Springer Science & Business Media.
Chapman, S. C., and H. J. Barreto. 1993. Using a Chlorophyll Meter to Estimate Specific Leaf Nitrogen of Tropical Maize during Vegetative Growth:557–562.
Chapman, S. S., J. M. Omernik, J. A. Freeouf, D. G. Huggins, C. C. McCauley, J. R. Freeman, G. Steinauer, R. T. Angelo, and R. L. Schlepp. 2001. Ecoregions of Nebraska and Kansas.
Chaves, M. M., J. S. Pereira, J. Maroco, M. L. Rodrigues, C. P. P. Ricardo, M. L. Osorio, I. Carvalho, T. Faria, and C. Pinheiro. 2002. How plants cope with water stress in the field. Photosynthesis and growth. Annals of Botany 89:907–916.
Choong, M. F., P. W. Lucas, J. S. Y. Ong, B. Pereira, H. T. W. Tan, and I. M. Turner. 1992. Leaf fracture toughness and scierophylly : their correlations and ecological implications. New Phytologist 121:597–610.
Collins, C. G., S. J. Wright, and N. Wurzburger. 2016. Root and leaf traits reflect distinct resource acquisition strategies in tropical lianas and trees. Oecologia 180:1037– 1047.
Cornwell, W. K., and D. D. Ackerly. 2009. Community Assembly and Shifts in Plant Trait Distributions across an Environmental Gradient in Coastal California 79:109–
126.
Craven, D., F. Isbell, P. Manning, J. Connolly, H. Bruelheide, A. Ebeling, C. Roscher, J. van Ruijven, A. Weigelt, B. Wilsey, C. Beierkuhnlein, E. de Luca, J. N. Griffin, Y. Hautier, A. Hector, A. Jentsch, J. Kreyling, V. Lanta, M. Loreau, S. T. Meyer, A. S. Mori, S. Naeem, C. Palmborg, H. W. Polley, P. B. Reich, B. Schmid, A. Siebenkäs, E. Seabloom, M. P. Thakur, D. Tilman, A. Vogel, and N. Eisenhauer. 2016. Plant diversity effects on grassland productivity are robust to both nutrient enrichment and drought. Philosophical transactions of the Royal Society of London. Series B,
Biological sciences 371.
Cunningham, S. A., B. Summerhayes, and M. Westoby. 1999. Evolutionary divergences in leaf structure and chemistry, comparing rainfall and soil nutrient gradients 69:569–588.
Daubenmire, R. F. 1959. A canopy-coverage method of vegetation analysis. Northwest Science 33:43–64.
Development Core Team, R. 2014. R: A language and environment for statistical computing. R foundation for Statistical Computing, Vienna, Austria.
Dı́az, S., and M. Cabido. 2001. Vive la difference: plant functional diversity matters to ecosystem processes. Trends in Ecology and Evolution 16:646–655.
Farrar, J. 2011. Field guide to wildflowers of Nebraska and the Great Plains. Second. University of Iowa Press, Iowa City, Iowa.
Fay, P. A., S. M. Prober, W. S. Harpole, J. M. H. Knops, J. D. Bakker, E. T. Borer, E. M. Lind, A. S. Macdougall, E. W. Seabloom, P. D. Wragg, P. B. Adler, D. M.
Blumenthal, Y. M. Buckley, C. Chu, E. E. Cleland, S. L. Collins, K. F. Davies, G. Du, X. Feng, J. Firn, D. S. Gruner, N. Hagenah, Y. Hautier, R. W. Heckman, V. L. Jin, K. P. Kirkman, J. A. Klein, L. Ladwig, Q. Li, R. L. McCulley, B. A. Melbourne, C. E. Mitchell, J. L. Moore, J. W. Morgan, A. C. Risch, M. Schuetz, C. J. Stevens, D. A. Wedin, and L. H. Yang. 2015. Grassland productivity is limited by multiple nutrients. Nature Plants 1:15080.
Fitzgerald, G., D. Rodriguez, and G. O’Leary. 2010. Measuring and predicting canopy nitrogen nutrition in wheat using a spectral index-The canopy chlorophyll content index (CCCI). Field Crops Research 116:318–324.
Fonseca, C. R., J. M. Overton, B. Collins, and M. Westoby. 2000. Shifts in
trait-combinations along rainfall and phosphorus gradients. Journal of Ecology 88:964– 977.
Fox, J., and S. Weisberg. 2011. An {R} Companion to Applied Regression. Page Sage. Second. Thousand Oaks CA.
Funk, J. L. 2008. Differences in plasticity between invasive and native plants from a low resource environment. Journal of Ecology 96:1162–1173.
Garnier, E., J. Cortez, G. Billès, M. L. Navas, C. Roumet, M. Debussche, G. Laurent, A. Blanchard, D. Aubry, A. Bellmann, C. Neill, and J. P. Toussaint. 2004. Plant
functional markers capture ecosystem properties during secondary succession. Ecology 85:2630–2637.
Grime, J. P. 1998. Benefits of Plant Diversity to Ecosystems: Immediate, Filter and Founder Effects. Journal of Ecology 86:902–910.
Al Haj Khaled, R., M. Duru, J. P. Theau, S. Plantureux, and P. Cruz. 2005. Variation in leaf traits through seasons and N-availability levels and its consequences for ranking grassland species. Journal of Vegetation Science 16:391–398.
Harpole, W. S., L. L. Sullivan, E. M. Lind, J. Firn, P. B. Adler, E. T. Borer, J. Chase, P. A. Fay, Y. Hautier, H. Hillebrand, A. S. MacDougall, E. W. Seabloom, R. Williams, J. D. Bakker, M. W. Cadotte, E. J. Chaneton, C. Chu, E. E. Cleland, C. D’Antonio, K. F. Davies, D. S. Gruner, N. Hagenah, K. P. Kirkman, J. M. H. Knops, K. J. La Pierre, R. L. McCulley, J. L. Moore, J. W. Morgan, S. M. Prober, A. C. Risch, M. Schuetz, C. J. Stevens, and P. D. Wragg. 2016. Addition of multiple limiting resources reduces grassland diversity. Nature 537:93–96.
Heisler-White, J. L., A. K. Knapp, and E. F. Kelly. 2008. Increasing precipitation event size increases aboveground net primary productivity in a semi-arid grassland. Oecologia 158:129–140.
High Plains Regional Climate Center. 2017. Automated Weather Data Network. http://www.hprcc.unl.edu/.
Hothorn, T., B. Bretz, and P. Westfall. 2008. Simultaneous Inference in General Parametric Models. Biometrical 50:346–363.
Jain, M., D. F. B. Flynn, C. M. Prager, G. M. Hart, C. M. Devan, F. S. Ahrestani, M. I. Palmer, D. E. Bunker, J. M. H. Knops, C. F. Jouseau, and S. Naeem. 2014. The importance of rare species: A trait-based assessment of rare species contributions to functional diversity and possible ecosystem function in tall-grass prairies. Ecology and Evolution 4:104–112.
Jung, V., C. H. Albert, C. Violle, G. Kunstler, G. Loucougaray, and T. Spiegelberger. 2014. Intraspecific trait variability mediates the response of subalpine grassland communities to extreme drought events. Journal of Ecology 102:45–53.
Knops, J. M. H., and K. Reinhart. 2000. Specific leaf area along a nitrogen fertilization gradient. The American Midland Naturalist 144:265–272.
Lavorel, S., and E. Garnier. 2002. Predicting changes in community composition and ecosystem functioning from plant traits: revisiting the Holy Grail. Functional Ecology 16:545–556.
Lebauer, D. S., and K. K. Treseder. 2008. Nitrogen limitation of net primary productivity in terrestrial ecosystems is globally distributed. Ecology 89:371–379.
Lepš, J., F. de Bello, P. Šmilauer, J. Doležal, J. Leps, F. De Bello, and S. Petr. 2011. Community trait response to environment: Disentangling species turnover vs intraspecific trait variability effects. Ecography 34:856–863.
McGill, B. J., B. J. Enquist, E. Weiher, and M. Westoby. 2006. Rebuilding community ecology from functional traits. Trends in Ecology and Evolution 21:178–185. McWilliam, A.-L. C., J. M. Roberts, O. M. R. Cabral, M. V. B. R. Leitao, A. C. L. De
Costa, G. T. Maitelli, and C. A. G. P. Zamparoni. 1993. Leaf area index and above-ground biomass of terra firme rain forest and adjacent clearings in amazonia. Functional Ecology 7:310–317.
Nadelhoffer, K. J., J. D. Aber, and J. M. Melillo. 1985. Fine roots , net primary production, and soil nitrogen availability: A new hypothesis. Ecology 66:1377– 1390.
Penning De Vries, F. W. T. 1975. The Cost of Maintenance Processes in Plant Cells. Annals of Botany 39:77–92.
Pérez-Harguindeguy, N., S. Diaz, E. Garnier, S. Lavorel, H. Poorter, P. Jaureguiberry, M. S. S. Bret-Harte, W. K. K. Cornwell, J. M. M. Craine, D. E. E. Gurvich, C. Urcelay, E. J. J. Veneklaas, P. B. B. Reich, L. Poorter, I. J. Wright, P. Ray, L. Enrico, J. G. Pausas, A. C. de Vos, N. Buchmann, G. Funes, F. Quétier, J. G. Hodgson, K. Thompson, H. D. Morgan, H. ter Steege, M. G. A. van der Heijden, L. Sack, B. Blonder, P. Poschlod, M. V. Vaieretti, G. Conti, A. C. Staver, S. Aquino, and J. H. C. Cornelissen. 2013. New Handbook for standardized measurment of plant functional traits worldwide. Australian Journal of Botany 61:167–234.
Peters, N. E., and M. Meybeck. 2000. Water Quality Degradation Effects on Freshwater Availability: Impacts of Human Activities. Water International 25:185–193.
Philippi, T. 1993. Bet-Hedging Germination of Desert Annuals: Variation Among Populations and Maternal Effects in Lepidium lasiocarpum. The American Naturalist 142:488–507.
La Pierre, K. J., and M. D. Smith. 2014. Functional trait expression of grassland species shift with short- and long-term nutrient additions. Plant Ecology 216:307–318. Reich, P. B., M. B. Walters, and D. S. Ellsworth. 1997. From tropics to tundra: Global
convergence in plant functioning. Proceedings of the National Academy of Sciences of the United States of America 94:13730–13734.
Reichstein, M., M. Bahn, M. D. Mahecha, J. Kattge, and D. D. Baldocchi. 2014. Linking plant and ecosystem functional biogeography. Proceedings of the National Academy of Sciences 111:13697–13702.
Scheinost, S. A., N. P. Helzer, and M. S. Kuzila. 1995. Soil Survey of Keith County Nebraska. Natural Resource Conservation Service, United States Department of Agriculture.
Siefert, A., and M. E. Ritchie. 2016. Intraspecific trait variation drives functional responses of old-field plant communities to nutrient enrichment. Oecologia 181:245–255.
Stevens, C. J., N. B. Dise, O. J. Mountford, and D. J. Gowing. 2004. Impact of nitrogen deposition on the species richness of grasslands. Science 303:1876–1879.
Stevens, C. J., E. M. Lind, Y. Hautier, W. S. Harpole, E. T. Borer, S. Hobbie, E. W. Seabloom, L. Ladwig, J. D. Bakker, C. Chu, S. Collins, K. F. Davies, J. Firn, H. Hillebrand, K. J. La Pierre, A. MacDougall, B. Melbourne, R. L. McCulley, J. Morgan, J. L. Orrock, S. M. Prober, A. C. Risch, M. Schuetz, and P. D. Wragg. 2015. Anthropogenic nitrogen deposition predicts local grassland primary production worldwide. Ecology 96:1459–1465.
Suding, K. N., S. Lavorel, F. S. Chapin, J. H. C. Cornelissen, S. Díaz, E. Garnier, D. Goldberg, D. U. Hooper, S. T. Jackson, and M. L. Navas. 2008. Scaling
environmental change through the community-level: A trait-based response-and-effect framework for plants. Global Change Biology 14:1125–1140.
Tilman, D. 1987. Secondary succession and the pattern of plant dominance along experimental nitrogen gradients. Ecological Monographs 57:189–214.
Tilman, D., J. M. H. Knops, D. Wedin, P. Reich, M. Ritchie, and E. Siemann. 1997. The influence of functional diversity and composition on ecosystem processes. Science 277:1300–1302.
USDA, and NRCS. 1995. The PLANTS Database.
Violle, C., M. Navas, D. Vile, E. Kazakou, C. Fortunel, I. Hummel, and E. Garnier. 2007. Let the concept of trait be functional! Oikos 116:882–892.
Vitousek, P. M., J. D. Aber, R. W. Howarth, G. E. Likens, P. A. Matson, D. W.
Schindler, W. H. Schlesinger, and D. Tilman. 1997. Human Alteration of the Global Nitrogen Cycle: Sources and Consequences. Ecological Applications 7:737–750. Vitousek, P. M., and R. W. Howarth. 1991. Nitrogen limitation on land and in the sea:
How can it occur? Biogeochemistry 13:87–115.
Vitousek, P. M., S. Porder, B. Z. Houlton, and O. A. Chadwick. 2010. Terrestrial phosphorus limitation: Mechanisms, implications, and nitrogen-phosphorus interactions. Ecological Applications 20:5–15.
Wang, J., J. M. H. Knops, C. Brassil, and C. Mu. (n.d.). Increased productivity in wet years drives a decline in ecosystem stability with nitrogen additions in arid grasslands. Ecology.
Westbrook, J. W., K. Kitajima, J. G. Burleigh, W. J. Kress, D. L. Erickson, and S. J. Wright. 2011. What makes a leaf tough? Patterns of correlated evolution between leaf toughness traits and demographic rates among 197 shade-tolerant woody species in a Neotropical forest. The American Naturalist 177:800–811. Wright, I. J., P. B. Reich, M. Westoby, D. D. Ackerly, Z. Baruch, F. Bongers, J.
Cavender-Bares, T. Chapin, J. H. C. Cornellissen, M. Diemer, J. Flexas, J. Gulias, E. Garnier, P. K. Groom, J. Guilas, K. Hikosaka, B. B. Lamont, T. Lee, W. Lee, C. Lusk, J. J. Midglet, M. L. Navas, Ü. Niinemets, J. Oleksyn, N. Osada, H. Poorter, P. Pool, L. Prior, V. I. Pyankov, C. Roumet, S. C. Thomas, M. G. Tjoelker, E. J. Veneklaas, and R. Villar. 2004. The worldwide leaf economics spectrum. Nature 428:821–827.
Yang, Y., J. Fang, W. Ma, and W. Wang. 2008. Relationship between variability in aboveground net primary production and precipitation in global grasslands. Geophysical Research Letters 35:2–5.
Yavitt, J. B., K. E. Harms, M. N. Garcia, M. J. Mirabello, and S. J. Wright. 2011. Soil fertility and fine root dynamics in response to 4 years of nutrient (N, P, K) fertilization in a lowland tropical moist forest, Panama. Austral Ecology 36:433– 445.
Table 1. Results of a MANOVA with community weighted traits (SLA, chlorophyll, thickness, toughness, height, LDMC) as the response variable and the fertilizer treatments N, P, K, their interactions, and block as predictor variables. Community weighted traits were calculated summing the product of individual species trait values and species abundance in a plot and dividing by the total abundanceof a plot. Here we use the Pillai test statistic to determine goodness of fit of each model. Significant p-values are denoted with asterisks (*** = P < 0.001). df Pillai F Numerator df Denominator df P N 1 0.713 14.069 6 34 <0.001 *** P 1 0.167 1.134 6 34 0.364 K 1 0.115 0.733 6 34 0.627 Block 1 0.161 1.087 6 34 0.390 N:P 1 0.121 0.777 6 34 0.594 N:K 1 0.123 0.793 6 34 0.582 P:K 1 0.186 1.293 6 34 0.287 NPK 1 0.216 1.564 6 34 0.188
Figure 1. Conceptual diagram describing how environmental change scales up to effect ecosystem function. Environmental change simultaneously effects species functional trait values as well as species abundances. Certain functional trait values can give species competitive advantages and cause shifts in species abundances, or species abundance changes can cause increased competition and therefore effect functional traits. Which species are most abundant and which functional trait values they possess both influence community structure and function. Community structure and function then impacts ecosystem functions like productivity, water, nutrient, and energy cycling.
Figure 2. Mean community weighted SLA, chlorophyll, plant height, and LDMC in the plots with no nitrogen added (N-) and the nitrogen added (N+) plots. Community weighted traits were calculated summing the product of individual species traits and species abundance in a plot and dividing by the total abundance of a plot. Significant p-values are denoted with asterisks (*** = P < 0.001, * = P < 0.05), and the error bars represent the standard error of the mean of each treatment.
Figure 3. Change in species average a) abundance, b) SLA, c) chlorophyll, d) plant height, and e) LDMC in the plots without nitrogen added and plots with nitrogen fertilization. Species are arranged by site level dominance with dominant on the left to rare on the right. The error bars represent the standard error of the difference between the nitrogen plots and the mean of the non-nitrogen plots.
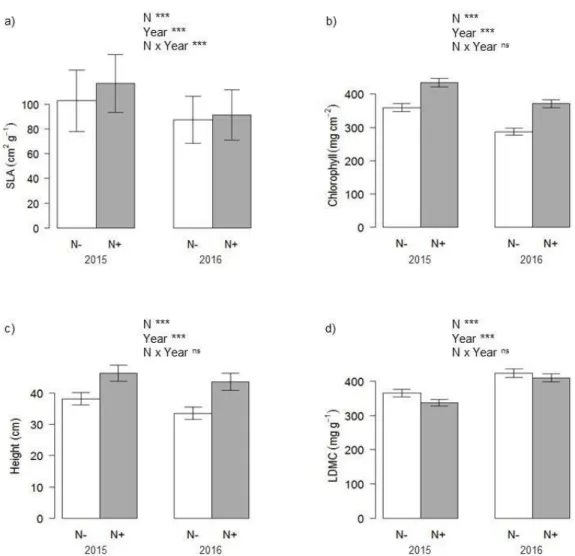
Figure 4. Change in mean a) SLA, b) Chlorophyll, c) Height, d) LDMC between the plots with no nitrogen added (N-) and the nitrogen fertilized (N+) plots in 2015 and 2016. The two study years had markedly different precipitation (236 mm in 2015 and 116mm in 2016). We used linear mixed effects models with functional traits (SLA, chlorophyll, height, and LDMC) as the response variable and the fertilizer treatments N, Year, and their interaction as predictor variables. We use type II ANOVA to determine goodness of fit of each model. Significant p-values are denoted with asterisks (*** = P < 0.001, ** = P < 0.01, * = P < 0.05).The error bars represent the standard error of the mean of each treatment.
Figure 5. Mean ANPP, leaf area index, and canopy chlorophyll density in the plots with no nitrogen added (N-) and the nitrogen added (N+) plots. LAI, or the total leaf surface area per square meter, is the product of community weighted SLA and ANPP. Canopy chlorophyll density, or total number of chlorophyll molecules per square meter, is the product of community weighted chlorophyll and LAI. Significant p-values are denoted with asterisks (*** = P < 0.001, * = P < 0.05) and the error bars represent the standard error of the mean of each treatment.
APPENDIX
Table S1.Number of observations missing functional trait data at each point in the data averaging process. The change from previous dataset is change in community weighted Specific Leaf Area. Differences between the raw data and the averaged dataset were assessed with a generalized linear model and were found to be insignificant (p =0.443). Other traits were also tested and did not differ significantly between the initial and final dataset (p > 0.1). Dataset Abundance Records with Traits Abundance Records Missing Traits Average Percent Cover Missing Treatment SLA Estimate
Raw data 256 207 17.5 Absent Present
N 72.48 90.66 P 82.77 80.37 K 72.92 90.22 Averaged Within Treatment Combination 379 84 3.4 N 78.78 94.20 P 87.17 85.81 K 80.89 92.09 Averaged Across Plots 433 30 1.9 N 78.96 93.40 P 86.56 85.80 K 80.26 92.10 Filled with 2016 Data 457 6 0.1 N 79.12 93.66 P 86.64 86.14 K 80.32 92.46
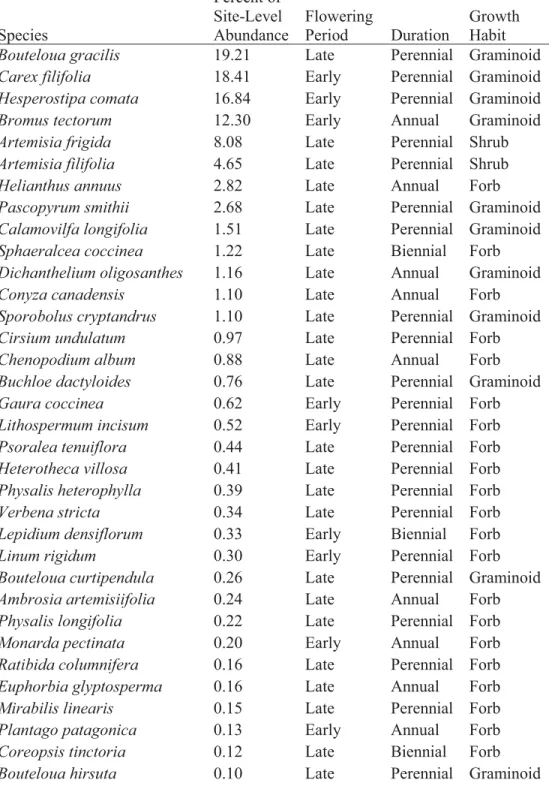
Table S2.Species list and corresponding functional groups. Percent of site-level
abundance is the total abundance across all plots. Flowering period, duration, and growth habit information come from the USDA PLANTS database, Barnard 2014, and Farrar 2011. Species Percent of Site-Level Abundance Flowering Period Duration Growth Habit
Bouteloua gracilis 19.21 Late Perennial Graminoid
Carex filifolia 18.41 Early Perennial Graminoid
Hesperostipa comata 16.84 Early Perennial Graminoid
Bromus tectorum 12.30 Early Annual Graminoid
Artemisia frigida 8.08 Late Perennial Shrub
Artemisia filifolia 4.65 Late Perennial Shrub
Helianthus annuus 2.82 Late Annual Forb
Pascopyrum smithii 2.68 Late Perennial Graminoid
Calamovilfa longifolia 1.51 Late Perennial Graminoid
Sphaeralcea coccinea 1.22 Late Biennial Forb
Dichanthelium oligosanthes 1.16 Late Annual Graminoid
Conyza canadensis 1.10 Late Annual Forb
Sporobolus cryptandrus 1.10 Late Perennial Graminoid
Cirsium undulatum 0.97 Late Perennial Forb
Chenopodium album 0.88 Late Annual Forb
Buchloe dactyloides 0.76 Late Perennial Graminoid
Gaura coccinea 0.62 Early Perennial Forb
Lithospermum incisum 0.52 Early Perennial Forb
Psoralea tenuiflora 0.44 Late Perennial Forb
Heterotheca villosa 0.41 Late Perennial Forb
Physalis heterophylla 0.39 Late Perennial Forb
Verbena stricta 0.34 Late Perennial Forb
Lepidium densiflorum 0.33 Early Biennial Forb
Linum rigidum 0.30 Early Perennial Forb
Bouteloua curtipendula 0.26 Late Perennial Graminoid
Ambrosia artemisiifolia 0.24 Late Annual Forb
Physalis longifolia 0.22 Late Perennial Forb
Monarda pectinata 0.20 Early Annual Forb
Ratibida columnifera 0.16 Late Perennial Forb
Euphorbia glyptosperma 0.16 Late Annual Forb
Mirabilis linearis 0.15 Late Perennial Forb
Plantago patagonica 0.13 Early Annual Forb
Coreopsis tinctoria 0.12 Late Biennial Forb
Hordeum jubatum 0.10 Early Perennial Graminoid
Polygala alba 0.10 Early Perennial Forb
Asclepias pumila 0.06 Late Perennial Forb
Tradescantia occidentalis 0.06 Early Perennial Forb
Lygodesmia juncea 0.04 Late Perennial Forb
Liatris punctata 0.03 Late Perennial Forb
Vulpia octoflora 0.03 Early Annual Graminoid
Chenopodium leptophyllum 0.02 Late Annual Forb
Oenothera albicaulis 0.02 Early Annual Forb
Physalis pumila 0.02 Late Perennial Forb
Tragopogon dubius 0.01 Late Biennial Forb