DOI: 10.12928/TELKOMNIKA.v16i4.7715 1396
Comparative Study Improving Residential Load Factor
Using Power Shifting and Load Shifting
Hartono BS1, Sri Paryanto Mursid2, Sapto Prajogo3Department of Energy Conversion Engineering Politeknik Negeri Bandung , Indonesia
e-mail: [email protected], [email protected], [email protected]
Abstract
One the prob lem of electric power stab ility is due to load fluctuations in distrib ution system especialy during peak load conditions. One solution which is applied in Smart Grid scheme is through load shifting or power shifting. In load shifting the load with high power consumption which operates at peak load shifted its operations outside of the peak load o r s some loads with high power consumption do not operate at the same time, there is a load whose operating time is shifted to reduce peak power. Power shifting is used when energy from renewab le source not directly suplied to load b ut storage first and supplied to reduce high power consumption to reduce peak power. Low load factor, ratio b etween average power to peak power, may affect to power system operation. If load factor of residential load can keep in low, it will b e certainly help improve the stab i lity of the power system. In this study we will examine the comparison of load shifting method with power shifting in improving load factor. Load shifting is done to water pumps and washing machines, b ecause washing machine is shiftab le load. Power shiftin g is made to the output power of the solar power plant, which is used to reduce peak power from the water pump. Test results show that power shifting can increase load factor value up to 54,9% while load shifting give load factor value equal to 43,9%.
Keywords: power shifting, load shifting, load factor, smart grid, peak load
Copyright © 2018 Universitas Ahmad Dahlan. All rights reserved.
1. Introduction
Along with the development and rapid technological advances, the need for electricity is increasing. Almost every equipment used uses electrical energy as its energy source. The use of electrical energy is used in almost every aspect of life including in t he industrial sector, education, household, etc. Statistics show that the Indonesia electricity consumption in 2014 amounted to 198,6 thousand gigawatts Hours (GWh). The figure was up 5.9% from the previous year. The highest national electricity consumption is from domestic consumers amounted to 84.086 thousand GWh (42.34%), followed by industrial customers 65.9 thousand GWh (33.19%), business 36.28 thousand GWh (18.27%), and others 12.32 thousand GWh (6.21%) [1].
The problem with the power system is how to balance the generate power to power demand of load. Obstacles encountered in solving the problem is the amount of power in the load that changes according to customer activity. Extreme load fluctuation can impact t o power system performance. This not only impacting to power generation system but can lead to degradation in power transmission system [2]. In line with the increasing need for electrical energy sources and the emergence of regulation on environmental regarding to pollution issues from generating system, this led to alternative power generation being used using renewable energy sources. This raises another problem where the generation parameters not only pay attention to met the load power demand but amount of power generated from renewable energy sources, which are also fluctuating, thus requiring special handling. The intermittent and fluctuating features of renewable energy sources, increase the uncertainties and challenges for power system [3].
Residential electricity currently contributes the most to power systems stablility. The inclusion of residential electricity in the framework of power systems through a smart grid scheme, in which it's not only role as a electrical load but also can generate ele ctricity. The demand side management (DSM) program provides an opportunity to residential electricity to play a role in improving quality of the power system [4]. When the peak power and average
power of a household can be made not too high, improvements in the quality of the power system can be achieved. This can be done with the load shifting mechanism of the DSM program, where large power consuming equipment is not operated at the same time. So that the daily load factor of the residential load can be made close to 1. By identifying residential loads that have a large power consumption it can be identified the probability of improvement in the daily load factor of household load. Power shifting is used when power generated from renewable energy source not directly supplied to load, but stored first and supplied to reduce high power consumption to reduce peak power. Low load factor, ratio between average power to peak power, may affect to power system operation. If load factor of residential load can keep in low and flat, it will be certainly help improve the stability of the power system.
Some of the research that has been done related to load shifting and load factor improvement, among others, scheduling the operation of home appliance using particle swarm optimization (PSO) to minimizing cost of electricity bill. By Controlling and influencing energy demand can reduce the overall peak load demand, reshape the demand profile and i ncrease the grid sustainability [5]. Study on the use of wind energy sources and regulation of water heater operation, setting point and shifting operation time, to adjust to the availability of energy sources and cheaper operating costs [6]. The role of DSM programs in grid operations continues to grow, one of them through demand response program. In this program consumers can contribute to generating operations, with as little as possible disrupting customer activity. To support the success of the DSM program then modeled the consumer behavior into the operator dispatch system algorithm [7].
Modeling load shifting problem is done to get cheap energy cost by using linear programming. The savings analysis was performed on several household appliances such as washing machine, dryer, dishwasher, electric car and air conditioner. Energy saver costs can be achieved from 38% -67.47% depending on the type of load [8]. The intelligent control with multi-information fusion concept on Wind/Photovoltaic Micro-grid storage systems. By predicting SUG (State Utility Grid) load forecasting and Mic ro-grid power generation and load demand considered at the same in intelligent control can planning for battery charge and discharge within the next 24 hours. It's can solving the shortage problem of power generation of Micro-grid that may be happened during the future peak time of SUG load [9].
In Indonesia there is not much variation in household burden, most households do not use dishwashers, dryers and electric cars, so that the load variation, which can be shifted in operation time, is not much. Equipment that is widely used, among others, washing machines, water pumps, refrigerators, water heaters and air conditioners. In Indonesia many used water storage to hold water before use. This is done to reduce the power surge when the first pump is turned on, so the pump will only turn on when the contents of the water container have started empty until the water container is full. When pump is on with other loads such as iron, water heater and washing mechine, it will result in an increase in electrical power which will result in increased load factor value. What is the opportunity of smart grid implementation with the load type that is not too varied. What kind of load arrangement is appropriate to apply to smart grid applications in Indonesia that can improve load factor of household. In this study we will examine the comparison of load shifting method with power shifting in improving load factor. load shifting is done to water pumps and washing machines, because washing machine is shiftable load. Power shifting is made to the output power of the solar power plant, which is used to reduce peak power from the water pump.
2. Demand Side Management (DSM)
Smart grid technology with the support of information technology, communication and energy system, has the ability to improve the quality of the power system. The generation system operator can perform operation planning more accurate in estimating the amount of power to be generated. Operator able to monitor and control the flow of power on the network [10]. Through the support of technology infrastructure, smart grid in addition to improving the quality of power, is also able to improve reliability, cost generation is cheaper and customer side obtained cheaper energy costs [11]. Demand Side Management (DSM) is a power management program on the consumer or user side. Whether in managing as load or electrical loads that can be power generation at other times, like battery. For the management of
the generating system, with renewable energy sources, is carried out by a distributed generating mechanism.
Through the DSM program customers can generate energy using renewable energy sources, through distributed generating schemes, which can be used to meet power demand of residential load and supplied power to the network in case of excess power. Peak load issues, occurring at certain times, are handled through the DSM program, which offers consumers some incentives and tariff cuts if consumers follow some of the programs included in DSM activities. Utility companies offer different tariff patterns to customers when changing the operating patterns of some household appliances beyond the peak load [12]. There some main activities of DSM among others:
a. Load shifting
b. Energy efficiency (energy conservation) c. Peak shaving
The load shifting activity is intended to reduce household power usage at peak load. As for energy efficiency activities is done by changing some household appliances with energy-efficient, and implement energy saving activities, such as turning off unnecessary equipment. Peak shaving is done by turning off some loads or substituting the power thereby reducing the power of the utility [13-14].
a. b. c.
Figure 1. a. Load Shifting b. Energy Conservation c. Peak Shaving
2.1. Load Shifting and Power Shifting
One of the smart grid features in maintaining power system stability is the possibility of customer participation in power system operation schemes. Customer participation is done by acting as a producer, energy saver and load controller. With the support of information technology, as one of the smart grid infrastructure, power system operators can conduct plant operation planning in accordance with the generating capacity profile and power demand of the consumer load. Utility company can inform the program that include customer contributions in the power system operation scheme. On the customer side of the information provided is used to plan the operation of household appliances, especially for scheduled expenses [15].
Generally the type of household electrical load can be divided into unmanageable load, manageable load and elastic load. Unmanageable load is electrical appliance whose operating time and magnitude of the power cannot be adjusted, such as refrigerators, TVs and lights. Manageable load is electrical appliance whose operating time can be adjusted, such as washing machine and dishwasher. Elastic load is electrical equipment whose operating time and its power can be set, such as, air conditioner [16]. Observations on residential load profile are indispensable and become a major part of the information needed by utility company in planning the generation operation, whether for now or for the future. The grouping of residential load is based on the level of variability in customer behavior, taking into account the pattern of electricity energy consumption will be obtained a way to identify subset of electricity usage that may be in the intervention that will affect the pattern of customer activity [17-18].
The load shifting mechanism is performed under the application of home energy management system (HEMS) which acts as an application that can manage the operation of all household appliances activities in accordance with the status of energy consumption thr ough smart meter equipment. Smart meter devices installed in HEMS applications are equipped with
Advance Matering Infrastructure (AMI) technology. Smart meter device through AMI will receive price notification and energy consumption profile from utility company, then with HEMS application will make arrangement of operation to existing household device so that will get cheaper energy price and comfort at user still can be reached [19].
Things to consider in doing load shifting is a convenience factor that must be maintained, not to save energy costs obtained but the user is not comfortable. Therefore, it is necessary to optimize the mechanism based on cost savings and user convenience parameters. Some research is done to get the value of savings and comfort of the user, among others, by arranging on the pump pool, air conditioning and water heater. Other studies made arrangements on start up air conditioner thermostats and water heaters with several optimization methods such as linear mixed integer programming [20].
2.2. Load Factor
The contribution of residential load to the quality of power system can be done by creating a relatively flat residential load profile so that there is no extreme power variation. To illustrate the variation of residential load power in one day can also be used load factor (LF) parameter, which states the comparison between the average power to peak power [21].
𝐿𝑜𝑎𝑑 𝐹𝑎𝑐𝑡𝑜𝑟 = 𝐿𝑜𝑎𝑑𝑎𝑣𝑒𝑟𝑎𝑔𝑒
𝐿𝑜𝑎𝑑𝑝𝑒𝑎𝑘
The load variation parameter can also be expressed in the peak to average ratio (PAR) which is the opposite of the load factor.
𝑃𝑒𝑎𝑘 𝑡𝑜 𝑎𝑣𝑒𝑟𝑎𝑔𝑒 𝑟𝑎𝑡𝑖𝑜 = 𝐿𝑜𝑎𝑑𝑝𝑒𝑎𝑘
𝐿𝑜𝑎𝑑𝑎𝑣𝑒𝑟𝑎𝑔𝑒
To express the average variation of power fluctuations on average power can be used standard deviation statistical parameters where, the greater the standard deviation (SDV) means the power fluctuation is large enough while the smaller the mean deviation means the power fluctuations are not too large;
𝜎 = √1
𝑁∑(𝑃𝑖− 𝑃𝑎𝑣𝑒𝑟𝑎𝑔𝑒)
2 𝑁
𝑖 =1
Determination of DSM method where appropriate can be done by classifying and analyzing the load profile by using parameters of peak ratio and night ratio. Peak Ratio (PR) is defined as the ratio of average power absorbed during peak hours in a certain time duration, to average power absorbed during off-peak day hours in the same period [22].
𝑃𝑒𝑎𝑘 𝑟𝑎𝑡𝑖𝑜 = 𝐴𝑣𝑒𝑟𝑎𝑔𝑒 𝑝𝑜𝑤𝑒𝑟 𝑎𝑏𝑠𝑜𝑟𝑏𝑒𝑑 𝑑𝑢𝑟𝑖𝑛𝑔 𝑝𝑒𝑎𝑘 𝑝𝑒𝑟𝑖𝑜𝑑
𝐴𝑣𝑒𝑟𝑎𝑔𝑒 𝑝𝑜𝑤𝑒𝑟 𝑎𝑏𝑠𝑜𝑟𝑏𝑒𝑑 𝑑𝑢𝑟𝑖𝑛𝑔 𝑑𝑎𝑦 𝑝𝑒𝑟𝑖𝑜𝑑
Night Ratio (NR) is defined as the ratio of average power absorbed during night hours in a certain time duration, to average power absorbed during off-peak day hours in the same period.
𝑁𝑖𝑔ℎ𝑡 𝑟𝑎𝑡𝑖𝑜 = 𝐴𝑣𝑒𝑟𝑎𝑔𝑒 𝑝𝑜𝑤𝑒𝑟 𝑎𝑏𝑠𝑜𝑟𝑏𝑒𝑑 𝑑𝑢𝑟𝑖𝑛𝑔 𝑛𝑖𝑔ℎ𝑡 𝑝𝑒𝑟𝑖𝑜𝑑
𝐴𝑣𝑒𝑟𝑎𝑔𝑒 𝑝𝑜𝑤𝑒𝑟 𝑎𝑏𝑠𝑜𝑟𝑏𝑒𝑑 𝑑𝑢𝑟𝑖𝑛𝑔 𝑑𝑎𝑦 𝑝𝑒𝑟𝑖𝑜𝑑
3. Experimental Setup
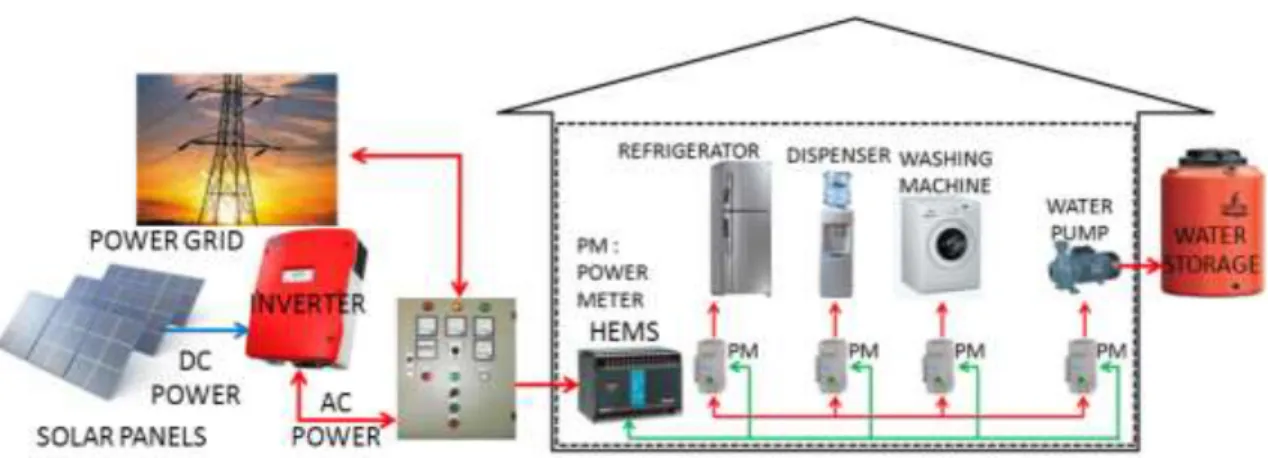
In this research, load factor analysis on the load operation arrangement, especially on load of water pump and washing machine with load shifting method in framework of HEMS application development. To compare the load profile of the water pump and the was hing machine to another load, we measured the load characteristics of some household appliances.
Based on these measurements, it can be seen that household burden is estimated to consume considerable power. Measurements are also done by the main panel to s ee the overall power consumption and output power of PV generators. For household loads measurements are carried out on the load of water pumps, washing machines, water dispensers and refrigerator. Washing machine is measured because it is a household load whose operating time allows to be set / moved. Water pumps are household expenses with considerable power consumption and dispensers and refrigerators are continuous loads that can not be moved during operation as they operate as needed and operate continuously. The HEMS application regulates the operation of water pumps and washing machines to ensure that these two devices never work together and when the washing machine starts to work, the level of water storage in full conditions so that during washing process a water storage will not run out water.
Figure 2. HEMS Aplication and Measurement power
4. Result and Discussion
The measurement result at residential loads as a whole shows, that the total daily consumption of 15,743 kWh with average of 651,84 watt electricity. The maximum power of 2293 watts and a minimum of 206 watts. While the pump load profile based on the measurement data shows the total energy consumption required to conduct a water charge of 622Wh with a duration of operation during 1:03:55 and the average power of 576,71 watts. In one day the water pump works for 4 times so the total consumption is around 622 x 4 Wh = 2488Wh. Power profile of washing machine load, based on the measurement data shows the total energy consumption required to perform a washing process is 111 Wh with a long operation time of 2:12:55 (1x per day) and an average power of 285,5 watts. Operation time during that time is because there is soaking phase for 1 hour, with 318 watts maximum power and 253 watts minimum power. Load profile of dispensers and refrigerators, from the measurement results show the average energy consumption in one day of 2125Wh and the average power required of 87.77 watts. The maximum power for this load is 890 watts and the minimum power required for this load is 0 watts.
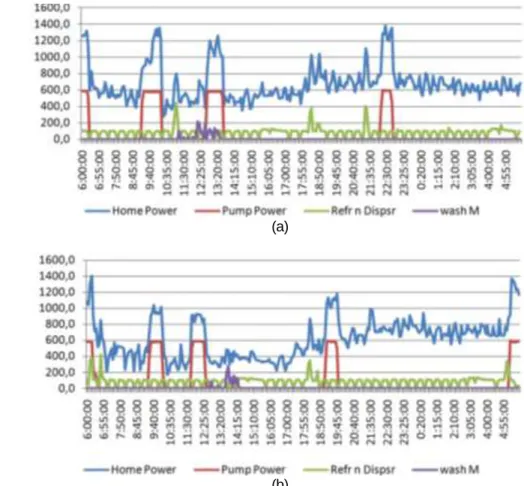
Measurable measurements for all loads and at the total load of households. In this measurement the operation of the washing machine is almost simultaneous with the activation of the water pump. The same measurements are repeated but the operation of the washing machine is done after the pump is finished, meaning the water level is full. The measurement results are shown in Figures 3a and 3b. Load analysis shows the LF of the two operating methods are 49% and 43,9% respectively. The standard deviation values of both are 219,95 watts and 249,45 watt. This shows, Implementation with and without load shifting give the result that two operation methods are not too significant to change the form of residential load profile.
(a)
(b)
Figure 3. Load Profile a. LF = 49,4% SDV = 219,95 watt b. LF = 43,9% SDV = 249,45watt
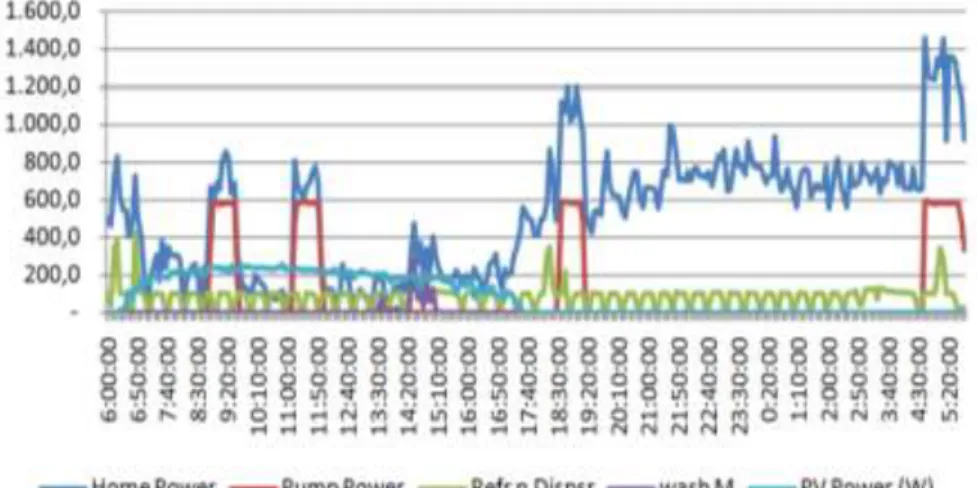
In this study also included the source of a micro power plant using a solar power plant with a capacity of 4 x 180Wp using a 500watt inverter. The result of the average measurement of the solar power output power profile as shown in Figure 4. With the average energy produced is 2076,74Wh. The utilization of output power from solar generation is done in two approaches, ie without storage media and with storage media. In method without storage media the output power from solar generation directly supplies to residential load so that it will reduce the electric power from utility company. While system with storage media to store electric power from solar generation, this's implementation of power shifting. Energy stored in battery will be supplying power when water pump turn on so thet it will be reduce power from grid.
The measurement results show that the distribution of power from solar power generation directly to the load will only decrease the LF value and increase the SDV value, which means the variation of household load is wider with the distribution that is also enlarged. Meanwhile with power shifting method, discharging power from solar power generator that's stored in storage media and will only be supplying power when the pump turn on obtained a better LF value than before with a LF of 54.9% and SDV of 194.37 watt.
Figure 5. Load Profile with power subtitution PV, LF = 36,6% and SDV = 323,67watt
Figure 6. Load Profile with power substitution using power shifting method to supplied electric power to water pump from storage media, LF = 54,9% and SDV = 194,37 watt
6. Conclusion
Implementation of load shifting method on water pumps and washing machines did not make a significant difference. This is due to the amount of power required by the washing machine of 253watt, not too large compared to the power required by the water pump of 576,71 watts, with a much different power consumption, where the washer consumes only 111Wh of electricity while for the water pump in a day consumes 2488Wh of electricity.
The penetration of solar power generation has no significant effect on the load profile when used without storage media, LF value indicates a large load fluc tuation with LF=36.6% and SDV=323,67watt. Meanwhile, implementation of power shifting method using storage media is obtained the load fluctuations are not t oo large with the value of LF=54.9% and SDV=194.37watt.
References
[1] Team Handbook. 2016 Handbook of Energy & Economic Statistics of Indonesia Final Edition.
Ministry of Energy and Mineral Resources Republic of Indonesia ISSN 2528 -3464. 2016.
[2] Hassan B, Brono F, Toshifumi ISE. Microgrid dynamic and control. John Wiley & Sons . 2017.
[3] JO Petinrin and M Shaaban. Overcoming Challenges of Renewable Energy on Future Smart Grid.
TELKOMNIKA Telecommunication Computing Electronics and Control . 2012; 10(2): 229-234.
[4] A Barbato and A Capone. Optimization Models and Methods for Demand -Side Management of
Residential Users: A Survey. Energies. 2014; 7(9): 5787-5824.
[5] SK Nayak, NC Sahoo, G Panda. Demand side management of residential loads in a smart grid using
2D particle swarm optimization technique. Power, Communication and Information Technology Conference (PCITC). IEEE. 2015.
[6] SA Pourmousavi, SN Patrick, MH Nehrir. Real-Time Demand Response Through Aggregate Electric
Water Heaters for Load Shifting and Balancing Wind Generation. IEEE Transactions on Smart Grid. 2014; 5(2): 769-778
[7] Zhong H, Xia Q, Xia Y, Kanga C, Le X, Wen H, Zhang H. Integrated dispatch of generation and load:
A pathway towards smartgrids. Electric Power System Research. 2015; 120: 206-213.
[8] RL Hu, R Skorupski, R Entriken, Yinyu YA. Mathematical Programming Formulation for Optimal Load
Shifting of Electricity Demand for the Smart Grid. IEEE Transactions on Big Data. 2016; 99.
[9] Jianhong Z, Wen XP. Intelligent Control of Wind/Photovoltaic Microgrid Information Fusion .
TELKOMNIKA Telecommunication Computing Electronics and Control. 2017; 15(1): 264-272. [10] Gayathri N, Vineeth VV, N Radhika. A Novel Approach in Demand Side Management for Smart
Home. Procedia Technology. 2015; 21: 526-532.
[11] RM Larik, MW Mustafa. Technologies Used in Smart Grid to Implement Power Distribution System. TELKOMNIKA Telecommunication Computing Electronics and Control. 2015; 16(2): 232-237. [12] P Palensky, D Dietrich. Demand Side Management: Demand Response, Intelligent Energy Systems,
and Smart Loads . IEEE Transactions on Industrial Informatics. 2011; 7(3): 381-388.
[13] McKinsey & Company. The Smart Grid and the Promise of Demand-Side Management. McKinsey & Company. 2010.
[14] Peter DL, Juuso L, Jani M, Jyri S. Review of energy system flexibility measures to enable high levels of variable renewable electricity. Renewab le and Sustainab le Energy Reviews. 2015; 45: 785-807. [15] JP Clemente. Smart Electrical Distribution [Smart Grids]. Distribution & Industrial Networks University
of Ljubljana. 2015.
[16] Antimo B, Antonio C. Optimization Models and Methods for Demand -Side Management of Residential Users: A Survey. Energies. 2014; 7: 5787-5824.
[17] Dent I, Craig T, Aickelin U, Rodden T. Variability of Behaviour in Electricity Load Profile Clustering; Who Does Things at the Same Time Each Day? In: Perner, P. (ed.) ICDM 2014. LNCS, Springer, Heildelberg. 2014; 8557: 70-84.
[18] Manisa P, Murat K, Saifur R, Yonael T. Load Profiles of Selected Major Household Appliances and Their Demand Response Opportunities . IEEE Transactions on Smart Grid. 2014; 5(2): 742-750. [19] Nikolaos G, Georgios BG. Residential Load Control: Distributed Scheduling and Convergence With
Lost AMI Messages. IEEE Transactions on Smart Grid. 2012; 3(2): 770-786.
[20] E Pouresmaeil, JM Gonzalez, K Bhattacharya, CA Canizares . Development of a Smart Residential Load Simulator for Energy Management in Smart Grids . IEEE Transactions on Power Systems. 2013: 1-8.
[21] J Abaravicius, K Sernhed, J Pyrko. Analyzing Load Demand in Residential Houses . ACEEE Summer Study on Energy Efficiency in Buildings . 2006.
[22] K Yumak, G Tosun, B Varlık, M Bağrıyanık. Load curve classification for the evaluation of demand
side management programs. 20th IManEE, IOP Conf. Series: Materials Science and Engineering 161. 2016.