DEVELOPMENT OF A FOUR STAGE CONTINUOUS
IMPROVEMENT FRAMEWORK TO SUPPORT
BUSINESS PERFORMANCE IN MANUFACTURING
SMEs
Paul G. Smith, MSc
A thesis submitted in partial fulfilment of the requirements of the University of Wolverhampton for the degree of Doctor of Philosophy
July 2016
This work or any part thereof has not previously been presented in any form to the University or to any other body whether for the purpose of assessment, publication or for any other purpose (unless otherwise indicated). Save for any express acknowledgements, references and/or bibliographies cited in the work, I confirm that the intellectual content of the work is the result of my own efforts and of no other person.
ii
Abstract
For over 30 years, authors have documented continuous improvement techniques that can help to improve the performance of the manufacturing sector. However, recent research has found that the uptake of these available techniques for the purpose of improving business performance is comparatively low as a result of barriers preventing their adoption by manufacturing SMEs. The aim and focus of this research is to develop a user-friendly framework which would guide both industry practitioners and other researchers to achieve business process improvements in an SME manufacturing environment.
The framework developed in this study consists of four stages: 1) review of the current process to be improved; 2) identification of possible improvement in terms of prompts; 3) knowledge know-how to support transfer of proven continuous improvement techniques; and 4) continual review of the process to quantify the improvements. The framework uses a combination of three continuous improvement techniques: histograms, brainstorming and Five Whys to identify actions for management implementation. Such techniques have been merged to speed up and simplify the process of root cause analysis, thus encouraging SMEs to document their successes. This will enable other SMEs to learn from their experiences as well as from the knowledge gained by being part of the communities of practice.
The methodology used in this research is mixed methodology and involves a combination of literature review, pilot study, a postal questionnaire with 50 respondents and two case studies. These case studies were then used to validate the framework, based on five structured interviews.
Case studies involving two manufacturing SMEs include manufacturers of high-volume, low-cost components and low-high-volume, high-cost components. It was concluded that the root cause of a problem can be found by using: brainstorming, histograms and Five Whys. Sometimes, it was also possible to merge these techniques as one, thus reducing the analysis time. The case studies generated substantial savings, £27,500 and £1,366,055 for SME 1 and 2 respectively. Overall the benefits of the framework to SMEs include: using the developed user-friendly framework for improved business performance, knowledge transfer of learning continuous improvement techniques, learning about other SME successes and potential cost savings that could accrue for SMEs when they apply it.
The framework developed in this research, therefore, has reduced some of the barriers which have prevented uptake of innovative techniques over the last 30 years.
iii
Acknowledgements
I would like to thank the staff at the University of Wolverhampton who have helped me to develop my skills in a wide range of areas (especially Dr Subashini Suresh for her professional support). The support has provided me with more confidence in the skills required to complete a research project.
Thanks also to the companies that took the time and showed an interest in the survey work by providing feedback that has helped me to understand the barriers and problems faced by SMEs in today’s highly pressurised business environment.
The company where I work has supported me during every part of the process of this thesis. Initial experiments and various trials on people and processes at the company gave valuable initial feedback.
I am very proud to have met a range of researchers at international conferences that I attended and where I have had papers published.
My journal paper was extremely personally rewarding, and involved me being provided with the opportunity to inform other authors of the research that I have been working on during the last few years.
Without the support and co-operation of the case study companies on many visits, I would not have been able to properly validate the framework.
And finally I wish to acknowledge the contribution of my family during my research journey over the years: they have fully supported me without question.
iv
Table of Contents
Abstract ... ii
Acknowledgements ... iii
List of Figures ... x
List of Tables... xii
List of Appendices ... xiii
Publication List ... xiv
Abbreviations ... xv
Chapter 1: Introduction to the Research Project ... 1
1.1 Introduction ... 1
1.2 Research Problem ... 1
1.3 SMEs – The Challenges They Face ... 3
1.4 SMEs – The Way Forward ... 4
1.5 Research Question ... 6
1.6 Aim and Objectives ... 6
1.7 Research Scope ... 7
1.8 Research Motivation ... 7
1.9 Resolving Problems and Inefficiencies ... 9
1.10 Thesis Structure ... 10
1.11 Summary ... 11
Chapter 2: Literature Review ... 12
2.1 Introduction ... 12
2.2 Operational Definitions ... 14
2.3 Continuous Improvement Techniques Planned for Use in the Framework ... 15
2.3.1 Histograms ... 15
2.3.2 Brainstorming ... 16
2.3.3 Cause and Effect ... 18
2.3.4 The Five Whys ... 19
2.4 Benefits of Continuous Improvement Techniques ... 21
2.5 Barriers to Continuous Improvement ... 22
v
2.7 Value Stream Mapping – An Initial Possible Concept for Improvement .. 27
2.8 Literature on Continuous Improvement ... 30
2.9 Is Kaizen Supported by CI Techniques? ... 31
2.10 Top Management Support ... 34
2.11 Key Performance Indicators... 36
2.11.1 A Process-Based Approach ... 36
2.12 Training and Employee Participation ... 38
2.12.1 Management Systems ... 42
2.12.2 Efficiency ... 45
2.12.3 Visual Management ... 45
2.12.4 Administration Processes ... 46
2.12.5 Business Professionals ... 46
2.12.6 A Common Theme: Plan – Do – Check – Act ... 46
2.13 Knowledge Management ... 47
2.13.1 Introduction ... 47
2.13.2 SMEs Struggling to Change ... 48
2.13.3 Knowledge-Based Modelling ... 49
2.13.4 Knowledge Management ... 49
2.13.5 Learning from Knowledge ... 50
2.13.6 The Appeal of Knowledge Management ... 52
2.13.7 Learning by Doing ... 53
2.13.8 The Benefit of Knowledge Management Systems ... 56
2.14 Communities of Practice ... 58
2.15 Root Cause Analysis and SMEs ... 60
2.16 Summary ... 62
Chapter 3: Research Methodology ... 64
3.1 Introduction ... 64 3.2 Research Philosophy ... 64 3.2.1 Axiology ... 64 3.2.2 Ontology ... 65 3.2.3 Epistemology ... 66 3.3 Research Planning ... 68 3.3.1. Preparation ... 70
vi
3.3.2 Research Strategy ... 70
3.4 Pilot Study... 71
3.5 Literature Review ... 71
3.6 Research Data Analysis Tools ... 71
3.6.1 Qualitative Data Analysis... 71
3.6.2 Quantitative Data Analysis ... 72
3.6.3 Qualitative and Quantitative – A Mixed Approach ... 73
3.7 Case Studies ... 73 3.8 Data Collection ... 74 3.9 Interviews... 75 3.9.1 Open-ended Interviews ... 76 3.9.2 Focused Interviews ... 76 3.9.3 Structured Interviews ... 76 3.10 Observations ... 77 3.11 Soft Systems ... 78 3.12 Outputs ... 79
3.13 Details of the Case Studies... 80
3.13.1 Problems Identified at the Businesses ... 80
3.13.2 Documentation and Data Control ... 82
3.13.3 Data Collection in the Case Studies ... 82
3.14 Data Analysis ... 83
3.15 Validation ... 85
3.15.1 Reliability and Validity of Data ... 86
3.15.2 Ethical Clearance ... 87
3.16 Summary ... 87
Chapter 4: Framework Development ... 89
4.1 Introduction ... 89
4.1.1 Training Alone Will Not Improve Business Performance ... 89
4.1.2 Knowledge Management ... 91
4.1.3 Review of Business Improvement Models ... 92
4.1.4 Business Improvement Process Modelling ... 93
4.1.5 Business Excellence Model ... 93
vii
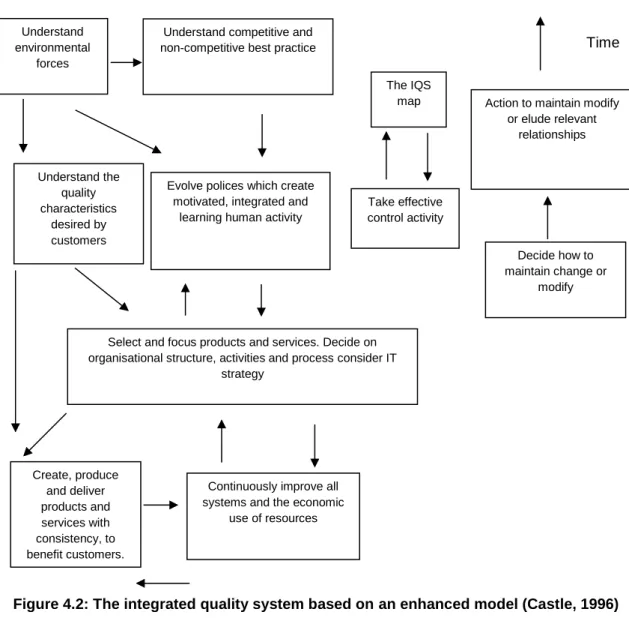
4.3 Integrated Quality System... 95
4.3.1 ISO 9001 ... 97
4.3.2 Plan-Do-Check-Action ... 97
4.3.3 Four Key Process Approach ... 99
4.3.4 Balanced Scorecard ... 99
4.3.5 Six Sigma ... 100
4.3.6 Lean Thinking ... 101
4.3.7 Baldridge Award ... 102
4.4 Knowledge-based Process Models ... 103
4.5 Business Improvement Process Model Problems ... 103
4.6 Framework Specification ... 104
4.6.1 Potential Problem Areas ... 104
4.7 Framework Development Considerations ... 104
4.7.1 Management Commitment ... 105 4.7.2 Flowchart ... 105 4.7.3 Change Management ... 105 4.7.4 Communication ... 105 4.7.5 Knowledge Management ... 105 4.7.6 Employee Competence ... 106 4.7.7 Plan-Do-Check-Act ... 106 4.8 Framework Development ... 107
4.8.1 KPIs Present State: KPIs Future State ... 107
4.8.2 Input – Process – Output ... 107
4.8.3 Process – Data ... 108
4.8.4 Change Process ... 108
4.8.5 Improvements ... 108
4.8.6 Auditing ... 108
4.9 The Framework Flow Chart ... 109
4.10 The 4 Stage Continuous Improvement Framework ... 111
4.11 Summary ... 114
Chapter 5: Continuous Improvement SME Awareness Pilot Study ... 115
5.1 Introduction ... 115
viii
5.3 The Continuous Improvement SME Awareness Pilot Study ... 116
5.4 Continuous Improvement SME Awareness Pilot Study: Implications for the Main Study ... 125
5.5 Summary ... 126
Chapter 6: Results from the Case Study Work and Structured Interviews ... 127
6.1 Introduction ... 127
6.2 Case Study 1 ... 128
6.3 Case Study 2 ... 130
6.4 Case Study Teams ... 134
6.5 Problems Identified at the Businesses ... 135
6.6 Case Study Data Collection ... 137
6.7 Case Study Work ... 138
6.8 Sample Case Study Process ... 139
6.9 Histograms... 139
6.10 Brainstorming ... 141
6.11 Five Whys ... 141
6.12 Positive Case Study Feedback ... 145
6.13 Case Study Tool Suggestions ... 145
6.13.1 Framework Versus Other Models ... 146
6.14 Case Study Analysis ... 148
6.14.1 Structured Interview Analysis ... 152
6.14.2 Case Study Work ... 164
6.15 Continuous Improvement Linked Approach ... 166
6.16 Case Study Improvements... 168
6.17 Summary ... 170
Chapter 7: Discussion and Conclusions ... 171
7.1 Introduction ... 171
7.2 Discussion of Research Conducted ... 171
7.3 Conclusions: Achievement of Research Objectives ... 172
7.4 Contribution to Knowledge ... 175
7.5 Research Limitations ... 178
7.6 Conclusion ... 179
ix
References... 186 Appendices ... 203
x
List of Figures
Figure 2.1: Mind map of the literature review ... 13
Figure 2.2: Histogram showing defect data collected ... 16
Figure 2.3: Cause-and-effect diagram ... 19
Figure 2.4: The Kaizen Umbrella ... 33
Figure 2.5: Model of a process-based quality management system ... 37
Figure 2.6: Toyota pull system ... 40
Figure 2.7: Model for CI ... 44
Figure 2.8: Plan-Do-Check-Act ... 47
Figure 2.9: The doughnut model of KM ... 59
Figure 3.1: Research approach ... 68
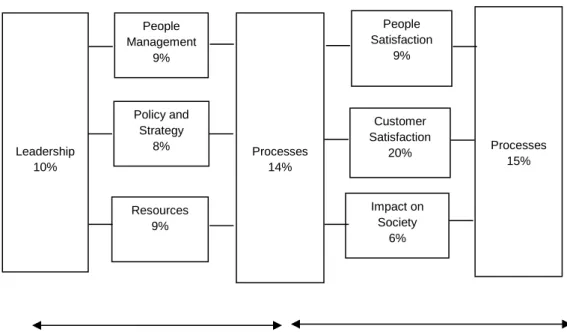
Figure 4.1: The business excellence model ... 94
Figure 4.2: The integrated quality system based on an enhanced model ... 96
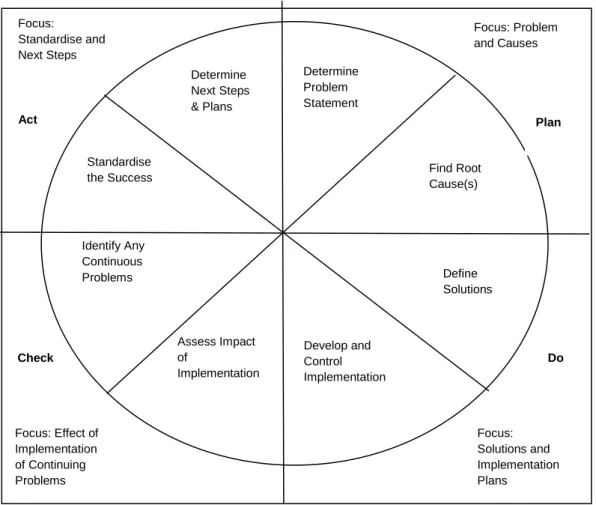
Figure 4.3: The Plan-Do-Check-Act matrix ... 98
Figure 4.4: Balanced scorecard ... 100
Figure 4.5: Flow of activities for developing the conceptual framework ... 110
Figure 4.6: Conceptual pre-case study framework ... 113
Figure 5.1: Respondents’ knowledge of Word, Excel and Access ... 117
Figure 5.2: Quality standard systems implemented ... 118
Figure 5.3: Typical reasons SMEs are under pressure to improve efficiency . 120 Figure 5.4: Barriers preventing SMEs from improving performance ... 121
Figure 5.5: Reasons why SMEs do not implement CI techniques ... 124
Figure 5.6: Number of SMEs stating potential benefits of using CI techniques125 Figure 6.1: Case Study 1 process flow ... 129
Figure 6.2: Case Study 2 process flow ... 132
Figure 6.3: Esco total hours of downtime ... 139
Figure 6.4: Multi-spindles total hours of downtime ... 140
Figure 6.5: Rotary transfer total hours of downtime ... 140
Figure 6.6: Software computer skills ... 153
Figure 6.7: Businesses that have implemented process models ... 154
Figure 6.8: Implemented KPIs in case study companies ... 155
xi
Figure 6.10: Use of waste minimisation practices ... 158
Figure 6.11: Use of process improvement techniques ... 160
Figure 6.12: Linked approach ... 167
xii
List of Tables
Table 2.1: Operational definitions in this research ... 14
Table 2.2: Authors who have identified CI techniques, barriers, knowledge management and waste ... 23
Table 2.3: Barriers to SME progress identified by academics by percentage ... 26
Table 2.4: The Seven Stream mapping tools ... 29
Table 2.5: Authors who promote CI techniques to help businesses improve .... 30
Table 3.1: Qualitative data collection types, options, advantages and limitations ... 69
Table 4.1: The Baldridge Award versus EI/TQM criteria ... 102
Table 5.1: Respondents’ knowledge of practice that can affect business performance ... 119
Table 5.2: Awareness of CI techniques used by SMEs ... 122
Table 6.1: Brainstorming – tooling broken ... 141
Table 6.2: Five Whys – tooling broken, speeds and feeds ... 142
Table 6.3: Five Whys – tooling broken, manufacturing tooling consistency .... 142
Table 6.4: Five Whys – tooling broken, setting ... 143
Table 6.5: Five Whys – tooling broken, destruction ... 143
Table 6.6: Five Whys – tooling broken, initial setting ... 144
Table 6.7: Five Whys – tooling broken, material specification ... 144
Table 6.8: Five Whys – tooling broken, design ... 145
Table 6.9: Framework versus other available process models ... 147
Table 6.10: Case Study 1 problems ... 149
Table 6.11: Case Study 2 problems ... 151
xiii
List of Appendices
Appendix 1: PowerPoint Presentations ... 203
Appendix 1a: Let’s Improve ... 203
Appendix 1b: Histograms ... 212
Appendix 1c: Brainstorming ... 215
Appendix 1d: Five Whys ... 218
Appendix 1e: Cause & Effect ... 221
Appendix 1f: ISO 9001 ... 224
Appendix 1g: ISO14001 ... 230
Appendix 2: Waste Prompts ... 234
Appendix 3: KPI Sample Proposals ... 235
Appendix 4: Waste Identification Audit Sheet ... 236
Appendix 5: Sample Process KPIs Format ... 237
Appendix 6: Histogram Sample... 238
Appendix 7: Brainstorming Sample ... 239
Appendix 8: Five Whys ... 240
Appendix 9: Cause and Effect... 241
Appendix 10: Project Sheet ... 242
Appendix 11: Improvements Summary ... 243
Appendix 12: Pilot Study Questionnaire ... 244
xiv
Publication List
Journal Paper
Smith, P.G., and Oduoza, C.F. (2014) Development of a Web-based Tool to Sustain Continuous Improvement and Productivity in a Manufacturing Environment – A Case Study Approach. Scientific Journal of Management Science and Engineering, Vol 3, Issue 4, pp. 88-93.
Conference Papers
Oduoza, C.F., Barber, K.D. and Smith, P.G. (2008) Enterprise Continuous Improvement Techniques – A Perceived Gap. Flexible Automation and Intelligent Manufacturing, FAIM2008, Skovde, Sweden, pp 808-814.
Oduoza, C.F., and Smith, P.G. (2012) Development of a Web-based Tool to Sustain Continuous Improvement and Productivity in Manufacturing Small and Medium Size Enterprises (SMEs). IEEE International Conference on Adaptive Science and Technology, Kumasi, Ghana, pp 143-148.
Smith, P.G., and Odouza, C.F. (2014) Analysis of Internet Process Tool for Continuous Improvement and Productivity in a Manufacturing Environment.
Flexible Automation and Intelligent Manufacturing, FAIM2014, San Antonio, Texas, USA, pp 1093-1098.
Smith, P.G., Odouza, C.F., and Barber, K.D. (2010) Continuous Improvement Tools to Improve Productivity in Manufacturing SMEs. Flexible Automation and Intelligent Manufacturing, FAIM2010, Oakland, California, USA, pp 89-96.
Smith, P.G., Odouza, C.F., and Barber, K.D. (2009) Manufacturing Process Improvement: Perceived Barriers from Adoption of Good Practice by SMEs.
Flexible Automation and Intelligent Manufacturing, FAIM2009, Teesside, UK,
xv
Abbreviations
AR Action research BOM Bill of materials
BPR Business process re-engineering BSI British Standards Institute
CI Continuous improvement COP Communities of practice FMEA Failure modes effects analysis
KDD Knowledge discovery in accident database IQS Integrated quality system
IS Information system IT Information technology
KM Knowledge management
KMS Knowledge management system KPI Key performance indicators
KS Knowledge sharing
OEM Original equipment manufacturer PDCA Plan-Do-Check-Act
QC Quality control
QFD Quality function deployment QMS Quality management system
SECI Socialisation, externalisation, combination and internalisation process SCK Short cycle kaizen
SMEs Small and medium sized enterprises
SMMT Society of Motor Manufacturers and Traders SPC Statistical process control
SSM Soft systems methodology ST Systems thinking
TPM Total predictive maintenance TPS Toyota production system TQC Total quality control TQM Total quality management TS Technical specification
xvi
US United States
VA/VE Value analysis/value engineering VSM Value stream mapping
1
Chapter 1: Introduction to the Research Project
1.1 Introduction
Chapter 1 introduces an overview of the research project, informing the reader of the background, the problem statement and the research questions to be answered. The aim of this research is to develop a framework to support continuous improvement in SMEs. This research also has defined objectives that have been established in order to achieve the aim. The structure of this thesis is also detailed in this section.
1.2 Research Problem
Jevgeni et al. (2015) have stated there are many problems that manufacturing companies face today, such as unreliable production processes, poor product quality, financial losses and delays in production delivery. Companies do not often understand the root causes of these problems. Problems in manufacturing can stem from various causes in a range of business areas. In order to survive in the competitive market, companies should always be able to satisfy their customers by continuously improving.
Jonsdottir et al. (2014) have noted that globalisation, new technology and competition make today’s surroundings ever-changing for organisations. Customers’ needs and wants change rapidly, making customer and market share retention an uphill battle. It is important that there is continuous improvement of and a systematic approach to projects.
Zeng et al. (2015) have stated that in an increasingly competitive marketplace, both quality and innovation play crucial roles in securing a sustainable competitive advantage.
2
Cayer (2001) has stated that organisations have failed in the past by choosing the incorrect type of improvement tools to address their problems. Choosing the incorrect type of improvement tool can increase problems even further and still not prevent them.
Meanwhile, Bateman and David (2002) have noted that companies can have initial short-term success with available process improvement tools; however these are not sustainable. Process improvement programmes are useful projects for improving competitiveness, but the concern about maintaining them is well founded.
Ljungstrom (2005) found that many companies struggle with their competitiveness in the market place. The global market has reduced the number of mergers and produced many large companies working at an international level. These companies strive to produce the best product at the lowest cost. The following obstacles are often encountered: the company is totally production-focused and does not support continuous improvement or cross-functional thinking; the ability to learn and create a learning organisation is missing; no response is given to suggestions or improvement ideas; no management commitment; lack of resources; negative opinions on business improvement; culture of people not wanting to implement change; political issues in terms of managers trying to influence purely for their own gains and not necessarily in the best interests of the business.
Khan et al. (2008) have stated that SMEs regard frameworks such as the European Foundation for Quality Management (EFQM) as daunting and difficult. What SMEs require is an SME-specific framework that leads them down the continuous improvement journey at their own pace. Typical issues that SMEs can encounter in an attempt to make improvements are: cash-flow problems, customer dissatisfaction, poor deliveries, high volume of work-in-progress, lack of process improvement, high levels of stock, quality internal and customer defects, and lack of flexibility (Khan et al. 2008).
Khan et al. (2008) have also pointed out that companies that have no desire to improve do not gain from the many benefits that can easily be gained from a process improvement programme. Examples of potential benefits that would not
3
be gained include: improved customer focus and support; improved delivery performance; improved speed and flexibility; quick and simple changeovers; improved quality performance; reduced rework; good quality-related feedback from customers; reduced WIP; efficient supply chain; increased business performance; and reduced overheads.
SMEs face challenges, and it is important that they understand the problems in order to seek improvements to prevent the problems from reoccurring.
1.3 SMEs – The Challenges They Face
Lewis and Cassells (2010) have documented the specific issues that SMEs face: inconsistent management, lack of time and financial restraints. Hyland et al. (1999) have noted that SMEs often have no strategies, or sometimes poorly developed strategies. This can cause business problems, particularly with preventing people within the business from gaining knowledge of a learning process. An important concept for SMEs is the concept of a continuous improvement framework, where employees can learn and benefit from such knowledge.
Sutton (2015) found that customers from around the globe are beginning to respect SMEs. Organisations that strive to be more ‘human’ in their approach can exceed customer expectations. However, increasing competition and the ever-demanding needs of customers, as well as recessionary and globalisation pressures, emphasise a need to focus on business improvement. In many cases, processes within service industry SMEs are not very well controlled, due to difficult-to-control factors. Events and decisions are made without the adequate skills and experience being present. The survey carried out by Sutton (2015) found that only 57% of SMEs claimed to have made use of improvement tools and techniques, while other SMEs had not implemented any tools or techniques.
Matthee and Heymans (2013) have found that SMEs are considered to be important drivers of economic growth and development throughout the world.
4
However, to deliver true economic benefits, they need to grow into sustainable and profitable businesses. Expanding into foreign markets provides an excellent vehicle for growth, but many hurdles stand in the way of SMEs making the transition from the local to the international. The difficulty associated with obtaining finance for export market development is a key stumbling block. Matthee and Heymans (2013) comment that financial institutions regard SMEs as high risk, because they have limited resources and capacity and are more likely to default than larger businesses. One of the issues is poor performance by SMEs. Poor performance needs to be prevented to ensure that all of the customer’s requirements are met; this prevents the cancellation of orders and lost revenue, which result in an inability to continue to repay loans to financial institutions.
Xu (2013) found that SMEs face the following challenges: low profit margins and relatively backward management. This can affect decisions for the financing required for growth of an SME. Also, there has been a lack of trust between SMEs, universities, research institutes and government departments. SMEs could benefit if they were committed to making change happen within their business environments. Xu (2013) also states that if SMEs do not make change happen, then the problems will not get resolved and this will affect their business performance.
1.4 SMEs – The Way Forward
Makedos (2014) has stated, based on a research study of SMEs, that know-how can increase innovation in the production process and can benefit SMEs in term of improved performance. A cluster approach is feasible, whereby SMEs can learn from each other and also from universities to implement improvements. This could improve their overall competitiveness and productivity. However, only 42% of SMEs thought this was important, while 37% thought that the approach of working within a cluster would increase the strength of their business. Both Makedos (2014) and Oduoza et al. (2008), who studied another group of SMEs, agree that there are different barriers and that further work is still required in this area.
5
Tenera and Pinto (2014) have noted that the current economic crisis has increased the demand for profitable solutions that allow organisations to gain competitive advantage. For this reason, more companies search for management methodologies that enable them to improve their products’ or services’ characteristics, such as perfecting their processes, reducing their costs, improving the profitability of their invested capital, and increasing customer satisfaction.
Oduoza et al. (2008) noted how the specific SMEs researched pointed out that they did not have the resources of large organisations to invest in such continuous improvement techniques. It could, therefore, be difficult for them to implement such techniques. They also lacked the expertise to justify such investment to shareholders because they had limited or no knowledge of manufacturing improvement techniques.
A common barrier is management commitment, which Oduoza et al. (2008) also identified. If this barrier can be overcome, it may be possible to remove other barriers by the use of an effective process to support manufacturing SMEs to improve. Such support could be in the form of a framework that does not need financial support or external professionals. Boohene and Williams (2012) also assert that management commitment is crucial: management should encourage change and there should be a coalition of supporters for change. Pieterse et al.
(2012) also support this view that there is a lack of management commitment. Lodgaard et al. (2015) find that, even though CI have been known for decades, the failure rate is still high, with the major barrier being the lack of management commitment. Bengat et al. (2015) also state that resistance to change can be a result of leadership inaction, sometimes because leaders are afraid of uncertainty. Management needs to be committed and to lead the way for change.
6
1.5 Research Question
Is there a continuous improvement framework that manufacturing SMEs could implement in their business to improve business performance, that prevents barriers such as low management commitment or financial restraints?
1.6 Aim and Objectives
Aim
To develop a framework to support continuous improvement in manufacturing SMEs in order to increase business performance.
Objectives
The objectives of this research are to:
1. Critically review available continuous improvement techniques that are value adding to SMEs in order to identify the most efficient techniques used.
2. Critically review and identify barriers that prevent SMEs implementing continuous improvement techniques to improve business performance. 3. Analyse and document the role of key performance indicators,
knowledge management and quality management system (for example: ISO 9001, Balanced Score Card and Six Sigma) that could support the use of continuous improvement techniques in an SME environment. 4. Develop a conceptual framework which is user friendly and propose
appropriate continuous improvement techniques and methods available to SMEs that could support them without intervention from business professionals.
5. Collect and analyse data of SMEs awareness of continuous improvement techniques and the barriers to adopting them. Validate the developed framework in a case study environment focusing on business
7
performance and thereby encourage continuous improvement uptake by manufacturing SMEs.
1.7 Research Scope
This research is focused on developing a framework that will reduce the barriers in SMEs that have been identified in published papers (Parumasur and Govender 2013; Panagiotakopoulos 2011).
The study also concentrates on the identification of root causes for management decisions to implement change, which are discovered from use of the framework. This will result in business improvements for the SME.
The research will also be limited to SMEs that expressed an interest in participating in case study work. Chapter 7, Research Limitations contains further detail of the scope of this research project.
1.8 Research Motivation
Authors of publications are motivated to help business become more competitive in today’s pressurised business environment.
Makedos (2014) has noted that if SMEs want to be competitive, they must absorb all the know-how available to them. Working within a cluster, where they can learn from the experiences of others, can help SMEs to become innovative. Direction is needed for further research on the ways that SMEs can reduce their costs through increasing innovation within the productive process.
Oduoza et al. (2008) have researched SMEs operating in today’s highly competitive manufacturing environment. Their research into 50 SMEs revealed that SMEs were operating under pressure to minimise waste and to improve business performance. This type of pressure is often applied by directors or shareholders wanting a return on their investment. This is often set against a backdrop of companies wishing to make profits and provide professional services at low cost. Furthermore, the research conducted by Oduoza et al.
8
(2008) also found evidence that SMEs face resource constraints and may not have the necessary range of skills to research and implement CI techniques to support business improvements. Feedback from the survey indicated that the typical SME often cannot afford to ‘buy in’ professional consultants to support business improvement projects. Similarly to Oduoza et al. (2008), some companies reported poor outcomes from having engaged with business professionals. Finally, the research clearly demonstrated that some SMEs were not convinced of the potential benefits from the investment required to employ process improvement consultants.
Since contemporary industrial systems have become highly automated and mechanised, unexpected downtimes due to failures can interrupt the integrity of production plans and cause financial losses. It is therefore important to increase equipment and labour productivity in order to survive and compete in global markets (Erdem et al. 2003). One of these systems most significant challenges is to improve productivity without increasing capital spending (Labanowski, 1997).
It has often been said that because what gets measured gets attention, it is critical that measurements are carefully selected. Furthermore, having too many objectives can dilute focus, so it is wise to use measures that are quantifiable (Ellig, 2011).
There are numerous problems that modern society faces when seeking to secure sustainable development. Among the important issues is reducing the use of raw materials and consequently minimising waste and effluents. Therefore, both broader and more specialised themes should be tackled. Although new insights are emerging into this theme-related problem, many of them still deserve further intensive research. Klemes (2010), Lilja (2009), Lu and Yuan (2011) and Selg and Norkus (1992) promote waste reduction of raw material by making more efficient use of them.
Other pressures may come from within businesses as a result of the various problems and inefficiencies that can affect business performance. Some businesses may not even be aware of these problems. SMEs have constrained
9
resources compared with larger businesses, which can create barriers such as financial restraints and a lack of management commitment (Brice, 1989).
1.9 Resolving Problems and Inefficiencies
Business operators need certain skills to solve problems and permanently remove inefficiencies. This study will refer to those trained in these skills as business professionals. Authors state in their research that improvement programmes are often limited (Erdem et al. 2003), and that the success of a business will depend on improving key business processes (Jones, 1994). Productivity can be described as the relationship between inputs and outputs. Efficiency is then concerned with comparing the observed and optimal values of a producer’s inputs and outputs (Rouse et al., 2011). Problem solving is an important issue to overcome: information is required in order to overcome problems, and the problem needs to be presented as a series of facts. Providing the problem solver with good information is integral to finding effective solutions (Condell et al., 2010).
Continuous improvement information is available to SMEs (Juran and Gryna, 1985; Brice, 1989; Oakland, 2000; Murdoch, 1979; McQuater et al., 1995; Ho and Fung, 1994). However Oduoza et al. (2008), initial enquiries for this study in the Midlands, UK, indicated that due to the nature of SMEs, operators are apparently unaware of where to obtain such information. Universities, colleges and other institutions offer courses in a range of disciplines that address business improvement.
Interest in finding means of sustainable improvement has increased because of the recent recession. Managers all over the world are trying various improvement concepts, with mixed results. One likely reason for this is the commitment to improve an SME. Additional research is required (Waal, 2012).
To support the aim of this research project, it is important to have a structure that progress can then be measured against.
10
1.10 Thesis Structure
This research project begins with the challenges currently being faced in a busy competitive global market. The publications on these challenges will be reviewed to support an assessment of the problems and reasons why many businesses do not implement what they say. This research will develop a solution that will finally begin to bridge the gap of uptake to help businesses implement CI techniques and reduce business waste. To achieve the aim and objectives of this research, the following structure is used.
Chapter 1 introduces the importance of the research. It explains the pressures that businesses are under to perform and to improve. The aim, objectives, boundaries and availability of current knowledge are discussed.
Chapter 2 contains a comprehensive critical international literature review, to identify what research has been conducted into continuous improvement to show the current level of application and the problems with uptake.
Chapter 3 explains the method of research implemented in this project. The research approach highlights the importance of precise research planning and a well-structured programme employing well-established methods: literature review, postal questionnaires, surveys, interviews and case studies.
Chapter 4 develops the framework based on extensive research into past studies detailed in the literature review chapter. It considers existing process models and the problems encountered by the end users. Most importantly, this chapter identifies what needs to be considered in the development of the framework for it to work effectively for the end user.
Chapter 5 determines if the framework developed in Chapter 4 would actually work in a business environment. Obtaining the views of people in the case study companies with no prior experience enables the identification of improvements for management implementation.
Chapter 6 validates the framework using two case study businesses and also conducts a detailed analysis of each question from the questionnaire used in
11
the case study to accurately assess the performance of the framework, in order to ensure that the problems of past users will not be encountered again.
Chapter 7 defines any further work required and brings together the conclusions of this research project, which it is hoped will further encourage the uptake of CI techniques to reduce business wastage.
1.11 Summary
Manufacturing SMEs are constantly under extensive business environment pressure, both from shareholders wanting a return on capital invested and from customers demanding a good product at low cost. Manufacturing SMEs are faced with barriers such as lack of management commitment, financial restraints and lack of resources. Manufacturing SMEs need to face the challenge of overcoming such issues in order to remain competitive in a global market. The way forward is for manufacturing SMEs to improve their performance. This research project’s aims and objectives have been developed to create a frame to improve business performance in these SMEs. This thesis has been structured to review available literature and then progress through to the validation of a framework that actually works and can improve the business performance for manufacturing SMEs.
12
Chapter 2: Literature Review
2.1 Introduction
The introduction in Chapter 1 has identified the problems and challenges that many businesses are facing in today’s busy and highly competitive business environment. The research aim and objectives have been identified.
Chapter 2 focuses on the following thesis objectives:
Critically review available continuous improvement techniques that add value to SMEs, in order to identify the most efficient techniques used.
Critically review and identify barriers that prevent SMEs from implementing continuous improvement techniques to improve business performance.
Analyse and document the role of key performance indicators, knowledge management, communities of practice and quality management systems (for example: ISO 9001, Balanced Score Card and Six Sigma) that could support the use of continuous improvement techniques in an SME environment.
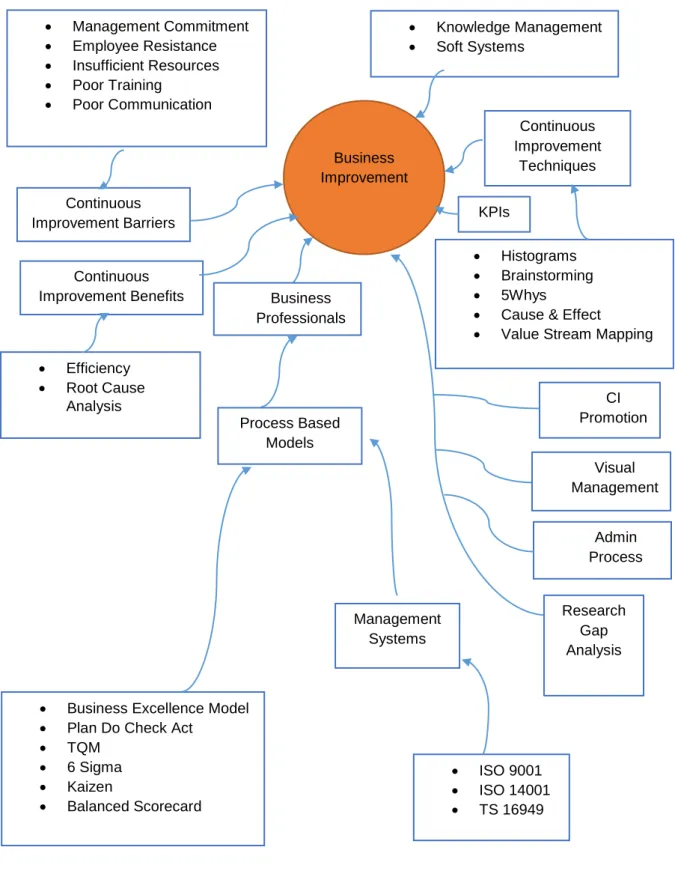
Figure 2.1 shows a mind map structure for this research project, showing all the aspects that will contribute to ensuring that this thesis achieves the objectives defined in Chapter 1. These aspects will include a review of: available CI techniques as well as barriers that prevent SMEs from implementing CI techniques; available process models; management systems; CI techniques; and methods for linking CI techniques to their use by means of the Knowledge Management, Soft Systems and Communities of Practice approaches.
13
Figure 2.1: Mind map of the literature review Business Improvement Continuous Improvement Techniques Process Based Models Continuous Improvement Barriers Management Commitment Employee Resistance Insufficient Resources Poor Training Poor Communication Knowledge Management Soft Systems
Business Excellence Model
Plan Do Check Act
TQM 6 Sigma Kaizen Balanced Scorecard Histograms Brainstorming 5Whys
Cause & Effect
Value Stream Mapping Continuous
Improvement Benefits Business
Professionals ISO 9001 ISO 14001 TS 16949 Management Systems KPIs CI Promotion Efficiency Root Cause Analysis Visual Management Admin Process Research Gap Analysis
14
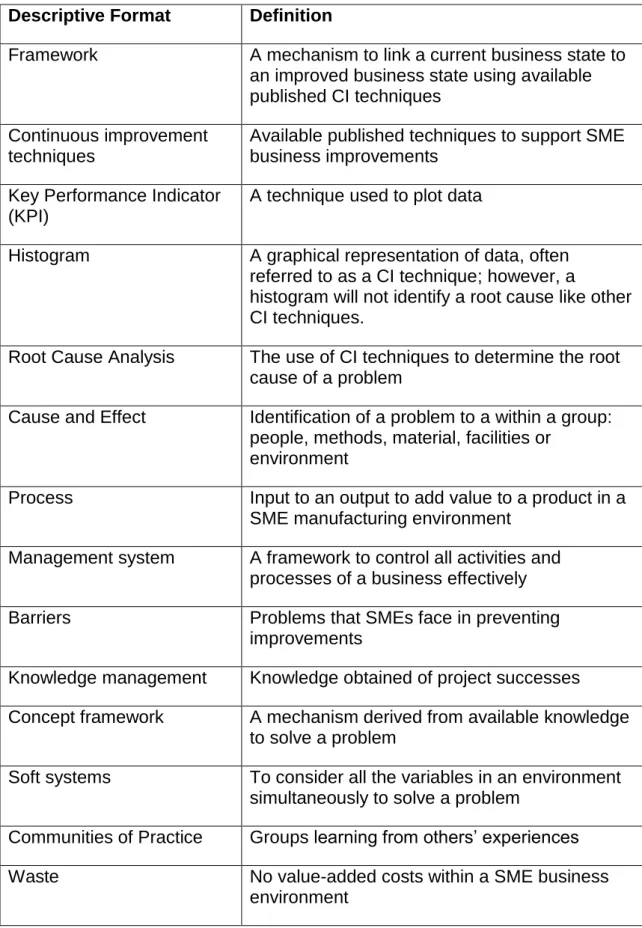
2.2 Operational Definitions
Table 2.1 below shows the operational definitions used in this research project. Table 2.1: Operational definitions in this research
Descriptive Format Definition
Framework A mechanism to link a current business state to an improved business state using available published CI techniques
Continuous improvement techniques
Available published techniques to support SME business improvements
Key Performance Indicator (KPI)
A technique used to plot data
Histogram A graphical representation of data, often referred to as a CI technique; however, a
histogram will not identify a root cause like other CI techniques.
Root Cause Analysis The use of CI techniques to determine the root cause of a problem
Cause and Effect Identification of a problem to a within a group: people, methods, material, facilities or
environment
Process Input to an output to add value to a product in a SME manufacturing environment
Management system A framework to control all activities and processes of a business effectively
Barriers Problems that SMEs face in preventing
improvements
Knowledge management Knowledge obtained of project successes Concept framework A mechanism derived from available knowledge
to solve a problem
Soft systems To consider all the variables in an environment simultaneously to solve a problem
Communities of Practice Groups learning from others’ experiences
Waste No value-added costs within a SME business
15
2.3 Continuous Improvement Techniques Planned for Use in
the Framework
The literature review revealed the following CI techniques, which are considered for use in the framework that will be developed in this thesis.
2.3.1 Histograms
Authors do not state that a histogram is a CI technique, neither do they state that it can identify the root cause of a problem; it is, however, described as a graphical representation of data (Juran and Gryna 1982).
For Juran and Gryna (1982); Cha and Sirhari (200); Arndt (1992); MacQuarter
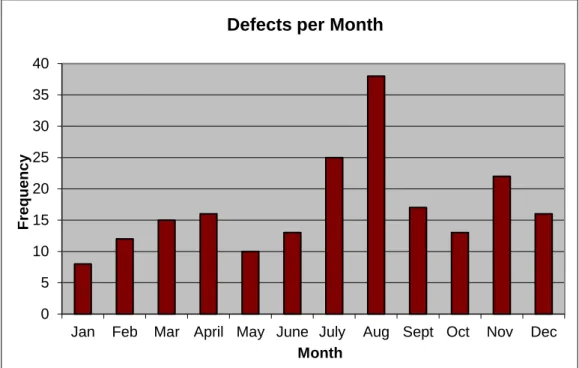
et al. (1995) and Cha and Srihari (2002), a histogram is used to show a distribution over a series on counted values. Histograms have a bar for each type of category that has a value. It is important to realise that quantities are actually represented by the area of the histogram. Normally, a histogram should have not less than six and not more than 15 bars. When there are more than 15 bars, they should be grouped. Figure 2.2 shows an example of a histogram with monthly data that have been collected to identify defects.
Juran and Gryna (1982) state that a histogram is easy to use for people who have not used one before and it requires no cost to implement. It requires only time to plan what is to be measured and a commitment to continually recording data. A histogram usefully provides a visual interpretation of data where variation can easily be seen. It also provides an instant graphical representation and helps to make an impact on management so that they will provide support for improvement projects.
16
Figure 2.2: Histogram showing defect data collected (Juran and Gryna,1982)
2.3.2 Brainstorming
According to Sealer and Waller (1996), Labanowski (1997); and Oakland (2000), brainstorming is a way of obtaining as much information as possible so that plans and actions are based on the best available knowledge. The rules are designed simply to encourage a contribution from everyone when there is a problem or an opportunity for improvement. Brainstorming is a low cost CI technique that requires some basic training for people who have not used this CI technique before. Brainstorming supports people in developing ideas to find the reasons for the problems encountered on a group basis. This approach saves valuable investigation time when attempting to prevent problems.
The rules are listed below, based on the suggestions of Sealer and Waller (1996), Labanowski (1997); and Oakland (2000).
0 5 10 15 20 25 30 35 40
Jan Feb Mar April May June July Aug Sept Oct Nov Dec
F
requ
ency
Month
17
Organise a session:
The individual with the problem or opportunity must start the ball rolling.
Everyone who can contribute should be enrolled or join in.
There should be agreement on who is the leader.
There should be support for the leader’s attempts to keep the session within these rules.
Each team member is given a pack of Post-it notes to record each idea/issue they have (one per Post-it note).
Focus strictly on the subject under discussion, having agreed the subject.
Encourage everyone to have their say but try to stick to the facts: Do not analyse what is said.
Keep the ideas flowing
Do not let prejudice or opinion interfere.
Respect everybody’s experience and expertise.
Feedback to the team:
Team members to individually provide feedback by describing each of their ideas.
Team members to place each of their Post-it notes onto either a ‘cause and effect diagram’ or a flip chart.
When a cause and effect chart is not used, the activity leader should facilitate grouping the ideas together.
18
Team members should individually select their first, second and third choice ideas from the final, grouped Post-it notes.
Team members should individually score five points for the first-choice idea, three points for the second and one point for the third. Team members should collectively total the points for each and
create a priority list or table showing the highest scoring idea first, the next highest second, etc.
2.3.3 Cause and Effect
According to Juran and Gryna (1982); Arndt (1992); McQuarter et al. (1995); Turner (1997) and Stefanovic (2014), the starting point is a list of the possible causes and effects, usually the result of brainstorming a problem. The stages are listed below. The cause and effect approach supports people in a group to identify the solution to a problem by identifying the action that can be taken to prevent the problem from reoccurring again, thereby saving time and money.
First, draw a diagram showing the effect and the main groups of causes. Second, write each item in the list of possible causes under one or more of the headings:
People will include anything affecting individuals, such as training, attitudes, abilities and organisation.
Methods include policies, standards, procedures, instructions, etc., or the lack of them.
Materials include any aspect of product components and consumables, such as specifications and conformance with specification.
Facilities describe the hardware of the workplace, such as tools, jigs, fixtures, equipment, machines and buildings.
Environment is for matters outside the organisation’s direct control, such
19
Juran and Gryna (1982); Arndt (1992); McQuarter et al. (1995); Turner (1997) and Stefanovic (2014) support all of the key points above.
When there are a large number of possible causes in any group, subgroups can be introduced and possible causes written under them. From the list of possible causes, the reason is written on a Post-It note (one per note) as to why a group or subgroup is a source of the problem.
First, the immediate cause is written, then the deeper causes. Sometimes this means re-phrasing the words of the original list. If so, confirmation is received that the re-phrased words are true.
Figure 2.3 shows a cause-and-effect diagram, which focuses attention on the deepest causes that should be the target for improvement action. Although priorities can be allocated using other methods, the greatest benefit will be obtained when all possible causes are eliminated.
Figure 2.3: Cause-and-effect diagram (Juran and Gryna, 1982)
2.3.4 The Five Whys
According to Benjamin (2009); Imai (1986); Murugaiah et al. (2009)and Adams (2008), the ‘Five Whys’ method can help the development of a clear definition of a problem; it should be used early on in an investigation and should concentrate on the symptoms (effects) rather than on the investigation of the causes. The Five Whys is a low-cost CI technique, which requires only basic training. It is a
20
direct approach for discovering the true root cause of a problem; it is a quick CI technique to use but will deliver results instantly.
One of the easiest ways to start an investigation is to ask questions that start with the words: What? When? Where? Why? Who? How? and How Many?
As much detail as possible is added to each word. Each word is used in front of as many questions as necessary. Some examples of questions are:
What is the perceived problem?
What is the specification?
What are the measured values?
What are the customer experiences?
When does the problem occur?
When was the problem highlighted?
Where does the problem occur?
Why does the problem occur?
Who reported the problem?
Who carries out measurements?
How often do we experience failures?
Benjamin (2009); Imai (1986); Murugaiah et al. (2009) and Adams (2008) all support the above bullet points.
The Five Whys concept is that the answers to a series of five ‘Why’ questions and one ‘How’ question will lead to more questions. When practicable, the questions and answers are illustrated with sketches. The whole process should build up a comprehensive picture of the problem.
21
To enable CI techniques to gain management commitment, it is important for CI techniques to have benefits. This information needs to be researched in order to determine the benefits.
2.4 Benefits of Continuous Improvement Techniques
Authors do not quantify savings or specifically state the benefits of each CI technique; however, they do state the benefit that can be obtained from using CI techniques. Arvelo (1995) states that these techniques have been around since the 1950s. Such techniques can bring about incremental improvements for a business to help support them in becoming more efficient and improve business performance. Arndt (1992) points out that these practical techniques can use historical data to solve problems and thereby improve business performance. Chester (1994) researched CI techniques and found that businesses do not just use CI techniques to improve cars and televisions, they can be used to improve any business activity and product. Hall (1993) notes that CI techniques form a systematic method that uses little capital to improve business performance. Labanowski (1997) reported that a fabrication company used CI techniques to deliver a reduction in complexity to manufacturing process reduced cycle time and inventory and increased serviceability. Kram et al. (2015) researched a business that had serious problems with deliveries that were caused by various factors using a Kaizen approach, which includes CI techniques on how improvements can be made. Schiele and McCue (2011) promote CI techniques to make improvements in business. For example, they can be used to increase customer satisfaction, add value added savings and improve teamwork. Irajpour et al. (2014) also promoted this approach for making improvements.
Businesses that do not implement CI techniques do not achieve the benefits that businesses gain from implementing CI techniques. Arvelo (1995) states that continuous improvement is a technique which identifies value-added and non-value added activities. It improves a business by maximising efficiency. Cayer (2001) notes that choosing the correct type of CI technique can help to solve the jigsaw puzzle; each piece within the puzzle has its appropriate place
22
somewhere in the overall puzzle. Carpinetti et al. (2003) point out that that CI is aimed at continually satisfying customer expectations regarding quality, delivery and service. For Holtskog (2013), continuous improvement is long-term management driven, which, if included in an improvement strategy, can help to sustain competitiveness in global markets. Jonsdottir (2014) has researched businesses that use the CI process to maintain customer requirements and satisfaction. For companies that are interested in CI, this can strengthen their position in regard to customers and competition. It is interesting to note that most CI improvement projects do not requirement financial investments, but labour and time only.
Barriers that affect the use of CI techniques are now assessed. It is important to understand these so that the issues encountered in the past around not using CI techniques can be prevented.
2.5 Barriers to Continuous Improvement
This section examines the issues that manufacturing SMEs face with regard to barriers when trying to improve their business. For any business to be totally successful, these problems will have to be resolved. The aim of this section is to ensure that the framework being developed in this thesis will not fall victim to such reported barriers.
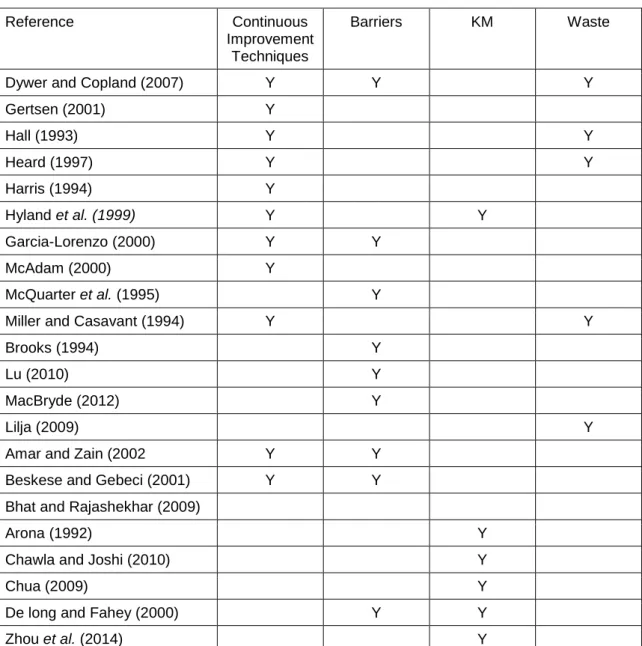
Table 2.2 shows how publications over the last 30 years have looked at the process of continuous improvement within businesses, identifying barriers of uptake, how knowledge management can help and the identification of business waste.
23
Table 2.2: Authors who have identified CI techniques, barriers, knowledge management and waste
Reference Continuous
Improvement Techniques
Barriers KM Waste
Dywer and Copland (2007) Y Y Y
Gertsen (2001) Y Hall (1993) Y Y Heard (1997) Y Y Harris (1994) Y Hyland et al. (1999) Y Y Garcia-Lorenzo (2000) Y Y McAdam (2000) Y McQuarter et al. (1995) Y
Miller and Casavant (1994) Y Y
Brooks (1994) Y
Lu (2010) Y
MacBryde (2012) Y
Lilja (2009) Y
Amar and Zain (2002 Y Y
Beskese and Gebeci (2001) Y Y
Bhat and Rajashekhar (2009)
Arona (1992) Y
Chawla and Joshi (2010) Y
Chua (2009) Y
De long and Fahey (2000) Y Y
Zhou et al. (2014) Y
Bice (1986), who has done research examining continuous improvement methods, informs us that company-wide failure prevention must begin with management controls funding and policy. This is where the first major obstacle occurs because convincing the management to fully commit to a preventive-driven programme requires management understanding, conviction, commitment, discipline, willingness, development, establishment, exercise and investment. The absence of these will create barriers.
Dwyer and Copeland (2007) suggest that one particular major automotive manufacturer supplier is over-reliant on continuous improvement tools and that
24
it does not fully understand them. Moreover, the company has little idea what continuous improvement really means. Dwyer and Copeland (2007) see much waste being generated within the processes and money being poured down the drain every week. The impression is that many suppliers are frightened to really get to grips with the real meaning of continuous improvement within their business.
Amar and Zain (2002) have identified how a complete lack of management commitment, weak quality management, an inability to change, a lack of accuracy in quality planning, the absence of training and insufficient resources can prevent improvement projects in a business environment.
Bhat and Rajashekhar (2009) have studied barriers to TQM in Indian industries that want to improve. They identified the following barriers: culture and employees, infrastructure, management and organisational issues.
Arvelo’s (1995) research on continuous improvement found that it is a technique that helps eliminate non-value added activities; however, this cannot be possible without either management involvement or commitment or without the use of valuable resources.
McQuarter et al. (1995) have identified the following pitfalls that can cause difficulties when using quality tools: poorly designed training, being unable to apply what has been learnt, inappropriate use of tools, resistance to using tools, a failure to lead by example, poor measurement and poor communication.
For Gatchallan (1997), the following barriers can halt a TQM project and prevent success: resistance by top management, erratic quality programme implementation, jolting but unsustainable enthusiasm for TQM, inadequate empowerment, poor communication and lack of teamwork.
Harrington (1998) has conducted research into performance improvement within a business environment. He found that the manager’s role has to change: the major roadblocks that are put in the way of the employees must be removed before their full potential can be unleashed. Harrington (1998) identifies roadblocks that cause barriers as a lack of employee trust, a lack of delegation, a lack of management credibility, untimely decision making, a lack of training,
25
misdirected measurement systems, poor communication, a lack of employee loyalty, fear of risk taking and a lack of continuity. The manager must support the process of improvement to avoid such problems.
Kruger (2001) has studied the work conducted by Deming, stating that it is important to drive out fear that many workers have of asking questions of their supervisors even when they do not understand their task properly and do not know what is right from wrong. They need to break down the barriers between staff, most importantly, the barriers that hinder the hourly paid workers.
Oakland and Tanner (2007) have identified some common barriers, which include a constant changing of departments, a lack of communication, resistance to change and little management involvement. In their research, they found that companies that encountered these problems often engage external consultants to do the work for them.
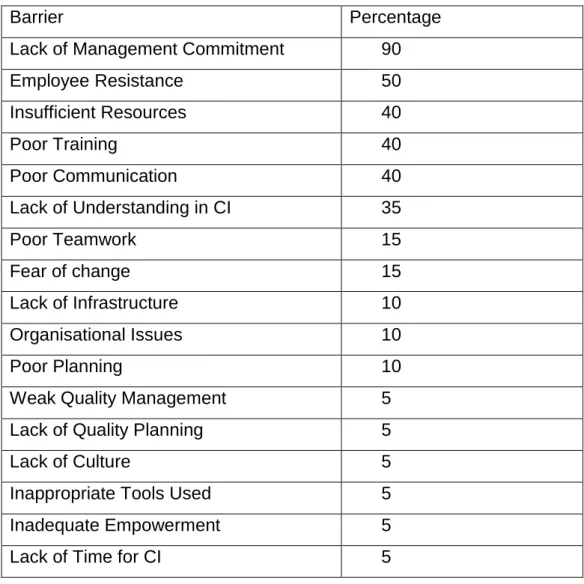
Table 2.3 shows the percentages reported by academics of the most common reasons that cause problems for manufacturing SMEs when they want to improve their business.
26
Table 2.3: Barriers to SME progress identified by academics by percentage
Barrier Percentage
Lack of Management Commitment 90
Employee Resistance 50 Insufficient Resources 40 Poor Training 40 Poor Communication 40 Lack of Understanding in CI 35 Poor Teamwork 15 Fear of change 15 Lack of Infrastructure 10 Organisational Issues 10 Poor Planning 10
Weak Quality Management 5
Lack of Quality Planning 5
Lack of Culture 5
Inappropriate Tools Used 5
Inadequate Empowerment 5
Lack of Time for CI 5
CI techniques are used in a business environment to improve the performance of a process within that business; it is, however, important to understand the definition of what a process is.
2.6 The Process – A Definition
A process is the transformation of a set of inputs. These inputs can include materials, actions, methods and operations. The output is the result of the process of converting the input. Processes can be controlled by gathering and using data in the form of a KPI that can be graphically shown by the use of a histogram. Some processes have a high process variation, while others have a
27
low process variation. A possible framework can link the present state of a process using various CI techniques to make improvement to the process.
Murdoch (1979) has provided a technical understanding of continuous improvement techniques that date back to the 1950s. When continuous improvement techniques are applied, waste is minimised. It is necessary to define, monitor and control the inputs to the process as these can be the outputs of an earlier process. The main objective of the technique is to bring the process under control and prevent waste in terms of not achieving customer specifications (Oakland, 2000).
Continuous improvement techniques have no value in a process until they are used. In order to identify those continuous improvement techniques that may be useful, the applications must first be recognised and understood. Continuous improvement techniques can be used to solve problems in a process. These techniques need to be used by everyone in their normal working environment, not only by highly trained professionals. Straker (1995) highlights that continuous improvement techniques can be used for process improvement and can help to reduce process waste.
This research has been seeking to determine if there is one CI technique that can improve business performance. Therefore, various possible concepts were researched.
2.7 Value Stream Mapping – An Initial Possible Concept for
Improvement
VSM is a value-based concept that was initially considered as a basis for the framework; however, it has seen limited published work by academics since 1997, one such work being by Hines and Rich (1997) ‘Making use of the seven VSM tools’ is the only real paper of any substance in the field of VSM, and even this is viewed by its authors as an ill-defined milestone. This point of view is also supported in a paper by Lasa et al. (2008).
28
VSM is the mapping of inter-company and intra-company value adding processes that can make the final product more valuable to the end consumer. However, the tools identified in Hines and Rich (1997) are viewed as creations of an answer rather than part of the jigsaw. They do not fit well with the requirements of companies.
According to Hines and Rich (1997), the tools used to identify and eliminate waste have been identified by VSM, but they are quite difficult to understand. The systematic attack on waste is also an assault on the factors underlying poor quality and fundamental management problems. Three areas have been identified for review: non-value adding, necessary but non-value adding, and value adding. VSM identifies seven types of waste: overproduction, waiting, transport, inappropriate processing, unnecessary inventory, unnecessary motion and defects (Hines and Rich 1997).
The seven tools are presented as Seven Wastes in Table 2.4. In addition, the overall combined value structure will be useful and will also be combined, as shown in the left hand column. In order to make improvements in the supply chain, it is suggested here that at least an outline understanding of the particular wastes to be reduced must be gained before any mapping activity takes place. In the work of Hines and Rich (1997), any of the seven mapping tools are already known although at least two are new, while others will be unfamiliar to a wide range of researchers and practitioners.
Forms of waste are also identified as defined in the Toyota Production System (TPS), a large, mass-production environment that employs professional engineers to reduce waste. This research is involved in SMEs, where often there is also jobbing and small-batch activities, and professional engineers are not employed (Hines and Rich, 1997).
29
Table2.4: The Seven Stream mapping tools, Hines and Rich (1997)
Waste/Structure Process activity mapping Supply chain response matrix Production variety funnel Quality filter mapping Demand amplification mapping Decision point analysis Physical structure Overproduction L M L M M Waiting H H L M M Transport H Inappropriate processing H M L L Unnecessary inventory H L Defects L H Overall structure L L M L H M H
Notes: H = High correlation and usefulness, M = Medium correlation and usefulness, L = Low correlation and usefulness.
Hines and Rich (1997) explain the above principles; however, it is quite difficult for those who have not been exposed to, or lack expertise with, VSM to understand these principles and the ways in which they work in the business world. McKellen (2000) explains the principles in a shortened version in contrast to the approach of Hines and Rich (1997) and Lim et al. (1999), and Gibbons (2009) supports this approach.
The research by Hines and Rich (1997) aims to remove waste from within companies; however, it does not document an effective framework that could be implemented in an SME to increase business performance. Indeed, by the author’s own admission, VSM is ill-defined.
It may be that other improvement techniques are required in order to help SMEs minimise waste. The tools and techniques taken from the Value Stream Mapping approach can support sustainability, particularly when changing from a craft manufacturing to a mass manufacturing process (Vinodh, Arvind and Somanaathan,2011).
This research now focuses on authors who have promoted the use of CI techniques. This will identify possible benefits and potential CI techniques and also support methods that could help with the development of the framework.
30
2.8 Literature on Continuous Improvement
This section reviews authors who promote CI techniques that can help support businesses to improve their business. Key elements in the following sub-sections in the process are reviewed to understand more about CI and help the concept development of the framework.
Table 2.5 shows authors over the last 30 years who have promoted commonly available CI techniques that can be applied to support the business improvement: brainstorming, histograms, the five whys, cause and effect, control plans and SPC.
Table 2.5: Authors who promote CI techniques to help businesses improve Reference Brainstorming Histogram 5 Whys Cause &
Effect
Control
Charts SPC
Cha and Sirhari
(2002) Y
Seaker and
Waller (1996) Y
Juran and Gryna
(1982) Y Y Adams (2008) Y Arndt (1992) Y Y Y Labanowski (1997) Y Y McQuarter et al. (1995) Y Y Y Oakland (2000) Y Y Y Y Y Imai (1986) Y Y Y
Cha and Srihari
(2000) Y Seaker and Waller (1996) Y Stefanovic et al. 2014) Y Turner (1997) Y Murugaiah et al. (2009) Y