Supplement: A semi-supervised Bayesian approach for
simultaneous protein sub-cellular localisation
assignment and novelty detection
Oliver M. Crook∗ 1,2, Aikaterini Geladaki1,3, Daniel J.H. Nightingale1, Owen Vennard1, Kathryn
S. Lilley† 1, Laurent Gatto‡4, and Paul D.W. Kirk 2,5
1Cambridge Centre for Proteomics, Department of Biochemistry, University of Cambridge, Cambridge, UK 2MRC Biostatistics Unit, School of Clinical Medicine, University of Cambridge, Cambridge, UK
3Department of Genetics, Universtiy of Cambridge, Cambridge, UK 4de Duve Institute, UCLouvain, Avenue Hippocrate 75, 1200 Brussels, Belgium
5Cambridge Institute of Therapeutic Immunology & Infectious Disease (CITIID), Jerey Cheah Biomedical Centre,
Cambridge Biomedical Campus, University of Cambridge, UK.
October 27, 2020
Appendix
mESC chromatin enrichment validation
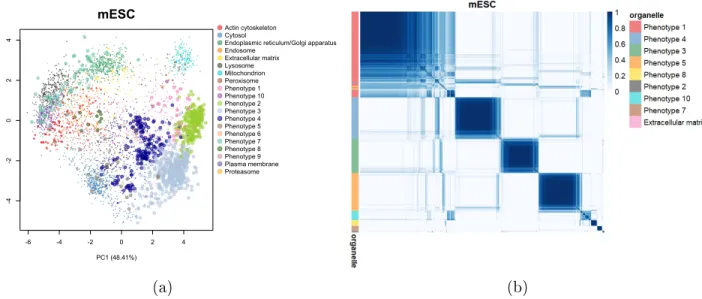
For the mESC dataset, Novelty TAGM reveals 8new putative phenotypes. Novelty TAGM
recovers the masked annotations with phenotype 2 having the enriched terms associated
with chromatin, such as chromatin and chromosome (p <10−80). Phenotype 3 corresponds
to a separate nuclear substructure with enrichment for the terms nucleolus (p <10−60) and
nuclear body (p < 10−30). Thus, in the mESC dataset Novelty TAGM conrms the
chro-matin enrichment preparation designed to separate chrochro-matin and non-chrochro-matin associated
nuclear proteins [52]. In addition, phenotype 4 demonstrates enrichment for the ribosome
annotation (p < 10−35). Phenotype 1 is enriched for centrosome and microtubule
annota-tions (p < 10−15), though observing the PSM in Fig1 we can see there is much uncertainty
in this phenotype. This uncertainty quantication can then be used as a basis for justifying additional expert annotation.
-6 -4 -2 0 2 4 -4 -2 0 2 4 mESC PC1 (48.41%) PC2 (23.85%) Actin cytoskeleton Cytosol
Endoplasmic reticulum/Golgi apparatus Endosome Extracellular matrix Lysosome Mitochondrion Peroxisome Phenotype 1 Phenotype 10 Phenotype 2 Phenotype 3 Phenotype 4 Phenotype 5 Phenotype 6 Phenotype 7 Phenotype 8 Phenotype 9 Plasma membrane Proteasome (a) (b)
Figure 1: (a) PCA plot of the hyperLOPIT mESC dataset. Points are scaled according to the discovery probability. (b) Heatmaps of the posterior similarity matrix derived from mESC data demonstrating the uncertainty in the clustering structure of the data. We have only plotted the proteins which have greater than 0.99 probability of belonging to a new
phenotype and probability of being an outlier less than0.95for the mESC dataset to reduce
the number of visualised proteins.
Uncovering additional annotations in broblast cells
HCMV-infected broblast cells
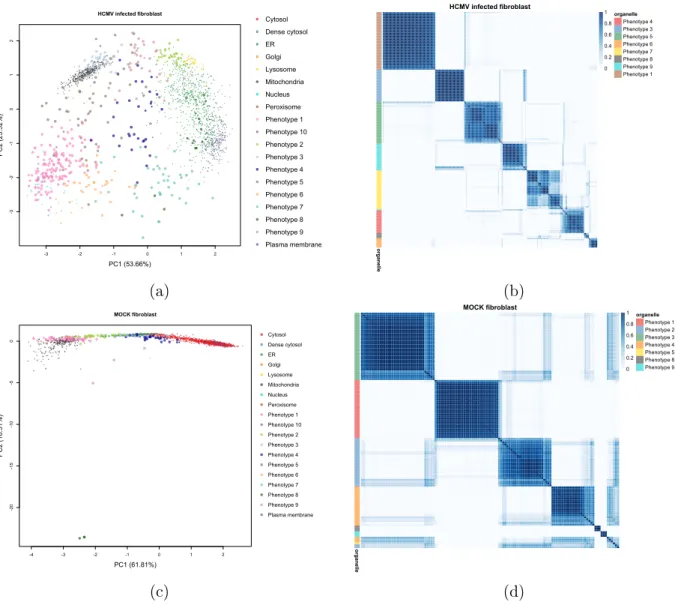
We apply Novelty TAGM to the dataset corresponding to the HCMV-infected broblast
cells 24 hours post infection (hpi) [7], and discover9putative additional phenotypes
(demon-strated in Fig2). Phenotype 2 contains a singleton protein and phenotypes 4,6,7,8 and 9
are not signicantly enriched for any annotations. However, phenotype 3 is enriched for
the mitochondrial membrane and mitochondrial envelope annotations (p <10−4); this is an
addition to the already annotated mitochondrial class, indicating sub-mitochondrial
resolu-tion. Phenotype 1 is a mixed ribosomal/nuclear cluster with enrichment for nucleoplasm
(p <10−5) and the small ribosomal subunit (p <10−4), which is distinct from phenotype 5
which is enriched for the large ribosomal subunit (p < 10−10). This demonstrates unbiased
separation of the two ribosomal subunits, which was overlooked in the original analysis [7].
Fibroblast cells without infection
Novelty TAGM reveals 7 putative phenotypes in the control broblast dataset [7].
Pheno-types2,4,5,6and9have no signicantly enriched Gene Ontology terms (thresholdp= 0.01).
However, we observe that phenotype3is enriched with the large ribosomal subunit with
sig-nicance at level p <10−7. Phenotype 1represents a mixed peroxisome (p < 10−2) and
mi-tochondrion cluster (p <10−2), an unsurprising result since these organelles possess similar
biochemical properties and therefore similar proles during density gradient
relevant phenotypes discovered between the two broblast datasets could be down to the
diering levels of structure between the two datasets. Indeed, it is evident from Fig2 that
we see diering levels of clustering structure in these datasets.
Additional organellar map datasets
Mouse primary neurons
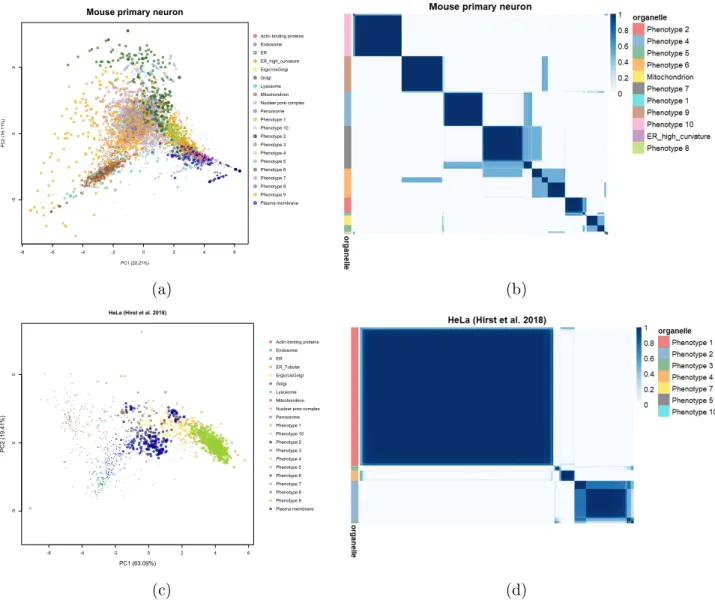
The mouse primary neuron dataset reveals 10 phenotypes after we apply Novelty TAGM.
However, 8of these phenotypes have no enriched GO annotations. This is likely a
manifes-tation of the dispersed nature of this dataset, where the variability is generated by technical artefacts rather than biological signal. Despite this, Novelty TAGM is able to detect two
relevant phenotypes: the rst phenotype is enriched for nucleolus (p < 0.01); the second for
chromosome (p < 0.01). This suggests additional annotations for this dataset.
HeLa cells (Hirst et. al 2018)
The HeLa dataset of [34], which we refer to as HeLa Hirst, reveals7phenotypes with at least
1 protein with discovery probability greater than 0.95. However, three of these phenotypes
represent singleton proteins. Phenotype1reveals mixed cytosol/ribosomal annotations with
the terms cytosolic ribosome (p < 10−30) and cytosolic part (p < 10−25) signicantly
over-represented. There are no further phenotypes with enriched annotations (threshold p =
0.01), except phenotype 2 which represents a mixed extracellular structure/cytosol cluster.
For example, the terms extracellular organelle (p < 10−13) and cytosol (p < 10−10) are
over-represented.
Handling label switching
Bayesian inference in mixture models suers from an identiability issue known as label switching - a phenomenon where the allocation labels can ip between runs of the algorithm
[58, 66]. This occurs because of the symmetry of the likelihood function under permutations
of these labels. We note that this only occurs in unsupervised or semi-supervised mixture models. This makes inference of the parameters in mixture models challenging. In our setting the labels for the known components do not switch, but for the new phenotypes label switching must occur. One standard approach to circumvent this issue is to form the so-called
posterior similarity matrix (PSM) [22]. The PSM is anN×N matrix where the(i, j)thentry
is the posterior probability that proteiniand protein j reside in the same component. More
precisely, if we let S denote the PSM and T denote the number of Monte-Carlo iterations
then Sij =P(zi =zj|X,θ,π, κ, ,M, V)≈ 1 T T X t=1 I(zi(t)=zj(t)), (1)
where Idenotes the indicator function. The PSM is clearly invariant to label switching and
-3 -2 -1 0 1 2 -3 -2 -1 0 1 2 HCMV infected fibroblast PC1 (53.66%) PC2 (23.52%) Cytosol Dense cytosol ER Golgi Lysosome Mitochondria Nucleus Peroxisome Phenotype 1 Phenotype 10 Phenotype 2 Phenotype 3 Phenotype 4 Phenotype 5 Phenotype 6 Phenotype 7 Phenotype 8 Phenotype 9 Plasma membrane (a) HCMV infected fibroblast organelle organelle Phenotype 4 Phenotype 3 Phenotype 5 Phenotype 6 Phenotype 7 Phenotype 8 Phenotype 9 Phenotype 1 0 0.2 0.4 0.6 0.8 1 (b) -4 -3 -2 -1 0 1 2 -20 -15 -10 -5 0 MOCK fibroblast PC1 (61.81%) PC2 (18.31%) Cytosol Dense cytosol ER Golgi Lysosome Mitochondria Nucleus Peroxisome Phenotype 1 Phenotype 10 Phenotype 2 Phenotype 3 Phenotype 4 Phenotype 5 Phenotype 6 Phenotype 7 Phenotype 8 Phenotype 9 Plasma membrane (c) MOCK fibroblast organelle organelle Phenotype 1 Phenotype 2 Phenotype 3 Phenotype 4 Phenotype 5 Phenotype 8 Phenotype 9 0 0.2 0.4 0.6 0.8 1 (d)
Figure 2: (a, c) PCA plots of the HCMV-infected broblast data 24 hpi and the mock broblast data 24 hpi. The points are coloured according to the organelle or proposed new phenotype and are scaled according to the discovery probability. (b, d) Heatmaps of the posterior similarity matrix derived from the infected broblast data and mock broblast data demonstrating the uncertainty in the clustering structure of the data. We have only plotted the proteins which have greater than 0.99 probability of belonging to a new phenotype and probability of being an outlier less than 0.95.
-8 -6 -4 -2 0 2 4 6
-5
0
5
Mouse primary neuron
PC1 (20.21%)
PC2 (16.11%)
Actin binding proteins Endosome ER ER_high_curvature Ergic/cisGolgi Golgi Lysosome Mitochondrion Nuclear pore complex Peroxisome Phenotype 1 Phenotype 10 Phenotype 2 Phenotype 3 Phenotype 4 Phenotype 5 Phenotype 6 Phenotype 7 Phenotype 8 Phenotype 9 Plasma membrane (a) (b) -6 -4 -2 0 2 4 6 -5 0 5
HeLa (Hirst et al. 2018)
PC1 (63.09%)
PC2 (19.41%)
Actin binding proteins Endosome ER ER_Tubular Ergic/cisGolgi Golgi Lysosome Mitochondrion Nuclear pore complex Peroxisome Phenotype 1 Phenotype 10 Phenotype 2 Phenotype 3 Phenotype 4 Phenotype 5 Phenotype 6 Phenotype 7 Phenotype 8 Phenotype 9 Plasma membrane (c) (d)
Figure 3: (a),(c) PCA plots of the mouse primary neuron data and HeLa Hirst data. The pointers are scaled according to their discovery probability. (b),(d) Heatmaps of the mouse neuron data and HeLa Hirst data. Only the proteins whose discovery probability is greater
than 0.99and outlier probability less than0.95(10−2 for the mouse primary neuron dataset
to reduce the number of visualised proteins) are shown. The heatmaps demonstrate the uncertainty in the clustering structure present in the data.
Summarising posterior similarity matrices
To summarise the PSMs, we take the approach proposed by [22]. They proposed the adjusted
Rand index (AR) [38, 56], a measure of cluster similarity, as a utility function and then we
wish to nd the allocation vector zˆthat maximises the expected adjusted Rand index with
respect to the true clustering z. Formally, we write
ˆ
z= arg max
z∗ E[AR(z
∗
, z)|X,θ,π, κ, ,M, V], (2)
which is known as the Posterior Expected Adjusted Rand index (PEAR). One obvious pitfall
is that this quantity depends on the unknown true clustering z. However, this can be
approximated from the MCMC samples:
P EAR ≈ 1 T T X t=1 AR(z∗, z(t)). (3)
The space of all possible clustering over which to maximise is infeasibly large to explore. Thus
we take an approach taken in [22] to propose candidate clusterings over which to maximise.
Using hierarchical clustering with distance 1 −Sij, the PEAR criterion is computed for
clusterings at every level of the hierarchy. The optimal clustering zˆis the allocation vector
which maximises the PEAR.
Details of MCMC
The MCMC algorithm used in [14] is insucient to handle inference of unknown phenotypes.
As in [14], a collapsed Gibbs sampler approach is used, but a number of modications are
made. Firstly, to accelerate convergence of the algorithm half the proteins are initial allocated randomly amongst the new phenotypes. Secondly, the parameters for the new phenotypes
are proposed from the prior. Throughout the same default prior choices are used as in [14].
Further details of endosomal proteins
For completeness, this appendix provides additional details and important literature on the proteins discussed in the main text.
First, P20339 (Rab5a) and P61020 (Rab5b) are two of the three isoforms of Rab5, a small GTPase which belongs to the Ras protein superfamily and is considered a master or-ganiser of the endocytic system. Rab5a and Rab5b share a high level of amino acid sequence identity (approximately 85%) and are ubiquitously expressed in the mouse and human. In-dependently, these isoforms act as key regulators of clathrin-mediated endocytosis and early endosome dynamics by controlling the following processes in vivo and in vitro: (a) clathrin-coated vesicle formation at the cell surface; (b) endocytosed vesicle transport from the plasma membrane towards, and fusion with, early endosomes; (c) early endosome biogenesis and maintenance; (d) molecular motor-driven, microtubule-dependent early endosome motility along the endocytic route; (e) early endosome docking/tethering and homotypic fusion, and
Rab5a and Rab5b play crucial roles in the internalisation and recycling/degradation of cell surface receptors such as EGFR (epidermal growth factor receptor), TfR (transferrin re-ceptor) and several GPCRs (G-protein-coupled receptors) and integrins as well as peripheral plasma membrane-associated signalling molecules, thereby regulating important
intracellu-lar signal transduction pathways [5, 12, 45, 73]. We observe a mixed steady-state potential
localisation between the endosome and PM for both Rab5a and Rab5b (Fig ??D). According to previously published information, both Rab5a and Rab5b are mainly localised to (and considered well-established constituents of) the early endosome compartment but have also
been detected on the PM and clathrin-coated vesicles, in support of our results [51,64, 77].
Moreover, according to the HPA Cell Atlas, Rab5b resides in the vesicles (which, in this context, include the endosomes, lysosomes, peroxisomes and lipid droplets). There is no information regarding the sub-cellular location of Rab5a in this database.
Second, Q92738 (RN-tre) is a GTPase-activating protein (GAP) which controls the ac-tivity of several Rab GTPases. RN-tre is a major Rab5 (see above) regulator and therefore a
key player in the organisation and dynamics of the endocytic pathway [28, 42]. This protein
modulates the internalisation of and signal transduction mediated by cell surface receptors
such as EGFR, TfR and β1 integrins [17, 42, 48, 55]. It also controls early
endosome-to-Golgi retrograde transport and endosome-to-Golgi membrane organisation [32]. We observe a steady-state
snapshot of the sub-cellular distribution of RN-tre with potential localisation to the endo-some and PM (Fig ??D). In line with these results, RN-tre has been shown to reside in Rab5-positive early endosomes at steady state, but has also been detected at the PM and
focal adhesions [17, 28, 42, 48, 55]. There is no information concerning the sub-cellular
localisation of RN-tre in the HPA Cell Atlas database.
Third, Q96L93 (KIF16B) is a plus end-directed molecular motor which belongs to the kinesin-3 protein family. This kinesin regulates early endosome motility along microtubules and is required for the establishment of the steady-state sub-cellular distribution of early endosomes as well as the balance between PM recycling and lysosome degradation of signal
transducing cell surface receptors including EGFR and TfR [9,35]. In neuronal cells, KIF16B
plays an important role in the establishment of somatodendritic early endosome localisation
and in the tracking of AMPA and NGF receptors [21]. In epithelial cells, this protein
controls the transcytosis of TfR from juxtanuclear recycling endosomes to apical recycling
endosomes [6]. KIF16B is also involved in tubular endosome biogenesis and ssion by
regu-lating early endosome fusion [65]. Lastly, this kinesin has been shown to mediate biosynthetic
Golgi-to-endosome transport of FGFR (broblast growth factor receptor)-carrying vesicles and thereby control FGFR cell surface presentation and signalling during in vivo mouse
embryogenesis [74]. Our results indicate a mixed localisation to the endosome and PM for
KIF16B (Fig ??D). In line with our observations, it has been reported that this protein is
as-sociated with early endosome membranes at steady state in mouse and human cells [21, 35].
Additionally, it has been demonstrated that KIF16B co-localises with, and its spatial dis-tribution and activity is regulated by, the small GTPase Rab5, whose isoforms Rab5a and Rab5b we also identied as potentially localised to the endosome and PM in the U-2 OS
hy-perLOPIT dataset (see above), on early endosomes [35,65]. Taking the above into account,
a mixed distribution between the endosome and PM is reective of the molecular function of KIF16B. However, the HPA Cell Atlas database classies KIF16B as a component of the mi-tochondria (Fig ??B), contradicting our ndings as well as previously published information
regarding the sub-cellular localisation and biological role of this protein. We speculate that this disagreement arises from the uncertainty associated with the specicity of the chosen
antibody [71]. Indeed, the reliability of the mitochondrial annotation for KIF16B is classied
as "uncertain" in this database.
Fourth, Q8NHG8 (ZNRF2) is an E3 ubiquitin ligase which has been shown to regulate
mTOR signalling as well as lysosomal acidity and homeostasis in mouse and human cells [37].
This protein has been found to control the sub-cellular localisation and biological function
of mTORC1, the V-ATPase and the Na+/K+-ATPase α1 [36, 37]. ZNRF2 is
membrane-associated but can be released into the cytosol upon phosphorylation by various kinases
[37]. We observe a mixed steady-state distribution between the endosome and PM for this
protein (Fig ??D). In support of this result, we nd that ZNRF2 has been detected on the
endosomes, lysosomes, Golgi apparatus and PM according to the literature [1, 37]. There
is no information in regard to the sub-cellular location of ZNRF2 in the HPA Cell Atlas database.
Fifth, O15498 (Ykt6) is a SNARE (soluble N-ethylmaleimide-sensitive factor attachment protein receptor) protein which is conserved from yeast to humans. This protein regu-lates a wide variety of intracellular tracking and membrane tethering and fusion processes including ER-to-Golgi vesicular transport, intra-Golgi trac, retrograde Golgi-to-ER trans-port, retrograde endosome-to-TGN (trans-Golgi network) tracking, homotypic fusion of ER membranes, PM transport and exosome/secretory vesicle-PM fusion, Golgi-to-vacuole trac (in yeast), homotypic Golgi-to-vacuole fusion (in yeast), autophagosome formation and
autophagosome-lysosome fusion [20,44,49,68,69,80]. Ykt6 lacks a transmembrane domain
and is able to cycle between intracellular membranes and the cytosol in a
palmitoylation-and farnesylation-dependent manner [25, 50]. The membrane-associated form of Ykt6 has
been detected on the PM, ER, Golgi apparatus, endosomes, lysosomes, vacuoles (in yeast),
and autophagosomes as part of various SNARE complexes [20, 25, 44,49,50,68,69,80]. In
line with this information, our results show a mixed sub-cellular distribution for Ykt6 with potential localisation to the endosome and cytosol (Fig ??D). The cytosolic localisation for Ykt6 is also supported by the HPA Cell Atlas annotation corresponding to this protein (Fig ??B), further reinforcing our ndings.
Sixth, Q9NZN3 (EHD3) is another important regulator of endocytic tracking and recy-cling. This protein promotes the biogenesis and stabilisation of tubular recycling endosomes
by inducing early endosome membrane bending and tubulation [3,33]. Additionally, EHD3
is essential for early to-recycling endosome transport, retrograde early endosome-to-Golgi trac, Golgi apparatus morphology maintenance, and recycling endosome-to-PM
transport [8, 31, 33, 53, 54]. It plays an important role in the recycling of cell surface
re-ceptors and the biosynthetic transport of lysosome proteins [8, 31, 53, 54]. We observe a
mixed steady-state potential localisation to the endosome and PM for EHD3 (Fig ??D). Our results are in agreement with previously published studies which have reported that EHD3
is resident in the early endosomes and recycling endosomes at steady state [8, 31, 53, 54],
and our PM localisation-related observation is supported by the HPA Cell Atlas-derived annotation for this protein (Fig ??B).
Our ndings provide insights on the dynamic sub-cellular distribution of proteins which play important roles in development, physiology and disease. For example, Rab5/Rab5a has been identied as a master regulator of cancer cell migration, tumour invasion and
dissemination programs in vitro and in vivo. It has been demonstrated that Rab5/Rab5a expression is dysregulated in many invasive human cancers, Rab5/Rab5a is overexpressed in metastatic foci compared to the matched primary tumours, and Rab5/Rab5a activ-ity critically promotes the acquisition of invasive properties by poorly invasive tumour
cell types [19, 23, 45, 46, 51, 62, 72]. Several publications have reported that elevated
Rab5/Rab5a expression correlates with, and is predictive of, increased local invasiveness and metastatic potential, as well as poor patient prognosis in a variety of human cancer
types [19, 23, 26, 39, 51, 79, 81, 84]. Due to its established role in cancer progression and
metastasis, Rab5/Rab5a is considered a fundamental cancer-associated protein and a
po-tential diagnostic marker or therapeutic target [23, 39]. Recently, Rab5 was identied as a
promising therapeutic target for colorectal cancer, as inhibition of Rab5 (and Rab7) activity
led to elimination of colorectal cancer stem cells and disruption of colorectal cancer foci [70].
Moreover, individual ablation of Rab5a but also Rab5b was shown to impair the invasion
and dissemination ability of dierent cancer cell types [23]. In addition to its important role
in cancer, there is some evidence suggesting that Rab5a might also be involved in the early
pathogenesis of Alzheimer's disease [10, 11, 60]. Lastly, the Rab5 machinery has also been
identied as an important factor in several bacterial, parasitic and viral infections. Bacterial pathogens such as Mycobacterium tuberculosis, Listeria monocytogenes, Tropheryma whipplei
and Salmonella typhimurium [47], as well as parasites such as Leishmania donovani have
evolved specic subversion mechanisms with which they are able to control the intracellular distribution and/or activity of Rab5 and its eectors as a way to avoid neutralisation by the
immune system or facilitate invasion [76]. L. donovani specically controls the expression
and function of the Rab5a isoform in this context [76]. Additionally, Rab5 was shown to
participate in adenovirus endocytosis [57], both Rab5a and Rab5b were found to play
func-tional roles in web formation and viral genome replication during HCV (hepatitis C virus)
infection [67], and Rab5a was identied as a crucial target of HBV (hepatitis B virus) during
HBV-related hepatocellular carcinoma pathogenesis [63].
Apart from Rab5a and Rab5b, the other proteins also possess demonstrated roles in de-velopment and disease. RN-tre is overexpressed in a subset of aggressive basal-like breast cancers, where high levels of this protein prevent the endocytosis and recycling of EGFR, leading to Akt overstimulation. In turn, Akt activity stabilises the glucose transporter GLUT1 at the cell membrane, resulting in an increase in glycolysis and cancer cell prolifer-ation. RN-tre has been proposed as a potential therapeutic target for these types of breast
cancer [2]. This protein also plays a functional role in infection, as it was shown to
regu-late the uptake and intracellular tracking of Shiga toxins [24]. Furthermore, it has been
reported that KIF16B is essential for early post-implantation mouse embryo development,
as Kif16b-knockout animals display peri-implantation embryonic lethality [74]. In addition,
recent studies have shown that ZNRF2 is overexpressed in human non-small cell lung cancer, osteosarcoma and papillary thyroid cancer, and that high levels of this protein are correlated
with disease progression and poor patient prognosis in these cases [15, 78, 83]. Moreover,
Ykt6 was found to be necessary for glycosome biogenesis and function in the kinetoplastid parasite Trypanosoma brucei, which causes African sleeping sickness, with Ykt6 ablation signicantly reducing the viability of the parasite in both its pro-cyclic and bloodstream
Summary of convergence diagnostics
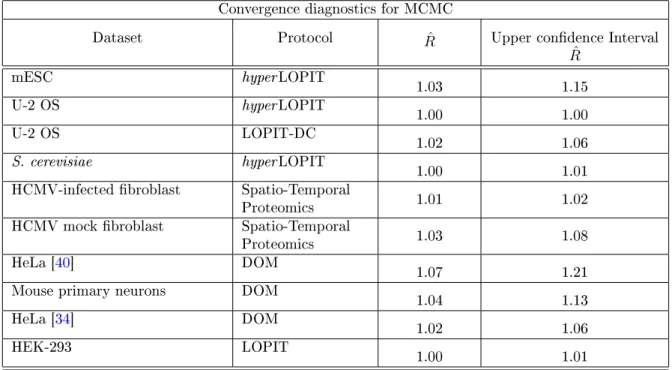
We provide a summary of convergence diagnostics using parallel chains analysis [30]. We
compute the number of proteins allocated to the outlier component at each iteration of the
Markov-chain and monitor this quantity for convergence. The Rˆ statistic between parallel
chains in then computed and reported in the table below. A value of R <ˆ 1.2 indicates
convergence.
Convergence diagnostics for MCMC
Dataset Protocol Rˆ Upper condence Interval ˆ R mESC hyperLOPIT 1.03 1.15 U-2 OS hyperLOPIT 1.00 1.00 U-2 OS LOPIT-DC 1.02 1.06 S. cerevisiae hyperLOPIT 1.00 1.01 HCMV-infected broblast Spatio-Temporal
Proteomics 1.01 1.02 HCMV mock broblast Spatio-Temporal
Proteomics 1.03 1.08 HeLa [40] DOM 1.07 1.21 Mouse primary neurons DOM 1.04 1.13 HeLa [34] DOM 1.02 1.06 HEK-293 LOPIT 1.00 1.01
Table 1: A table reporting convergence diagnostics for MCMC analysis
Prior specication and sensitivity
To complete the Bayesian specication, here we provide details of the priors on the model parameters. In the multivariate Gaussian components of the Novelty TAGM model, as with TAGM, a common and practical choice is the use of a normal-inverse-Wishart prior. That is, µ|Σ∼ N(µ0,Σ/λ0) Σ∼ IW(ν0, S0) ∝ |Σ|ν0+2d+1exp −1 2trace(Σ −1S−1 0 ) , (4)
for each mixture component and where d is the dimension of the data. To complete this
discussion, we need to specify the hyperparameters, µ0, λ0, ν0 andS0. We use diusive priors
obtain the correct scale of the data. The hyperparameters are selected as follows µ0 = 1 n n X i=1 xi, λ0 = 0.01, ν0 =d+ 2, S0 = diag (var(X)) K1/d . (5)
The hyperparameters are interpreted in the following ways. The prior mean,µ0, is the mean
of the data. Then λ0 is viewed as the number of observations with data µ0 which are added
to each component specic mean. This value is small to avoid strong prior inuence. The
marginal prior distribution (or prior predictive) for a cluster specic mean µ is given by a
student's t-distribution. This can be observed by recalling that the student's t-distribution
arises by marginalisation of the covariance from a normal distribution. Now, to ensure this
t-distribution has nite covariance we require that ν0 > d+ 1. Thus, the choice presented
here is the smallest integer value of ν0 that ensures a nite covariance matrix. Hence, we
have a well dened t-distribution with heavy tails. The empirically chosen scale matrix S0
is chosen to roughly partition the range of the data into K balls of equal size. Previous
work has shown that these priors lead to good predictive performance [14]. Forπ, we take a
conjugate symmetric Dirichlet prior with parameterβ, so thatπ1, . . . , πKmax ∼Dirichlet(β).
Note that to apply the principle of overtted mixtures, we have to choose maxjβj < d/2
[61], which is satised in all examples by setting βj = 1 for every j. Empirically Van Havre
et al. [75] have recommended smaller values of βj ≈n−1 to encourage stronger shrinkage.
Sensitivity to the choice of βj
To explore the sensitivity of our inferences to the specication of βj, we considered setting
βj = 0.1,0.01, as well asβj ≈n−1for the mESC example, which in this casen−1 ≈0.0002. As
before, we hid nucleus, chromatin and ribosome annotations and sought to use our model to rediscover them. As we now summarily describe, we found that our results can be sensitive
to the choice of βj and hence it should be set carefully. For example when βj = 0.1,
we were unable to detect a ribosomal phenotype. Furthermore, there was a joint nucleus and chromatin phenotype, phenotype 1, rather than two distinct phenotypes. Chromosome
was enriched for this phenotype (p < 10−100), as well as nucleolus (p < 10−60). When
βj = 0.01the results were somewhat improved with a phenotype 1 enriched for chromosome
(p <10−100) but phenotype 3 was enriched for cytosolic ribosome (p <10−48)and nucleolus
(p < 10−50). Setting β
j = 0.0002 provided the expected results with 3 distinct phenotypes
for chromatin (phenotype 1)(p <10−100), nucleolus (phenotype 4)(p <10−50), and cytosolic
ribsome (phenotype 3)(p < 10−59), successfully matching our test components. Hence, based
on these results, we would recommend either βj = 1 or βj ≈ n−1 depending on the desired
Impact of reducing the proportion of labelled proteins
In all the examples we considered previously, the proportion of labelled proteins is roughly
20% of the total number of proteins. To assess the impact of the relative proportion of
labelled and unlabelled proteins, we reconsidered our mESC example, where the goal was to detect ribosomal, nuclear and chromatin niches without annotation. In addition to masking these annotations as test components, we also masked, uniformly at random, an additional
10%,20% and 50% of labelled proteins and assessed our ability to rediscover the ribosomal,
nuclear and chromatin testing classes.
Briey, we were able to rediscover two distinct phenotypes according to two nuclear
clusters in all cases. When we masked10%of the labels, the enrichments for the two nuclear
phenotypes were chromosome (p < 10−99) and nucleolus (p < 10−59), the results were the
same when we removed 20% and 50% of labels. However, only in the scenario were 20%
of the labels were hidden did we nd a ribosome enriched phenotype (p < 10−30). In the
other cases, the ribosome clustered with the other large protein complex: the proteasome. This reects the similar biochemical properties of these subcellular niches. Furthermore, removing annotations renders the proteasome prole less well dened, resulting in a more
diuse cluster. In practice, careful quality control would mitigate these scenarios [27]. In
applications where there are very few annotated niches and the analysis is close to the
unsupervised setting, it may be valuable to increase Knovelty above 10 - others have found
References
[1] Araki, T. et al. (2003). Znrf proteins constitute a family of presynaptic e3 ubiquitin ligases. Journal of Neuroscience, 23(28), 93859394.
[2] Avanzato, D. et al. (2018). High usp6nl levels in breast cancer sustain chronic akt phos-phorylation and glut1 stability fueling aerobic glycolysis. Cancer research, 78(13), 3432 3444.
[3] Bahl, K. et al. (2016). Ehd3 protein is required for tubular recycling endosome stabiliza-tion, and an asparagine-glutamic acid residue pair within its eps15 homology (eh) domain dictates its selective binding to npf peptides. Journal of Biological Chemistry, 291(26), 1346513478.
[4] Banerjee, H. et al. (2017). Involvement of snare protein ykt6 in glycosome biogenesis in trypanosoma brucei. Molecular and biochemical parasitology, 218, 2837.
[5] Bastin, G. et al. (2013). Rab family proteins regulate the endosomal tracking and function of rgs4. Journal of Biological Chemistry, 288(30), 2183621849.
[6] Bay, A. E. P. et al. (2013). The kinesin kif16b mediates apical transcytosis of transferrin receptor in ap-1b-decient epithelia. The EMBO journal, 32(15), 21252139.
[7] Beltran, P. M. J. et al. (2016). A portrait of the human organelle proteome in space and time during cytomegalovirus infection. Cell systems, 3(4), 361373.
[8] Cabasso, O. et al. (2015). Sumoylation of ehd3 modulates tubulation of the endocytic recycling compartment. PloS one, 10(7), e0134053.
[9] Carlucci, A. et al. (2010). Ptpd1 supports receptor stability and mitogenic signaling in bladder cancer cells. Journal of biological chemistry, 285(50), 3926039270.
[10] Cataldo, A. M. et al. (1997). Increased neuronal endocytosis and protease delivery to early endosomes in sporadic alzheimer's disease: neuropathologic evidence for a mechanism
of increased β-amyloidogenesis. Journal of Neuroscience, 17(16), 61426151.
[11] Cataldo, A. M. et al. (2000). Endocytic pathway abnormalities precede amyloid β
deposition in sporadic alzheimer's disease and down syndrome: dierential eects of apoe genotype and presenilin mutations. The American journal of pathology, 157(1), 277286. [12] Chen, P.-I. et al. (2009). Rab5 isoforms dierentially regulate the tracking and degra-dation of epidermal growth factor receptors. Journal of Biological Chemistry, 284(44), 3032830338.
[13] Chen, P.-I. et al. (2014). Rab5 isoforms orchestrate a "division of labor" in the endocytic network; rab5c modulates rac-mediated cell motility. PloS one, 9(2), e90384.
[14] Crook, O. M. et al. (2018). A bayesian mixture modelling approach for spatial pro-teomics. PLOS Computational Biology, 14(11), 129.
[15] Cui, Z. et al. (2019). Long non-coding rna ttn-as1 facilitates tumorigenesis of papillary thyroid cancer through modulating mir-153-3p/znrf2 axis. The journal of gene medicine, page e3083.
[16] Curran, J. et al. (2014). Ehd3-dependent endosome pathway regulates cardiac mem-brane excitability and physiology. Circulation research, 115(1), 6878.
[17] De Franceschi, N. et al. (2015). Integrin tracthe update. J Cell Sci, 128(5), 839852. [18] Dealtry, G. B. et al. (1992). Cell biology labfax. Distributed in the United States and
Canada by Academic Press.
[19] Díaz, J. et al. (2014). Rab5 is required in metastatic cancer cells for caveolin-1-enhanced rac1 activation, migration and invasion. J Cell Sci, 127(11), 24012406.
[20] Dilcher, M. et al. (2001). Genetic interactions with the yeast q-snare vti1reveal novel functions for the r-snare ykt6. Journal of Biological Chemistry, 276(37), 3453734544. [21] Farkhondeh, A. et al. (2015). Characterizing kif16b in neurons reveals a novel
in-tramolecular "stalk inhibition" mechanism that regulates its capacity to potentiate the se-lective somatodendritic localization of early endosomes. Journal of Neuroscience, 35(12), 50675086.
[22] Fritsch, A. et al. (2009). Improved criteria for clustering based on the posterior similarity matrix. Bayesian Anal., 4(2), 367391.
[23] Frittoli, E. et al. (2014). A rab5/rab4 recycling circuitry induces a proteolytic invasive program and promotes tumor dissemination. J Cell Biol, 206(2), 307328.
[24] Fuchs, E. et al. (2007). Specic rab gtpase-activating proteins dene the shiga toxin and epidermal growth factor uptake pathways. The Journal of cell biology, 177(6), 11331143. [25] Fukasawa, M. et al. (2004). Localization and activity of the snare ykt6 determined by its regulatory domain and palmitoylation. Proceedings of the National Academy of Sciences, 101(14), 48154820.
[26] Fukui, K. et al. (2007). Expression of rab5a in hepatocellular carcinoma: possible involvement in epidermal growth factor signaling. Hepatology Research, 37(11), 957965. [27] Gatto, L. et al. (2019). Assessing sub-cellular resolution in spatial proteomics
experi-ments. Current opinion in chemical biology, 48, 123149.
[28] Gautreau, A. et al. (2014). Function and regulation of the endosomal fusion and ssion machineries. Cold Spring Harbor perspectives in biology, 6(3), a016832.
[29] Geladaki, A. et al. (2019). Combining lopit with dierential ultracentrifugation for high-resolution spatial proteomics. Nature Communications, 10, 331.
[30] Gelman, A. et al. (1992). Inference from iterative simulation using multiple sequences. Statistical science, pages 457472.
[31] George, M. et al. (2007). Shared as well as distinct roles of ehd proteins revealed by biochemical and functional comparisons in mammalian cells and c. elegans. BMC cell biology, 8(1), 3.
[32] Haas, A. K. et al. (2007). Analysis of gtpase-activating proteins: Rab1 and rab43 are key rabs required to maintain a functional golgi complex in human cells. Journal of cell science, 120(17), 29973010.
[33] Henmi, Y. et al. (2016). Phosphatidic acid induces ehd3-containing membrane tubula-tion and is required for receptor recycling. Experimental cell research, 342(1), 110. [34] Hirst, J. et al. (2018). Role of the ap-5 adaptor protein complex in late endosome-to-golgi
retrieval. PLoS biology, 16(1), e2004411.
[35] Hoepfner, S. et al. (2005). Modulation of receptor recycling and degradation by the endosomal kinesin kif16b. Cell, 121(3), 437450.
[36] Hoxhaj, G. et al. (2012). Znrf2 is released from membranes by growth factors and, together with znrf1, regulates the na+/k+ atpase. J Cell Sci, 125(19), 46624675. [37] Hoxhaj, G. et al. (2016). The e3 ubiquitin ligase znrf2 is a substrate of mtorc1 and
regulates its activation by amino acids. elife, 5, e12278.
[38] Hubert, L. et al. (1985). Comparing partitions. Journal of Classication, 2(1), 193218. [39] Igarashi, T. et al. (2017). Association of rab5 overexpression in pancreatic cancer with cancer progression and poor prognosis via e-cadherin suppression. Oncotarget, 8(7), 12290. [40] Itzhak, D. N. et al. (2016). Global, quantitative and dynamic mapping of protein
subcellular localization. Elife, 5, e16950.
[41] Kirk, P. et al. (2012). Bayesian correlated clustering to integrate multiple datasets. Bioinformatics, 28(24), 32903297.
[42] Lanzetti, L. et al. (2000). The eps8 protein coordinates egf receptor signalling through rac and tracking through rab5. Nature, 408(6810), 374.
[43] Law, F. et al. (2017). The vps34 pi3k negatively regulates rab-5 during endosome maturation. J Cell Sci, 130(12), 20072017.
[44] Linnemannstöns, K. et al. (2018). Ykt6 membrane-to-cytosol cycling regulates exosomal wnt secretion. bioRxiv, page 485565.
[45] Liu, B. et al. (2015). Cmtm7 knockdown increases tumorigenicity of human non-small cell lung cancer cells and egfr-akt signaling by reducing rab5 activation. Oncotarget, 6(38), 41092.
[46] Liu, S.-s. et al. (2011). Knockdown of rab5a expression decreases cancer cell motility and invasion through integrin-mediated signaling pathway. Journal of biomedical science, 18(1), 58.
[47] Madan, R. et al. (2008). Sope-mediated recruitment of host rab5 on phagosomes inhibits salmonella transport to lysosomes. In Autophagosome and Phagosome, pages 417437. Springer.
[48] Martinu, L. et al. (2002). Endocytosis of epidermal growth factor receptor regulated by grb2-mediated recruitment of the rab5 gtpase-activating protein rn-tre. Journal of Biological Chemistry, 277(52), 5099651002.
[49] Matsui, T. et al. (2018). Autophagosomal ykt6 is required for fusion with lysosomes independently of syntaxin 17. J Cell Biol, 217(8), 26332645.
[50] Meiringer, C. T. et al. (2008). Depalmitoylation of ykt6 prevents its entry into the multivesicular body pathway. Trac, 9(9), 15101521.
[51] Mendoza, P. et al. (2013). Rab5 activation promotes focal adhesion disassembly, migra-tion and invasiveness in tumor cells. J Cell Sci, 126(17), 38353847.
[52] Mulvey, C. M. et al. (2017). Using hyperLOPIT to perform high-resolution mapping of the spatial proteome. Nature Protocols, 12(6), 11101135.
[53] Naslavsky, N. et al. (2006). Interactions between ehd proteins and rab11-p2: a role for ehd3 in early endosomal transport. Molecular biology of the cell, 17(1), 163177.
[54] Naslavsky, N. et al. (2009). Ehd3 regulates early-endosome-to-golgi transport and pre-serves golgi morphology. Journal of cell science, 122(3), 389400.
[55] Palamidessi, A. et al. (2013). The gtpase-activating protein rn-tre controls focal adhesion turnover and cell migration. Current biology, 23(23), 23552364.
[56] Rand, W. M. (1971). Objective criteria for the evaluation of clustering methods. Journal of the American Statistical association, 66(336), 846850.
[57] Rauma, T. et al. (1999). rab5 gtpase regulates adenovirus endocytosis. Journal of virology, 73(11), 96649668.
[58] Richardson, S. et al. (1997). On bayesian analysis of mixtures with an unknown num-ber of components (with discussion). Journal of the Royal Statistical Society: series B (statistical methodology), 59(4), 731792.
[59] Rink, J. et al. (2005). Rab conversion as a mechanism of progression from early to late endosomes. Cell, 122(5), 735749.
[60] Rosenfeld, J. L. et al. (2001). Lysosome proteins are redistributed during expression of a gtp-hydrolysis-defective rab5a. Journal of cell science, 114(24), 44994508.
[61] Rousseau, J. et al. (2011). Asymptotic behaviour of the posterior distribution in overt-ted mixture models. Journal of the Royal Statistical Society: Series B (Statistical Method-ology), 73(5), 689710.
[62] Saitoh, S. et al. (2017). Rab5-regulated endocytosis plays a crucial role in apical ex-trusion of transformed cells. Proceedings of the National Academy of Sciences, 114(12), E2327E2336.
[63] Sheng, Y. et al. (2014). Downregulation of mir-101-3p by hepatitis b virus promotes proliferation and migration of hepatocellular carcinoma cells by targeting rab5a. Archives of virology, 159(9), 23972410.
[64] Simonsen, A. et al. (1998). Eea1 links pi (3) k function to rab5 regulation of endosome fusion. Nature, 394(6692), 494.
[65] Skjeldal, F. M. et al. (2012). The fusion of early endosomes induces molecular-motor-driven tubule formation and ssion. J Cell Sci, 125(8), 19101919.
[66] Stephens, M. (2000). Dealing with label switching in mixture models. Journal of the Royal Statistical Society: Series B (Statistical Methodology), 62(4), 795809.
[67] Stone, M. et al. (2007). Participation of rab5, an early endosome protein, in hepatitis c virus rna replication machinery. Journal of virology, 81(9), 45514563.
[68] Tai, G. et al. (2004). Participation of the syntaxin 5/ykt6/gs28/gs15 snare complex in transport from the early/recycling endosome to the trans-golgi network. Molecular biology of the cell, 15(9), 40114022.
[69] Takáts, S. et al. (2018). Non-canonical role of the snare protein ykt6 in autophagosome-lysosome fusion. PLoS genetics, 14(4), e1007359.
[70] Takeda, M. et al. (2019). Disruption of endolysosomal rab5/7 eciently eliminates colorectal cancer stem cells. Cancer research, pages canres2192.
[71] Thul, P. J. et al. (2017). A subcellular map of the human proteome. Science, 356(6340), eaal3321.
[72] Torres, V. A. et al. (2010). Rab5 mediates caspase-8promoted cell motility and metas-tasis. Molecular biology of the cell, 21(2), 369376.
[73] Trischler, M. et al. (1999). Biochemical analysis of distinct rab5-and rab11-positive endosomes along the transferrin pathway. J Cell Sci, 112(24), 47734783.
[74] Ueno, H. et al. (2011). Kif16b/rab14 molecular motor complex is critical for early embryonic development by transporting fgf receptor. Developmental cell, 20(1), 6071. [75] Van Havre, Z. et al. (2015). Overtting bayesian mixture models with an unknown
number of components. PloS one, 10(7), e0131739.
[76] Verma, J. K. et al. (2017). Leishmania donovani resides in modied early endosomes by upregulating rab5a expression via the downregulation of mir-494. PLoS pathogens, 13(6), e1006459.
[77] Woodman, P. G. (2000). Biogenesis of the sorting endosome: the role of rab5. Trac, 1(9), 695701.
[78] Xiao, Q. et al. (2017). Microrna-100 suppresses human osteosarcoma cell proliferation and chemo-resistance via znrf2. Oncotarget, 8(21), 34678.
[79] Yang, P.-S. et al. (2011). Rab5a is associated with axillary lymph node metastasis in breast cancer patients. Cancer science, 102(12), 21722178.
[80] Yong, C. Q. Y. et al. (2019). Another longin snare for autophagosome-lysosome fusion-how does ykt6 work? Autophagy, 15(2), 352357.
[81] Yu, L. et al. (1999). Dierential expression of rab5a in human lung adenocarcinoma cells with dierent metastasis potential. Clinical & experimental metastasis, 17(3), 213219. [82] Zerial, M. et al. (2001). Rab proteins as membrane organizers. Nature reviews Molecular
cell biology, 2(2), 107.
[83] Zhang, X. et al. (2016). The role of znrf2 in the growth of non-small cell lung cancer. European review for medical and pharmacological sciences, 20, 40114017.
[84] Zhao, Z. et al. (2010). Rab5a overexpression promoting ovarian cancer cell proliferation may be associated with appl1-related epidermal growth factor signaling pathway. Cancer science, 101(6), 14541462.