M E T H O D O L O G Y A R T I C L E
Open Access
BPDA - A Bayesian peptide detection algorithm
for mass spectrometry
Youting Sun
1, Jianqiu Zhang
2*, Ulisses Braga-Neto
1, Edward R Dougherty
1,3,4*Abstract
Background:Mass spectrometry (MS) is an essential analytical tool in proteomics. Many existing algorithms for peptide detection are based on isotope template matching and usually work at different charge states separately, making them ineffective to detect overlapping peptides and low abundance peptides.
Results:We present BPDA, a Bayesian approach for peptide detection in data produced by MS instruments with high enough resolution to baseline-resolve isotopic peaks, such as MALDI-TOF and LC-MS. We model the spectra as a mixture of candidate peptide signals, and the model is parameterized by MS physical properties. BPDA is based on a rigorous statistical framework and avoids problems, such as voting and ad-hoc thresholding, generally encountered in algorithms based on template matching. It systematically evaluates all possible combinations of possible peptide candidates to interpret a given spectrum, and iteratively finds the best fitting peptide signal in order to minimize the mean squared error of the inferred spectrum to the observed spectrum. In contrast to previous detection methods, BPDA performs deisotoping and deconvolution of mass spectra simultaneously, which enables better identification of weak peptide signals and produces higher sensitivities and more robust results. Unlike template-matching algorithms, BPDA can handle complex data where features overlap. Our experimental results indicate that BPDA performs well on simulated data and real MS data sets, for various resolutions and signal to noise ratios, and compares very favorably with commonly used commercial and open-source software, such as flexAnalysis, OpenMS, and Decon2LS, according to sensitivity and detection accuracy.
Conclusion:Unlike previous detection methods, which only employ isotopic distributions and work at each single charge state alone, BPDA takes into account the charge state distribution as well, thus lending information to better identify weak peptide signals and produce more robust results. The proposed approach is based on a rigorous statistical framework, which avoids problems generally encountered in algorithms based on template matching. Our experiments indicate that BPDA performs well on both simulated data and real data, and compares very favorably with commonly used commercial and open-source software. The BPDA software can be
downloaded from http://gsp.tamu.edu/Publications/supplementary/sun10a/bpda.
Background
Mass spectrometry (MS) is a key analytical tool in pro-teomics. A mass spectrometer measures the concentra-tion of ionized molecules at a range of mass-to-charge ratios (m/z). MS instruments consist of three modules: an ionization source, a mass analyzer and a detector which captures the ions and measures the intensity of each ion species. Widely used ionization methods
include electrospray ionization (ESI) [1] and matrix-assisted laser desorption/ionization (MALDI) [2,3]. Mass analyzers separate the ions according to their mass-to-charge ratios. There are several types of mass analyzers including the Orbitrap [4], Quadrupole [5], Time-of-Flight (TOF) [6,7], and fourier transform ion cyclotron resonance (FTICR) [8]. Liquid Chromatography (LC) is often coupled with MS to achieve additional separation of peptides and thus reduce the complexity of an indivi-dual mass spectrum. Before entering the mass spectro-meter, peptide species pass through a LC column with different speeds depending on their physicochemical properties and interactions with the solvent [9]. A single * Correspondence: [email protected]; [email protected]
1
Department of Electrical and Computer Engineering, Texas A&M University, College Station, TX 77843, USA
2
Department of Electrical and Computer Engineering, University of Texas at San Antonio, San Antonio, TX 78249, USA
Full list of author information is available at the end of the article
© 2010 Sun et al; licensee BioMed Central Ltd. This is an Open Access article distributed under the terms of the Creative Commons Attribution License (http://creativecommons.org/licenses/by/2.0), which permits unrestricted use, distribution, and reproduction in any medium, provided the original work is properly cited.
LC-MS experiment usually produces hundreds to thou-sands of mass spectra sampled during the LC elution process.
Peptide detection, which converts raw spectra to a list of peptide masses, is usually the first step in protein MS data processing. It directly affects the accuracy of subse-quent analyses such as protein identification and quanti-fication, data alignment between multiple experiments, biomarker discovery and classification of different sam-ples. One difficulty in peptide detection is that a peptide species may register several peaks in the spectra due to the following two points: First, a peptide species may take different numbers of charges during ionization, therefore its peaks can be observed at different charge states. Second, at a given charge state, several peaks can be observed due to heavy isotopes (e.g.13C), which are commonly referred to as isotopic peaks or the isotope series. The isotopic distribution of a peptide can be deter-mined by the elemental formula of the peptide and the natural abundance of heavy isotopes, and therefore known [10]. When mass spectra have low resolution in which isotopic peaks cannot be baseline resolved (i.e. the isotopic peaks convolve together to form isotope envel-opes, and only one peak can be observed for one peptide at a given charge state), and when peptides are singly charged as commonly observed in MALDI, to report each detected peak as a peptide feature might be suffi-cient as in [11-14]. But for high resolution spectra, reporting each observed peak as a unique peptide species would give rise to too many false positives. Thus a variety of algorithms for deisotoping and charge states deconvo-lution have been proposed. Many of these algorithms such as PepList [15], msInspect [16], Noy’s method [17], Decon2LS [18], and OpenMS [19] are based on template matching. Templates employed in the first four algo-rithms are based on 1 D theoretic isotope patterns pre-dicted from peptide masses [20-22], while the last
algorithm combines isotope patterns (along the m/z
dimension) with elution peaks (along the elution time dimension) to form 2 D templates. If the observed signal (a cluster of peaks) matches the proposed template well–the quality of the match is assessed by a fitting
score –it will be reported as a feature and then
sub-tracted from the spectrum. The process iterates until no more matches can be found. The major problem of this matching and subtraction process is that it may be inef-fective to detect overlapping peptides. In the case of over-lapping (e.g. one doubly charged peptide can overlap with a singly charged peptide of half the mass), if the peak cluster of one peptide is incorrectly matched and sub-tracted, the rest of the peptides can not be detected cor-rectly based on the remaining spectrum, which will cause error propagation. Besides, each predicted template is based on a single peptide and it can not match the
observed overlapping peaks well, which renders a low quality match and reduces the sensitivities of these algo-rithms. In addition to these algorithms based on template
matching, Duet al. developed an algorithm based on
variable selection [10]. The key idea is to select the least number of candidate isotope series to explain the spec-trum, and hence find the corresponding peptides. But the
superimposed criterion“selecting the least number of
candidates”is not justified. In fact, while this criterion may result in a desirable reduction of the false detection rate, the sensitivity may be reduced as well. Zhanget. al. [23] proposed a Bayesian approach for peptide ion peak detection. A model for them/zinterval of one dalton was developed, a Bayesian approach was applied to estimate the model parameters based on the observed spectrum, and the existence probability of a peptide ion peak at each charge state and isotope position was calculated. Note that this algorithm did not perform peptide level peak detection as what we are proposing in this paper. The authors reported that their method had better sensi-tivity results than the wavelet based algorithms when tested by simulated data and eight sets of real prOTOF MS data. In this paper, we propose a Bayesian Peptide Detection Algorithm (BPDA), which is basically an
exten-sion of Zhang’s method. The difference being that a
model for the whole spectrum is developed, and both iso-tope patterns and charge state distributions of peptides are considered in our method.
The proposed method, BPDA, can be applied to data generated by MS instruments with mass resolutions high enough to baseline-resolve isotopic peaks. BPDA evaluates all possible combinations of possible peptide candidates (originated from well-defined peaks of the
raw spectrum –see Methods section for more details)
to interpret a given spectrum, and iteratively finds the best fitting peptide parameters (peptide peak heights, existence probabilities, etc.) in order to minimize the mean squared error of the inferred spectrum to the observed spectrum. BPDA offers the following four advantages: Firstly, since BPDA looks for the optimal among all possible interpretations of the MS spectra, the procedure is thus systematic. In contrast, the afore-mentioned template-matching methods are greedy. They cannot evaluate all potential interpretations of a given spectrum. Hence, they are neither systematic nor opti-mal. Besides, many methods do not include all possible peptide candidates, especially the ones with low abun-dance in the first place, and the sensitivity is reduced compared to BPDA. Secondly, BPDA considers all charge states and isotopic peaks of peptides for detec-tion. It is noted that multiply charged peptides can reg-ister peaks at several charge states, but deisotoping and charge state deconvolution are often dealt with sepa-rately in many algorithms [10,16-19,24]. While high
abundance charge states may be correctly detected, low abundance charge states might be missed or wrongly assigned, rendering low sensitivity results in peptide identification and inaccuracy in peptide quantification. In contrast, BPDA combines the information of isotopic peaks at different charge states as a whole to detect one peptide, lending information to better identify weak pep-tide signals. Thirdly, BPDA provides existence probabil-ities for all the peptides considered, as opposed to the fitting scores generally provided by template-matching methods, the benefits being that the existence probabil-ities can be directly used for probability-based evalua-tion of peptides and confident peptide detecevalua-tion similar to that of PeptideProphet [25], which is a popular soft-ware used for LC-MS/MS peptide identification. Finally, most of the parameters in the proposed method possess a clear physical meaning, since they come directly from the observation of the mass spectra. In contrast, many other approaches require the selection of numerous nonintuitive parameters, such as wavelet functions and coefficients [11-13].
Methods
For 1 D MS spectrum, we first perform spectrum prepro-cessing to remove the baseline, filter the noise and gener-ate a list of peptide candidgener-ates. Then BPDA is applied based on the developed MS model to infer the best fitting peptide signals of the observed spectrum, the results being peptide abundances, existence probabilities and so on. For 2 D LC-MS spectra, we first detect peptide elution peaks along the retention time dimension, and build elution peak groups by collecting the peaks which have similar retention time together using a method similar to [24]. Each group contains a series of consecutive spectra, which are then averaged to form a mean spectrum. The rationale of using a mean spectrum to represent the group is that the noise of consecutive spectra could be canceled out to a certain degree [11]. The BPDA algorithm is then applied to each of the mean spectra, and finally an overall peptide list is generated. The details of the preprocessing step, the proposed MS model, and the BPDA algorithm are described in the following subsections.
Spectrum preprocessing and obtaining peptide candidates
A non-flat baseline is often observed in mass spectra, the presence of which can distort the true signal pattern. Thus the first preprocessing step is to detect and subtract the baseline from MS spectra. We use the minimum of a slid-ing window along them/zaxis as the baseline, similar to the method used in [10]. The next step is peak detection.
We use the Matlab function“mspeaks” [26] to perform
this task. The algorithm first identifies all local maxima in the wavelet denoised spectrum as putative peak locations.
Then peaks are filtered based on their intensities and sig-nal to noise ratios. The last step of preprocessing is to obtain a list of peptide candidates. Considering one detected peak with centroid atm/zvalued, we want to find out which peptides can potentially register a peak at this position. The answer is given below in terms of the masses of such peptides:
mass=i d( −mpc)−jmnt,i=1 2, ,…,cs j, =0 1, ,…,iso, (1)
wheremass is the mass of one peptide candidate, mpc
is the mass of one positive charge andmnt is the mass
shift caused by addition of one neutron. Due to mass defect, the mass shift varies for different elements. We approximate mntusing the mass shift from13Cto12C,
which is 1.0034, since Carbon contributes most to the isotope patterns. This approximation works well if the mass calibration of the instrument is correct. The
para-meterscs and iso are user defined maximum numbers
of considered charge states and isotopic positions, respectively. It is easy to see from the above equation that each detected peak gives rise tocs× (iso+ 1) differ-ent peptide candidates (masses). These candidates exhaust all the possibilities to generate the peak with centroidd, but it does not follow that all the candidates really exist in the sample. Therefore, our primary goal in peptide detection is to find the existence probability of each peptide candidate. Also note that the total
num-ber of candidates should be less than or equal to cs ×
(iso+ 1) × number of detected peaks, as is possible that multiple peaks yield the same candidate mass.
Modeling the mass spectrum
Suppose N peptide candidates are obtained from the
observed spectrum using the method described in the previous section. Each candidate can generate a series of peaks over different charge states, and at each charge state several isotopic peaks can be registered. The signal generated by thekth peptide candidate is thus modeled by the following equation, in whichi andjrepresent the charge state and the isotopic position of the candidate peptide, respectively: g xk m ck ijf x m M j iso i cs m k ij k ij ( )= , ( ; , , ,), = , ,…, , = =
∑
∑
1 0 1 2 (2)where the peak shape function is given by
f xm k ij k ij e x k ij m k ij ; , , , ( ) , ,
(
)
= 2. That is, the peak ismodeled as Gaussian-shaped, as in [27]. It is reported that the Gaussian-shaped peak approximates the reality well enough to obtain good detection results [17]. Still, this peak shape function can be adjusted for different instruments without affecting the overall structure of the algorithm.
The observed spectrum is a mixture of the signal
gen-erated by the Npeptide candidates plus Gaussian
ran-dom noise, which can be modeled as:
ym k kg x c f x k N m m k k N k ij j iso i cs m k ij k = + = = = = =
∑
∑
∑
∑
1 1 1 0 ( ) λ , ( ; , , ,, ) , , , , , ij m m M + =1 2… (3)In the above three equations,xm is themth
mass-to-charge ratio (m/z) in the spectrum,ymis the observed
intensity at xm, M is the number of observations, and
m is Gaussian random noise with zero mean and
standard deviation s. The value of can be
approxi-mated by the standard deviation of the background
region in the spectrum. Note that we model m as
additive Gaussian which is generally a good model for the thermal noise in electronic instruments. There are reports of non-Gaussian noise in FTMS [28] and thus it is safer to apply the proposed algorithm to TOF MS instruments [29]. The parameters of thekth candidate, namely, ak,ij, rk,ij, lk andck,ij are discussed in detail
below:
• ak,ij is the theoretic centroid (m/z value) of the
peak generated by candidate k, at charge state iand isotopic number j. k ij massk i mpc j mnt i i cs j iso , = , , , , , , , , , + + =1 2… =0 1… (4)
wheremasskis the mass of thekth candidate. Since the
candidate’s mass is already obtained,ak,ijcan be calculated.
• rk,ij relates to the shape (width) of the peak
cen-tered at ak,ij. It can be estimated by using its
rela-tionship to the peak’s Full Width at Half Maximum
(FWHM): k ij, =2 2ln /2 FWHM.
•lkis an indicator random variable, which is 1 if the
kth peptide candidate truly exists in the sample and 0 otherwise.
• ck,ijis the height (i.e. intensity) of the peak
gener-ated by peptide k, at charge state i and isotopic
numberj.
In summary, the model considers peaks at different isotopic positions and charge states simultaneously for each peptide candidate, incorporating candidates’ exis-tence probabilities and the spectrum thermal noise.
Bayesian peptide detection
Let
{k,ck ij, ;k= …1, ,N i, = …1, , ,cs j= …0, ,iso}
be the set of all the unknown model parameters. The
goal of our algorithm is to determine the value of θ
based on the observed spectrum y = [y1,..., yM ]T. In
fact, the value oflkis of our prime interest for the
pep-tide detection problem. For this purpose, we can use a Bayesian approach to first obtain the a posteriori prob-ability (APP) of all the parameters,P (θ |y). Then the APPsP (lk|y),k= 1, ..., N, can be obtained by
integra-tion of the joint posterior distribuintegra-tion P(θ |y) over all parameters except lk. Clearly, the calculation involves
high dimension integration which is not an easy task. Besides, due to the highly nonlinear nature of the data model, none of the desired APPs can be obtained analy-tically. To overcome the computational obstacle, we resort to the Gibbs sampling method [30], which is a variant of the Markov Chain Monte Carlo (MCMC) approach [31], to sample the model parameters.
Gibbs sampling is an iterative scheme, which uses the popular strategy of divide-and-conquer to sample a subset of parameters at a time while fixing the rest at the sample values from the previous iteration, as if they were true. In other words, for thelth parameter groupθl, we sample
from the conditional posterior distributionP(θl|θ-l,y),
whereθ-l ≜θ\θl. After this sampling process iterates
among the parameter groups for a sufficient number of cycles (which is referred to as the“burn-in”period), con-vergence is reached. The samples collected afterwards are shown to be from the marginal posterior distribution P(θl|y), which is independent ofθ-l, and thus these samples
can be used to estimate the target parameters.
The Gibbs sampling process for thekth peptide candi-date and the derivations of the conditional posterior dis-tributions of important model parameters are briefly summarized below. The detailed derivations can be found in Additional file 1.
•Sample the peak height vector ck ≜[ck,ij;i= 1,...,
cs, j= 0,...,iso]Tfor thekth peptide candidate
The heights of all the possible peaks (over different charge states and isotopic positions) of thekth pep-tide candidate are included in the peak height vector
ckand are sampled simultaneously from the
condi-tional posterior distribution ofck, which, by the
Bayesian principle, is proportional to the likelihood times the prior:
P(ck| ,y−ck)∝P( | ) (y P ck), (5) where −ck \ck.
The derivations of the likelihood, the prior distribu-tion and the condidistribu-tional posterior distribudistribu-tion ofck
are given in Additional file 1.
The conditional posterior distribution oflkis given by
P(k| ,y −k)∝p( | ) (y pk) where −k \ k.
The derivations of the likelihood, the prior distribu-tion and the condidistribu-tional posterior distribudistribu-tion of lk
are given in Additional file 1
The complexity of the proposed Gibbs sampling algo-rithm is determined by two factors: (1) the sheer num-ber of peptide candidates, and (2) the correlation between parameters that need to be sampled. The algo-rithm complexity grows exponentially with the number of peptide candidates, and the correlation between para-meters reduces the sampling efficiency. To address these two issues, we first partition non-overlapping peptide candidates into different groups. The proposed algo-rithm can be applied to each group in a parallel manner and the algorithm complexity is reduced, because within each group the number of candidates is reduced, and the corresponding signal-containing spectrum region is restricted. Peptide candidates within each group are then clustered by the k-means clustering algorithm [32], the distance measure being the correlation between pep-tide candidate signals. Peppep-tide candidates within a clus-ter have strong correlations among each other, and their indicator variables are sampled from the joint condi-tional posterior distribution. These two measures improve the overall efficiency of the algorithm. The pseudocode of the entire Gibbs sampling process is given in Additional file 2: Table S1.
The samples taken after convergence can be used to estimate the target parameters. Particularly, the exis-tence probability of peptidekis calculated as
P R r k kr r r R ( = | )= , − +
∑
= 1 1 0 1 0 y (6)where r0 is the first iteration after convergence is
reached, Ris the total number of iterations, and kr is the sample value oflkin the rth iteration. The kth
pep-tide candidate is said to be detected if its existence probability P(lk = 1|y) is greater than a predefined
threshold. Results
We report below the observed performance of BPDA, side by side with well-known tools, such as OpenMS and Decon2LS, in a number of experiments using both synthetic and real data.
Synthetic data
It is difficult to evaluate the performance of a given detection method using real data due to the existence of unpredictable contaminants and the unknown true com-position of the samples. The merit of using simulated data is that the ground truth is known and thus algo-rithm evaluation can be carried out [27,29].
Synthetic 20-mix spectra with different abundance levels (SNRs)
First, to test the robustness of our algorithm, we gen-erated MS data sets with different signal to noise ratios (SNRs), using the method described in [27]. In fact, the mean signal strength (i.e., peptide abundance) was var-ied while the noise level (i.e., the mean and variance of the noise) was fixed. For each peptide abundance level a, aÎ {500, 2500, 12500}, the simulation was repeated 50 times. In each repetition, 20 true peptides (with
abundance level aand masses randomly selected from
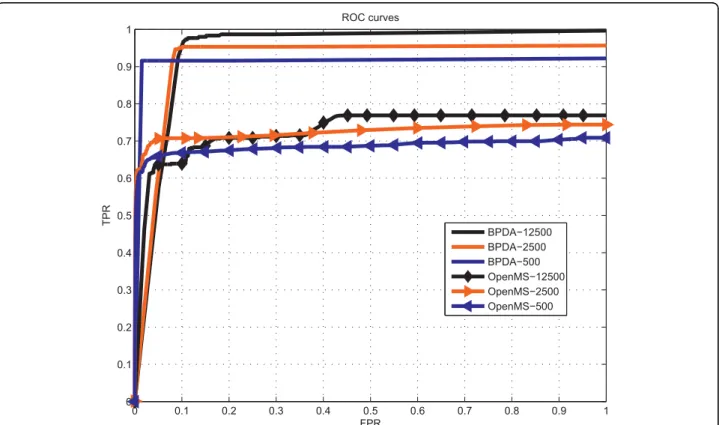
a quality-control Shewanella Oneidensis data set pro-vided by PNNL [33]) served as the input of the data model given by Eq. 3. The charge state distribution of one peptide was modeled by a binomial distribution, which was reported to approximate the real data well [27]. The isotopic distribution was obtained for each peptide by using the Averagine model [22] and the Mercury algorithm [21]. The output consists of a simulated mass spectrum. BPDA was applied to obtain the peptide existence probabilities and abundance results. Its performance was evaluated by the classic Receiver Operating Characteristic (ROC) curve. To obtain the ROC curve, first a series of detection levels
τ ranging from 0 to 1 with 0.001 increments was
selected. Peptides with existence probabilities not less thanτ were said to be detected at this specific detec-tion level. The True Positive Rate (TPR) and False Positive Rate (TPR) were then calculated at each detec-tion level as follows:
TPR TruePositive TruePositive FalseNegative = + and FPR FalsePositive FalsePositive TrueNegative =
+ . One ROC curve
(each point on the curve was a pair of TPR and FPR at one detection level) was plotted for each repetition. And the averaged ROC curve for one abundance level was obtained by averaging all the ROC curves corresponding to the same abundance level. We also applied OpenMS
on the same data sets – to do so, we first wrote the
simulated MS data into a text file with three columns specified by elution time, m/z, and intensity, respec-tively. Next, the text file was converted to mzXML (which is a valid input file format for OpenMS) by the FileConverter tool integrated in the OpenMS software
package [34]. Finally, OpenMS was applied on the mzXML file to give the detection results including detected features and their qualities. The ROC results given by the two algorithms for different abundance levels are shown in Figure 1.
Synthetic 10-mix spectrum with overlapping peptides
As noted before, overlapping peptide peaks can compli-cate the mass spectra and make the detection problem much harder. Thus, we investigated the performance of BPDA in the presence of overlapping peptides. A simu-lated 10-mix spectrum was generated by 5 pairs of over-lapping peptides with unique masses: 1264.279, 1266.383, 1382.247, 1388.367, 1293.323, 1294.345, 1312.441, 1313.451, 1327.386 and 1329.378 Da. The detection results for the comparison between BPDA and OpenMS are summarized in Table 1. BPDA detected all 10 peptides whenFPR= 0.1, with very small mass devia-tions and quite accurate abundance results. Almost all charge states of the 10 true peptides were correctly reported, except for the highest charge state of the 5th and the 9th peptides. These two charge states were missed because the corresponding peptide signal was
very weak. In contrast, whenFPR = 0.1, OpenMS only
detected the 3rd, the 7th and the 9th peptides. And when FPR increased to 0.3, OpenMS achieved its high-est TPR (0.6). But it could detect only one pair of
peptides (the one with the least overlap) and missed one peptide in each of the other 4 pairs. Two examples are given in Figure 2 to illustrate the observed overlapping peptide signals and the detection results. The abundance results given by OpenMS were not close to those of the true peptides (although the total abundance of each
0 0.1 0.2 0.3 0.4 0.5 0.6 0.7 0.8 0.9 1 0 0.1 0.2 0.3 0.4 0.5 0.6 0.7 0.8 0.9 1 ROC curves FPR TPR BPDA−12500 BPDA−2500 BPDA−500 OpenMS−12500 OpenMS−2500 OpenMS−500
Figure 1ROC results for synthetic 20-mix spectra with different abundance levels (SNRs). ROC results for synthetic 20-mix spectra with different abundance levelsa= 500, 2500 and 12500.
Table 1 Results for synthetic 10-mix spectrum with overlapping peptides
BPDA OpenMS True Mass (Da)/Intn/CS dM (Da)/Intn/CS dM (Da)/Intn/CS
1264.279/0.034/1-3 -0.0065/0.032/1-3 NA 1266.383/0.103/1-3 -0.0025/0.110/1-3 -0.0025/0.156/1-3 1382.247/0.171/1-4 0.0028/0.181/1-4 0.0031*/0.228/1-3 1388.367/0.114/1-4 -0.0073/0.097/1-4 -0.0046/0.150/1-3 1293.323/0.006/1-3 -0.0081/0.007/1-2 NA 1294.345/0.008/1-3 -0.0124/0.008/1-3 0.0033/0.018/1-2 1312.441/0.229/1-4 0.0018/0.247/1-4 0.0019*/0.334/1-4 1313.451/0.183/1-4 -0.0061/0.173/1-4 NA 1327.386/0.080/1-4 -0.0035/0.067/1-3 0.0061*/0.114/1-3 1329.378/0.072/1-4 -0.0035/0.078/1-4 NA
Results for the 10-mix data set. Intn, CS and dM denote the normalized intensity, detectable charge states and the mass deviation from the true mass, respectively. When FPR = 0.1, BPDA was able to detect all 10 true peptides, while OpenMS detected only 3 peptides (marked by *). OpenMS achieved its highest TPR (0.6) when FPR = 0.3.
overlapping pair was not far away from the correspond-ing total abundance of the true peptides). In total, 18 out of 36 charge states were correctly detected by OpenMS for the 10 peptides, while BPDA correctly detected 34 out of 36, a much larger number.
We remark that Decon2LS results are missing from both synthetic experiments described previously because the synthetic data could not be loaded, causing the pro-gram to crash (the data was contained in a mzXML file converted from a 3-column text file by the OpenMS FileConverter tool, whose format was successfully veri-fied against mzXML version 2.1). We contacted
Decon2LS’s developers, but did not hear from them in
time to have the Decon2LS results included.
Real data
In this section we report results from experiments car-ried out with real MS data. The test data and parameter files used for different software tools were provided as supplementary files on the BPDA project website. We stick mainly to the recommended parameter values while only adjusted a few parameters such as mass range and detection level to adapt to each data set.
MALDI-TOF MS 7-mix spectrum
We tested BPDA on MALDI-TOF MS 7-mix spectrum, which contained seven standard peptides with monoisoto-pic masses 1045.535, 1295.678, 1346.728, 1618.815, 2092.079, 2464.191 and 3146.464 Dalton [35]. The spec-trum was collected on a Bruker ultraFlex MALDI TOF in the reflectron mode. As stated before, MALDI mostly gen-erates singly charged ions, so we only considered charge state 1 in the test. Since there were contaminants in the data set, the goal was to check whether a detection
algorithm could find all the seven true peptides. The detection results of BPDA, Decon2LS, OpenMS, and the commercial software flexAnalysis developed by Bruker Daltonics [36] are summarized in Table 2. BPDA detected the first six peptides with a mean (absolute) mass devia-tion 0.018 Da. Decon2LS missed the fifth and the last pep-tides, and the five detected peptides were of a mean mass deviation 0.013 Da. OpenMS missed the forth and the last peptides, and the five detected peptides were of a mean mass deviation 0.025 Da. The commercial software flexA-nalysis missed the fifth and the last peptides, and the five detected peptides were of a mean mass deviation 0.013 Da. It can be seen that for the detected peptides, the four algorithms yielded similar intensity results. Only BPDA and OpenMS were able to detect the fifth peptide which had the lowest abundance among the first six peptides. And all methods failed to report the last peptide. Visual inspection suggested that this peptide generated very weak
(a) (b)
Figure 2Illustration of overlapping peptides observed in the synthetic 10-mix spectrum. (a) Overlapping peptide signals observed inm/z
range 422-424.5, which is generated by monoisotopic masses 1264.279 and 1266.383 at charge state 3. OpenMS missed the first one while BPDA detected both. (b) Overlapping peptide signals observed inm/zrange 647-650.5, which is generated by monoisotopic masses 1293.323 and 1294.345 at charge state 2. OpenMS missed the first one while BPDA detected both.
Table 2 Results for the MALDI-TOF MS 7-mix spectrum
BPDA OpenMS Decon2LS Bruker True Masses (Da) dM (Da)/ Intn dM (Da)/ Intn dM (Da)/ Intn dM (Da)/ Intn 1045.535 -0.023/0.550 0.019/0.655 -0.021/0.615 -0.023/0.532 1295.678 0.003/0.173 0.026/0.232 0.002/0.168 -0.001/0.167 1346.728 0.017/0.053 0.040/0.070 0.013/0.050 0.011/0.052 1618.815 0.035/0.178 NA 0.024/0.137 0.022/0.202 2092.079 0.021/0.004 0.021/0.009 NA NA 2464.191 -0.012/0.042 0.020/0.034 -0.007/0.030 -0.009/0.047 3146.464 NA NA NA NA
Results for the 7-mix data set. Intn and dM denote the normalized intensity, and the mass deviation from the true mass, respectively.
signal and its abundance was about one third of the fifth peptide.
High-resolution LC-MS data set MyoLCMS
The preparation of the MyoLCMS data set is detailed as below: the data set was collected from an overnight tryp-tic digest of horse myoglobin. Capillary liquid chromato-graphy-mass spectrometry (cLC/MS) was performed with a splitless nanoLC-2 D pump (Eksigent), a 50 mm-i.d. column packed with 10 cm of 5 mm-o.d. C18 particles, nanoelectrospray and a high-resolution time-of-flight mass spectrometer (MicrOTOF; Bruker Daltonics). The cLC gradient was 2 to 98% 0.1% formic acid/acetonitrile in 172 seconds at 400 nL/min. Sample was injected at a concentration of 60 fmol/mL with an injection volume of 10 mL (600 fmol injected on-column).
There were 172 spectra with am/z range 44.9 to 3005. To apply BPDA, we first grouped peptide elution peaks, as described in the Method section. A total of 17 groups were obtained, each containing 10-20 consecutive spec-tra. A mean spectrum was generated for each group, and BPDA was then applied. The detection results of BPDA, OpenMS, and Decon2LS, which was applied in conjunction with VIPER [37], are summarized in Addi-tional file 3: Table S2 (we also considered the method implemented in the SpecArray package [15], but found
it to be inferior to BPDA, OpenMS, and Decon2LS –
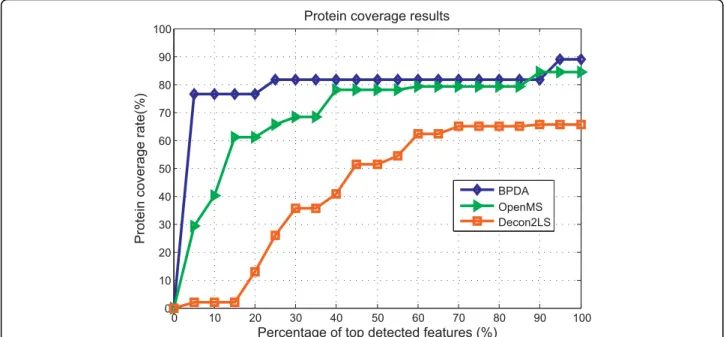
the results were then omitted for the sake of concise-ness). The number of features with unique monoisotopic masses detected by BPDA, OpenMS, and Decon2LS-Viper were 1635, 2176 and 823, respectively. In fact, it is not very informative to evaluate the performance of a detection algorithm solely based on the number of detected features, because of the presence of contami-nants and false positive detections. Therefore, we focus on the top detected features yielded by each detection algorithm. Detected features were ranked by quality in descending order. Different algorithms utilize different quality metrics; for example, Decon2LS and OpenMS provide a quality score which measures how well an observed isotope pattern matches the predicted isotope pattern, while BPDA provides the peptide existence probability (see Eq. 6) as the quality measure. For each detection algorithm, for a given percentage of top detected features, we calculated the number of detected horse myoglobin peptides and the protein coverage rate. Note that by in-silico digestion of horse myoglobin, there are 39 tryptic peptides with less than 2 missed cleavage sites (19 of which do not contain any missed cleavage sites). Ideally, we should compare algorithms with known peptide composition in the sample and report protein coverage at different false positive rates. However, due to possible peptide contamination in the sample in any LC/MS experiment, actual peptide species presented in the sample are never known and this
prevents us from estimating the false positive rates on the reported peptide list. As a result, the statistical sig-nificance of reported peptides by different peptide iden-tification algorithms cannot be evaluated and the only option left for users in hope of obtaining a list of pep-tides with relatively low false positive rate is by applying a percentage threshold on the quality score reported by different algorithms. Thus, protein coverage v.s. percen-tage threshold on quality score is a meaningful measure-ment of the performance of peak detection algorithms and the results are shown in Figure 3. We need to point out that although the protein coverage of OpenMS seems to be comparable with the proposed algorithm in regions where the quality score percentage threshold is large, in such regions the reported peptide list may contain a lot of false positives and it is not an indication of good or bad algorithm performance. Instead, how quickly an algorithm reaches high protein coverage as the percen-tage threshold increases should be the measurement of the performance. In Figure 3, we can see that BPDA reaches high protein coverage much faster than other algorithms at low percentage threshold regions.
Discussion
We observed in our experiments that BPDA performs well on both simulated data and real data, for various SNRs and resolutions, and in complex cases where fea-tures overlap.
For the synthetic 20-mix experiment, we observe in Figure 1 that the sensitivity (i.e., TPR) of BPDA was con-sistently higher than that of OpenMS for each abundance level, and both methods gave better sensitivity results as the abundance level (i.e., SNR) increased. Also it is observed that BPDA was quite robust for different SNRs. For the synthetic 10-mix experiment with overlapping peptides, we saw that BPDA detected all the peptides at a small false-positive rateFPR= 0.1, with very small mass deviations and quite accurate abundance results, and nearly all the charge states of the 10 true peptides were
correctly reported. In contrast, atFPR= 0.1, OpenMS
could detect only a few of the peptides. The abundance results given by OpenMS were not very close to those of the true peptides. Also OpenMS could only detect about half of the charge states.
The results obtained with real data corroborated the findings made with the synthetic experiments. For the MALDI-TOF MS 7-mix data, the four algorithms yielded similar intensity results, but BPDA was the only one to detect six out of the seven peptides. For the MyoLCMS experiment, we focused on protein coverage results, which is an important criterion to determine the confidence in protein identification and quantification [38,39]. It was observed that BPDA displayed the largest protein coverage among the programs tested.
Conclusions
We have presented BPDA, a Bayesian approach for peptide detection. Feature extraction in MS analysis is difficult because peptides can register multiple peaks. We model peptide signals based on both charge state distributions and isotopic distributions. And unlike perviously published methods, where the detection only utilizes isotopic distributions and works at each single charge state alone, BPDA takes into account the charge state distribution as well, and performs deiso-toping and charge state deconvolution at the same time, thus lending information to better identify weak peptide signals and produce more robust results. Moreover, the proposed approach is systematic. It is based on a rigorous statistical framework and avoids problems, such as voting, thresholding and matching ambiguities, generally encountered in algorithms based on template matching.
We have shown that BPDA performs well on both simulated data and real data, for various SNRs and resolutions, and in complex cases where features over-lap. Our experimental results indicate that BPDA com-pares very favorably with commercial software flexAnalysis and commonly used open-source soft-wares such as OpenMS and Decon2LS in terms of detection performance. As for computational time, BPDA is a global-based approach, which looks for the optimal solution iteratively through Gibbs sampling, while template-matching based algorithms such as OpenMS and Decon2LS work on a local region at a time and calculate the fitting score, which typically does not require much computation. Hence, BPDA is
expected to be more time-consuming than those algo-rithms, especially when running under the raw data mode. For example, for 10-mix data set, the running times for OpenMS and BPDA were 1 minutes and 30
minutes, respectively – although these figures are not
entirely comparable at present, since OpenMS and Decon2LS are developed using the C programming language, while BPDA is developed using Matlab; we plan to translate the Matlab code into C in future work. In addition, we point out that the user can choose the centroid mode to run BPDA as a tradeoff between running time and performance.
Availability and requirements
Project name:BPDA
Project home page:http://gsp.tamu.edu/Publications/ supplementary/sun10a/bpda
Operating system(s):Platform independent
Programming language:Matlab
Licence:GNU GPL (note that we do not allow mate-rial transfer agreements or software transfer agreements for academics)
Any restrictions to use by non-academics: licence needed.
Additional material
Additional file 1: Suppl file 1: Detailed derivations of the likelihood, the prior distributions and the conditional posterior distributions of model parameters.
Additional file 2: Table S1: The pseudocode of the Gibbs sampling process. 0 10 20 30 40 50 60 70 80 90 100 0 10 20 30 40 50 60 70 80 90 100
Protein coverage results
Percentage of top detected features (%)
Protein coverage rate(%)
BPDA OpenMS Decon2LS
Additional file 3: Table S2: Detection results for high-resolution LC-MS data set MyoLCLC-MS.
Acknowledgements
The authors thank the support of the Partnership for Personalized Medicine (PPM) project, through Translational Genomics (TGen) contract C08-00904. The authors thank the RCMI Proteomics Core at UTSA (NIH G12 RR013646) for assistance with experiment design, sample preparation and data collection for the horse myoglobin data. The authors thank the Cancer Biology and Infectious Diseases Research Center at the Eastern Virginia Medical School for the peptide standard data collected on the Bruker Ultra flex MALDI-TOF. Jianqiu Zhang’s research is supported by a San Antonio Life Science Institute research enhancement grant and a grant with award number G12RR013646 from the National Center For Research Resources, USA.
Author details 1
Department of Electrical and Computer Engineering, Texas A&M University, College Station, TX 77843, USA.2Department of Electrical and Computer
Engineering, University of Texas at San Antonio, San Antonio, TX 78249, USA.
3Computational Biology Division, Translational Genomics Research Institution,
Phoenix, AZ 85004, USA.4Department of Bioinformatics and Computational
Biology, University of Texas M.D. Anderson Cancer Center, Houston, TX 77030, USA.
Authors’contributions
YS developed and implemented the algorithm, conducted all simulations and wrote the initial draft of the paper. JZ conceived the algorithm, advised YS on algorithm development and revised the paper. UBN advised YS on the numerical experiments and revised the paper. ERD revised the paper.All authors read and approved the final manuscript.
Received: 1 June 2010 Accepted: 29 September 2010 Published: 29 September 2010
References
1. Hop C, Bakhtiar R:An introduction to electrospray ionization and matrix-assisted laser desorption/ionization mass spectrometry: essential tools in a modern biotechnology environment.Biospectroscopy1997,3:259-280. 2. Karas M, Bahr U:Laser desorption ionization mass spectrometry of large
biomolecules.Trends Anal Chem1990,9:321-325.
3. Batoy S, Akhmetova E, Miladinovic S, Smeal J, Wilkins CL:Developments in MALDI mass spectrometry: the quest for the perfect matrix.Appl Spectrosc Rev2008,43:485-550.
4. Hu Q, Noll RJ, Li H, Makarov A, Hardman M, Graham Cooks R:The Orbitrap: a new mass spectrometer.Journal of mass spectrometry2005,40:430-443. 5. Todd JFJ, March RE:Quadrupole ion trap mass spectrometryNew York, NY,
USA: Wiley-Interscience 2005.
6. Wollnik H:Time-of-flight mass analyzers.Mass Spectrometry Reviews1993,
12:89-11.
7. Chernushevich IV, Loboda AV, Thomson BA:An introduction to quadrupole-time-of-flight mass spectrometry.J Mass Spectrom2001,
36:849-865.
8. Gross ML, Rempel DL:Fourier transform mass spectrometry.Science1984,
226:261-268.
9. Zhang J, Gonzalez E, Hestilow T, Haskins W, Huang Y:Review of peak detection algorithms in liquid-chromatography-mass spectrometry.Curr Genomics2009,10:388-401.
10. Du P, Angeletti RH:Automatic Deconvolution of Isotope-Resolved Mass Spectra Using Variable Selection and Quantized Peptide Mass Distribution.Anal Chem2006,78:3385-3392.
11. Morris JS, Coombes KR, Koomen J, Baggerly KA, Kobayashi R:Feature extraction and quantification for mass spectrometry in biomedical applications using the mean spectrum.Bioinformatics2005,21:1764-1775. 12. Coombes KR, Tsavachidis S, Morris JS, Baggerly KA, Hung MC, Kuerer HM:
Improved peak detection and quantification of mass spectrometry data
acquired from surface-enhanced laser desorption and ionization by denoising spectra with the undecimated discrete wavelet transform.
Proteomics2005,5:4107-4117.
13. Du P, Kibbe WA, Lin SM:Improved peak detection in mass spectrum by incorporating continuous wavelet transform-based pattern matching.
Bioinformatics2006,22:2059-2065.
14. Wang Y, Zhou X, Wang H, Li K, Yao L, Wong STC:Reversible jump MCMC approach for peak identification for stroke SELDI mass spectrometry using mixture model.Bioinformatics2008,24:i407-i413.
15. Li X, Yi EC, Kemp CJ, Zhang H, Aebersold R:A software suite for the generation and comparison of peptide arrays from sets of data collected by liquid chromatography-mass spectrometry.S Mol Cell Proteom2005,4:1328-1340.
16. Bellew M, Coram M, Fitzgibbon M, Igra M, Randolph T, Wang P, May D, Eng J, Fang R, Lin C, Chen J, Goodlett D, Whiteaker J, Paulovich A, McIntosh M:A suite of algorithms for the comprehensive analysis of complex protein mixtures using high-resolution LC-MS.Bioinformatics
2006,22(15):1902-909.
17. Noy K, Fasulo D:Improved model-based, platform-independent feature extraction for mass spectrometry.Bioinformatics2007,23:2528-2535. 18. Jaitly N, Mayampurath A, Littlefield K, Adkins JN, Anderson GA, Smith RD:
Decon2LS: An open-source software package for automated processing and visualization of high resolution mass spectrometry data.BMC bioinformatics2009,10:87.
19. Sturm M, Bertsch A, Gröpl C, Hildebrandt A, Hussong R, Lange E, Pfeifer N, Schulz-Trieglaff O, Zerck A, Reinert K, Kohlbacher O:OpenMS - An open-source software framework for mass spectrometry.BMC Bioinformatics
2008,9:163.
20. Yergey JA:A general approach to calculating isotopic distributions for mass spectrometry.Int J Mass Spectrom Ion Phys1983,52:337-349. 21. Rockwood AL, Van Orden SL, Smith R:Rapid cacluation of isotope
distributions.Anal Chem1995,67:2699-2704.
22. Horn DM, Zubarev RA, McLafferty FW:Automated reduction and interpretation of high resolution electrospray mass spectra of large molecules.Journal of the American Society for Mass Spectrometry2000,
11(4):320-332.
23. Zhang J, Wang H, Suffredini A, Gonzales D, Gonzales E, Huang Y, Zhou X:
Bayesian peak detection for pro-TOF MS MALDI data.Proc of IEEE International Conference on Acoustics, Speech and Signal Processing (ICASSP)
Las Vegas, NV, USA 2008, 661-664.
24. Du P, Sudha R, Prystowsky MB, Angeletti RH:Data reduction of isotope-resolved LC-MS spectra.Bioinformatics2007,23:1394-1400.
25. Keller A, Nesvizhskii AI, Kolker E, Aebersold R:Empirical statistical model to estimate the accuracy of peptide identifications made by MS/MS and database search.Anal Chem2002,74:5383-5392.
26. Matlab mspeaks.[http://www.mathworks.com/access/helpdesk/help/ toolbox/bioinfo/ref/mspeaks.html].
27. Schulz-Trieglaff O, Pfeifer N, Gröpl C, Kohlbacher O, Reinert K:LC-MSsim - a simulation software for liquid chromatography mass spectrometry data.
BMC Bioinformatics2008,9:423.
28. Du P, Stolovitzky G, Horvatovich P, Bischoff R, Lim J, Suits F:A noise model for mass spectrometry based proteomics.Bioinformatics2008,
24:1070-1077.
29. Coombes KR:Understanding the characteristics of mass spectrometry data through the use of simulation.Cancer Informatics2005,1:41-52. 30. Geman S, Geman D:Stochastic relaxation, Gibbs distributions, and the
Bayesian restoration of images.IEEE Trans Pattern Anal Mach Intell1984,
6:721-741.
31. Robert CP, Casella G:Monte Carlo Statistical MethodsNew York, NY, USA: Springer 2004.
32. Duda R, Hart P:Pattern ClassificationNew York, NY, USA: JohnWiley&Sons 2001.
33. Shewanella Oneidensis data set.[http://omics.pnl.gov]. 34. OpenMS/TOPP website.[http://open-ms.sourceforge.net].
35. Bruker peptide calibration standard. [http://www2.bdal.de/data/care-online_data/206195/PI_206195_Peptide%20Cal%20Stand_V2.pdf]. 36. Bruker Daltonics website.[http://www.bdal.de].
37. Monroe ME, Tolic N, Jaitly N, Shaw JL, Adkins JN, Smith RD:VIPER: an advanced software package to support high-throughput LC-MS peptide identification.Bioinformatics2007,23(15):2021-2023.
38. Stead DA, Preece A, Brown JP:Universal metrics for quality assessment of protein identifications by mass spectrometry.Mol Cell Prot2006,
5:1205-1211.
39. McHugh L, Arthur JW:Computational Methods for Protein Identification from Mass Spectrometry Data.PLoS Comput Biol2008,4:e12.
doi:10.1186/1471-2105-11-490
Cite this article as:Sunet al.:BPDA - A Bayesian peptide detection algorithm for mass spectrometry.BMC Bioinformatics201011:490.
Submit your next manuscript to BioMed Central and take full advantage of:
• Convenient online submission • Thorough peer review
• No space constraints or color figure charges • Immediate publication on acceptance
• Inclusion in PubMed, CAS, Scopus and Google Scholar • Research which is freely available for redistribution Submit your manuscript at