Archive University of Zurich Main Library Strickhofstrasse 39 CH-8057 Zurich www.zora.uzh.ch Year: 2020
On the relation between avalanche occurrence and avalanche danger level
Schweizer, Jürg ; Mitterer, Christoph ; Techel, Frank ; Stoffel, Andreas ; Reuter, BenjaminAbstract: In many countries with seasonally snow-covered mountain ranges warnings are issued to alert the public about imminent avalanche danger, mostly employing an ordinal, five-level danger scale. How-ever, as avalanche danger cannot be measured, the characterization of avalanche danger remains qual-itative. The probability of avalanche occurrence in combination with the expected avalanche type and size decide on the degree of danger in a given forecast region (100 km2). To describe avalanche occur-rence probability, the snowpack stability and its spatial distribution need to be assessed. To quantify the relation between avalanche occurrence and avalanche danger level, we analyzed a large data set of visually observed avalanches (13 918 in total) from the region of Davos (eastern Swiss Alps, 300 km2), all with mapped outlines, and we compared the avalanche activity to the forecast danger level on the day of occurrence (3533 danger ratings). The number of avalanches per day strongly increased with increasing danger level, confirming that not only the release probability but also the frequency of locations with a weakness in the snowpack where avalanches may initiate from increase within a region. Avalanche size did not generally increase with increasing avalanche danger level, suggesting that avalanche size may be of secondary importance compared to snowpack stability and its distribution when assessing the danger level. Moreover, the frequency of wet-snow avalanches was found to be higher than the frequency of dry-snow avalanches for a given day and danger level; also, wet-snow avalanches tended to be larger. This finding may indicate that the danger scale is not used consistently with regard to avalanche type. Even though observed avalanche occurrence and avalanche danger level are subject to uncertainties, our findings on the characteristics of avalanche activity suggest reworking the definitions of the European avalanche danger scale. The description of the danger levels can be improved, in particular by quantify-ing some of the many proportional quantifiers. For instance, based on our analyses, “many avalanches”, expected at danger level 4-High, means on the order of at least 10 avalanches per 100 km2. Whereas our data set is one of the most comprehensive, visually observed avalanche records are known to be inherently incomplete so that our results often refer to a lower limit and should be confirmed using other similarly comprehensive data sets.
DOI: https://doi.org/10.5194/tc-14-737-2020
Posted at the Zurich Open Repository and Archive, University of Zurich ZORA URL: https://doi.org/10.5167/uzh-186121
Journal Article Published Version
The following work is licensed under a Creative Commons: Attribution 4.0 International (CC BY 4.0) License.
Schweizer, Jürg; Mitterer, Christoph; Techel, Frank; Stoffel, Andreas; Reuter, Benjamin (2020). On the relation between avalanche occurrence and avalanche danger level. The Cryosphere, 14(2):737-750. DOI: https://doi.org/10.5194/tc-14-737-2020
https://doi.org/10.5194/tc-14-737-2020
© Author(s) 2020. This work is distributed under the Creative Commons Attribution 4.0 License.
On the relation between avalanche occurrence
and avalanche danger level
Jürg Schweizer1, Christoph Mitterer2, Frank Techel1, Andreas Stoffel1, and Benjamin Reuter1,3
1WSL Institute for Snow and Avalanche Research SLF, Davos, Switzerland 2Avalanche Forecasting Service Tyrol, Innsbruck, Austria
3Météo France, CNRS, CNRM, Centre d’Étude de la Neige, Grenoble, France
Correspondence:Jürg Schweizer ([email protected])
Received: 21 September 2019 – Discussion started: 30 September 2019
Revised: 28 January 2020 – Accepted: 31 January 2020 – Published: 2 March 2020 Abstract. In many countries with seasonally snow-covered
mountain ranges warnings are issued to alert the public about imminent avalanche danger, mostly employing an ordinal, five-level danger scale. However, as avalanche danger can-not be measured, the characterization of avalanche danger remains qualitative. The probability of avalanche occurrence in combination with the expected avalanche type and size decide on the degree of danger in a given forecast region (&100 km2). To describe avalanche occurrence probability,
the snowpack stability and its spatial distribution need to be assessed. To quantify the relation between avalanche occur-rence and avalanche danger level, we analyzed a large data set of visually observed avalanches (13 918 in total) from the region of Davos (eastern Swiss Alps, ∼300 km2), all with mapped outlines, and we compared the avalanche activity to the forecast danger level on the day of occurrence (3533 danger ratings). The number of avalanches per day strongly increased with increasing danger level, confirming that not only the release probability but also the frequency of loca-tions with a weakness in the snowpack where avalanches may initiate from increase within a region. Avalanche size did not generally increase with increasing avalanche danger level, suggesting that avalanche size may be of secondary importance compared to snowpack stability and its distri-bution when assessing the danger level. Moreover, the fre-quency of wet-snow avalanches was found to be higher than the frequency of dry-snow avalanches for a given day and danger level; also, wet-snow avalanches tended to be larger. This finding may indicate that the danger scale is not used consistently with regard to avalanche type. Even though ob-served avalanche occurrence and avalanche danger level are
subject to uncertainties, our findings on the characteristics of avalanche activity suggest reworking the definitions of the European avalanche danger scale. The description of the dan-ger levels can be improved, in particular by quantifying some of the many proportional quantifiers. For instance, based on our analyses, “many avalanches”, expected at danger level 4-High, means on the order of at least 10 avalanches per 100 km2. Whereas our data set is one of the most compre-hensive, visually observed avalanche records are known to be inherently incomplete so that our results often refer to a lower limit and should be confirmed using other similarly comprehensive data sets.
1 Introduction
Avalanche forecasting was described by McClung (2002) as the prediction of snow instability in space and time relative to a given triggering level. The main sources of uncertainty in forecasting are the unknown temporal evolution and the spa-tial variations in instability in the snow cover. For these rea-sons predictability of snow avalanche occurrence is limited; it is inversely related to scale, i.e., a probability of occurrence can be given at the regional scale, but not at the scale of a sin-gle avalanche path (Schweizer, 2008). In forecasting of natu-ral systems, in which variations may or may not be random, a distinction is often made between forecasting and prediction. In our case, prediction means precisely defining when and where an avalanche occurs. Forecasting, on the other hand, implies describing the probability of avalanche occurrence within a certain time frame and area. Given these definitions
it is obvious that prediction is not possible – even though it would be desirable – whereas forecasting is certainly possi-ble but inherently includes uncertainty as the forecast is prob-abilistic (Silver, 2012).
Even if avalanche forecasting is probabilistic and includes uncertainty, it should be grounded in clear definitions and un-certainty should not stem from ambiguous definitions but the nature of the problem. In public forecasting, i.e., issuing bul-letins describing the avalanche situation, avalanche hazard is described by one of five avalanche danger levels. The danger levels (1-Low, 2-Moderate, 3-Considerable, 4-High, 5-Very High) are defined in the avalanche danger scale that was orig-inally agreed upon by the European Avalanche Warning Ser-vices in 1993 (EAWS, 2019a; Meister, 1995). Subsequently, a very similar five-level scale was adopted in North Amer-ica (Dennis and Moore, 1997), which was later revised with an emphasis on risk communication (Statham et al., 2010). In the original European danger scale, the avalanche danger lev-els were defined in terms of the release (or triggering) prob-ability, the frequency and location of triggering spots, and the potential avalanche size. All three elements are supposed to be combined when assigning a danger level to a given avalanche situation. Moreover, it is assumed that all three elements increase with increasing avalanche hazard. How-ever, the definitions for the different danger levels are short, qualitative descriptions and leave room for widely varying interpretations (Müller et al., 2016a). Not surprisingly, a re-cent study that looked at forecast differences across borders of contiguous forecast areas suggests that remarkable incon-sistencies in the application of the danger levels exist (Techel et al., 2018). Based on a survey among forecasters, Lazar et al. (2016) also found substantial differences in assigning a single danger rating to a given scenario of avalanche condi-tions. These studies demonstrate that there is a lack of quan-tification with regard to the three key elements and their links in the avalanche danger scale.
This lack of formal underpinnings, among other rea-sons, motivated the development of a conceptual model of avalanche hazard in North America, which essentially for-malizes the hazard assessment process (Statham et al., 2018). However, the final step on how to derive the danger level is not described. In Europe, the so-called Bavarian matrix was developed to support the decision process in forecasting. It is basically a look-up table that allows assignment of the danger level based on the probability of avalanche release and the frequency of triggering spots (Müller et al., 2016a). Avalanche size is not explicitly considered in the Bavarian matrix. Hence, recent developments in Europe were aiming at including avalanche size and harmonizing the European with the North American approach. To this end, an approach with two matrices, a so-called likelihood matrix and a danger matrix, was suggested in an attempt to merge the concepts behind the conceptual model of avalanche hazard with the Bavarian matrix (Müller et al., 2016a, b). Also, a version of
the Bavarian matrix including avalanche size was suggested (EAWS, 2020).
There are few data-driven studies that link the avalanche danger level to any of the three key elements. Haegeli et al. (2012) analyzed 2 years of public avalanche forecasts with underlying hazard assessments by Avalanche Canada. They found that the maximum likelihood of triggering had the strongest impact on danger rating selection; the sec-ond most important predictor variable was the maximum expected avalanche size. More recent analyses on the re-lation between the components of the conceptual model of avalanche hazard and the danger ratings showed that identi-cal avalanche scenarios were often rated differently – pos-sibly indicating substantial inconsistencies in the forecast-ing process. This findforecast-ing is likely due to the lack of explic-itly assigning danger ratings to the various combinations in the likelihood–magnitude chart (Clark and Haegeli, 2018; Clark, 2019).
The avalanche danger levels can also be characterized with observational data related to snow instability. In the context of a verification campaign, Schweizer et al. (2003) estab-lished typical stability distributions for the danger levels 1-Low, 2-Moderate and 3-Considerable based on many snow instability tests for single avalanche situations. Likewise, signs of instability such as whumpfs, shooting cracks and re-cent avalanching were related to the danger levels (Jamieson et al., 2009a; Schweizer, 2010). As shooting cracks were almost 10 times more frequent at level 3-Considerable (or higher) than at level 2-Moderate (or lower), they had the most predicting power in a simple classification tree. Avalanche activity was only considered as a binary variable, which does not allow insight into the avalanche characteristics at a given danger level.
Given the lack of quantitative definitions in the avalanche danger scale, our aim is to characterize avalanche activity with regard to avalanche hazard. We therefore analyzed a large data set of avalanche observations from the region of Davos (eastern Swiss Alps) and compared the avalanche ac-tivity to the avalanche danger forecast. Though both variables are subject to uncertainty, we aim at characterizing the dan-ger levels based on frequency, type and size of avalanche oc-currence.
2 Data and methods
We analyzed a 21-year data set of manually observed avalanche occurrences from the region of Davos, an area of about 300 km2. Large parts of the study area ranging
between 1200 and 3200 m a.s.l. are steep mountain terrain. According to the avalanche terrain classification (CAT) by Harvey et al. (2018), about 67 % of our study area is con-sidered avalanche terrain. The snow climate in the region of Davos can be described as transitional (McClung and Schaerer, 2006).
Data cover the winters from 1998–1999 to 2018–2019 and include 13 918 individual avalanches, which were all mapped (Fig. S1 in the Supplement). Avalanches were recorded on a daily basis by SLF as well as by ski resort staff. In the more remote parts of the study area the observations are in general less consistent. Also, during the first 6 years, fewer avalanches were recorded than during the rest of the study period.
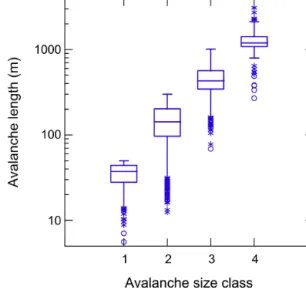
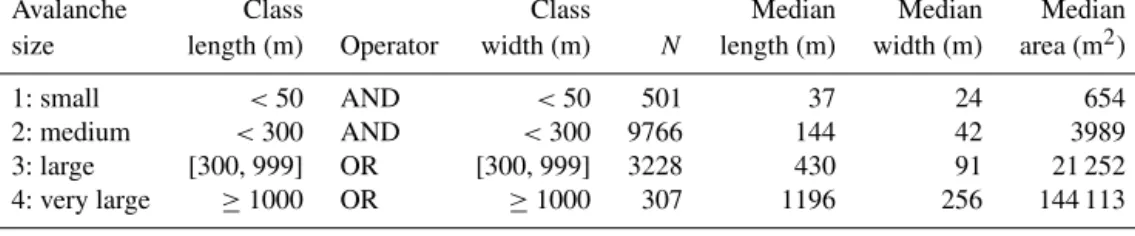
For each avalanche, we derived avalanche length L and widthWfrom a rectangle of the smallest width enclosing the mapped perimeter using the “minimum boundary geometry” tool in ArcGIS. Based on these values of avalanche length and width, we assigned the avalanche size class (1 to 4) ac-cording to the Canadian size classification (McClung and Schaerer, 2006). Since avalanches of size class 5 were rare (L >2000 m and W >300 m;N=11), we assigned those to class 4. Moreover, 116 avalanches were too small to de-rive meaningful values of length and width, but were still as-signed an avalanche size of 1 (henceN=13 802 in Table 1 and Fig. 1). Table 1 describes the criteria for size classifica-tion. Also given are the resulting median length, width and area per size class for our data set.
Figure 1 shows that our size classification based on mapped outlines reproduced the exponential increase that un-derlies the original proposal for the size classification well (McClung and Schaerer, 1981). They suggested classifying avalanche size S based on mass and proposed five classes whereS=logM, withMthe avalanche mass given in tens of metric tons. Their intention was to derive a classification that is based on destructive power, which in the end is re-lated to volume or length. Figure 1 suggests that estimating avalanche size based on avalanche length seems indeed fea-sible.
In addition, the avalanche records included information on the type of triggering (natural, person, explosives/snow grooming machine, unknown) and the type of snow condi-tions. The snow conditions relate to the liquid water con-tent in the starting zone (dry, wet, mixed, unknown). Dry and wet refer to dry-snow and wet-snow avalanches, respectively, whereas mixed is less well defined and typically refers to avalanches with dry-snow conditions in the starting zone but wet-snow conditions in the track or runout zone. Our records of avalanche observations cover 1358 individual days.
We calculated the avalanche activity index (AAI) for each day using the usual weights for size classes 1 to 4, namely 0.01, 0.1, 1 and 10, respectively (Schweizer et al., 2003). Moreover, we considered the type of trigger-ing ustrigger-ing weights, namely 1 for natural avalanches, 0.5 for human-triggered avalanches and 0.2 for the other artificially triggered avalanches (Föhn and Schweizer, 1995). For the avalanches with an unknown trigger we assigned a weight of 0.81 since this was the weighted average of the trigger-ing weight considertrigger-ing the frequency of avalanches for the three known triggering classes. In fact, almost all of the avalanches in the unknown triggering class were likely
natu-Figure 1.Distribution of avalanche length per avalanche size class for the 21-year data set of avalanche observations from the region of Davos applying the classification criteria given in Table 1. Boxes span the interquartile range from the first to third quartiles with a horizontal line showing the median. Whiskers show the range of ob-served values that fall within 1.5 times the interquartile range above the third and below the first quartiles. Asterisks and open circles re-fer to outliers and far outliers beyond the fences. Numbers indicate avalanches per class; total number of avalanches:N=13 802.
ral avalanches so that a weight of 0.81 was appropriate. We also calculated the individual AAI for the combinations of the various types of triggering and types of snow conditions. We then merged the data set of avalanche observations with the avalanche danger as forecast in the public bulletin for that day and the region of Davos; the forecasting region is smaller than our study area but is representative as it is lo-cated well in the study area center where most avalanches were recorded. For a total of 3533 d a danger rating was available. Some of the avalanches occurred outside the pe-riod when public forecasts were issued, e.g., in October or late May, and were not included for further analysis. This re-duced the total number of observed avalanches to 13 745 and the number of days when at least one avalanche was recorded to 1301. This means about every third day (37 %) with a dan-ger rating at least one avalanche was observed for the 21-year period we analyzed.
As independent data to verify the issued danger level are not available for the entire data set, we compared the avalanche activity observed on a given day to the forecast danger level on that day. Nevertheless, we did some obvious data checking. For instance, at level 4-High we expect many natural avalanches. Indeed, the two highest danger levels can be verified by avalanche activity. Therefore, we scrutinized the forecast danger levels and adjusted them to the most re-alistic values. All these corrections are summarized in Ta-ble S1 in the Supplement. We first checked the days with the highest danger levels, since in these cases erroneous
fore-Table 1. Definition of avalanche size based on length and width of avalanche. Resulting median length, width and area per size class (N=13 802).
Avalanche Class Class Median Median Median
size length (m) Operator width (m) N length (m) width (m) area (m2)
1: small <50 AND <50 501 37 24 654
2: medium <300 AND <300 9766 144 42 3989
3: large [300, 999] OR [300, 999] 3228 430 91 21 252
4: very large ≥1000 OR ≥1000 307 1196 256 144 113
casts can most easily be detected: when the danger level was 4-High and no avalanches were observed, the forecast was either too high or the avalanche observations were not cor-rectly assigned to the day of occurrence (but rather the day of observation).
We therefore started the correction process by checking the avalanche activity on the 51 d when the danger rating was either 4-High or 5-Very High (47 and 4 d, respectively). We found that on 30 out of 51 d the avalanche activity was zero or unusually low. For each of these days, we revisited the weather, snow and avalanche conditions in the relevant period. For 23 out of the 30 d we down-rated the danger. For the remaining 7 d we corrected a temporal mismatch between the date the hazard peaked and the date avalanches were reg-istered. For example, occasionally all avalanche observations from a 3 d storm had been assigned to the first or last day of the storm. For 1 out of these 7 d we increased the danger level from 4-High to 5-Very High. This reduced the number of days with rating 4-High from 47 to 25 and with rating 5-Very High from 4 to 3. Still, on 1 d with danger rating 4-High no avalanches were observed; this seems unlikely, but it was not possible to reconstruct the likely date of occurrence in that well-known storm period in February 1999. Unfortu-nately, records were in general rather inconsistent during the major storms in January and February 1999. For 1 d in Jan-uary 2018, when the forecast danger level was 4-High and the avalanche activity very prominent (AAI=158) a detailed verification revealed (Bründl et al., 2019) that the forecast danger level should have been 5-Very High. This increased the total number of days with danger level 5-Very High to 4-High. Hence, after these corrections, the danger rating was 5-Very High on 4 d, 4-High on 25 d and 3-Considerable on the remaining 22 d.
The median AAI of natural avalanches for the days with a danger rating of either 4-High or 5-Very High was 13.6, which corresponds to, for instance, only one avalanche of size 4 and a few smaller avalanches. Further quality check-ing revealed that there were a number of days with higher avalanche activity but lower danger level. In total on 59 d, the avalanche danger was rated level 3-Considerable, but many natural avalanches occurred. This was also the case for 17 d, when danger level 2-Moderate was forecast. Again, we checked all these cases against the weather, snow and
avalanche conditions. For 57 of these 59 d we increased the rating from level 3-Considerable to 4-High since the AAI clearly indicated that the avalanche activity had been un-derestimated at the time of the forecast. On the remaining 2 d the number of natural avalanches was too low (<10) to justify a change. For 12 out of 17 d with forecast dan-ger level 2-Moderate, we changed the dandan-ger level to 4-High as many avalanches were observed, in most cases wet-snow avalanches, and the AAI was high. On the remaining 5 d we changed the danger level to 3-Considerable as the total num-ber of natural avalanches was too low (<10).
Subsequently, we considered the number of cases with level 2-Moderate danger but an avalanche activity (only natu-rals) higher than the median index (1.0) for days with level 3-Considerable danger. There were 99 d with AAI>1.0. In 25 of these cases, the number of avalanches (size 2 and larger) was larger than 10. For these 27 d we changed the danger rat-ing to level 3-Considerable. In 19 out of these 27 cases the avalanches were wet-snow avalanches. Finally, we adjusted the danger level from level 1-Low to 3-Considerable for 2 d, one with high natural wet-snow avalanche activity and the other with several skier-triggered avalanches.
Overall, we changed 129 out of the 3533 danger ratings (3.7 %), mostly by one danger level, occasionally by two dan-ger levels (12 %); in most cases (106 out of 129: 82 %) we in-creased the danger rating since there was clearly a rather high activity of natural avalanches. In total, there were finally 94 d (2.7 %) with a danger rating of level 4-High, still fairly few for 21 winter seasons.
For the analyses, we stratified the data into the dan-ger levels and compared the avalanche activity index (AAI; Schweizer et al., 2003), the proportion of avalanche sizes, the proportion of days when avalanches were observed and the average number of avalanches per day.
The number of avalanches per day relates to the probabil-ity of avalanche occurrence in our study area, i.e., one metric integrating snow stability and its distribution. The lower sta-bility is and the more frequent the triggering locations are, the more avalanches are observed.
To compare distributions, we used the nonparametric Mann–WhitneyU test. We selected a level of significance p=0.05 to judge whether the observed differences were sig-nificant. We also checked for equality of proportions in 2×2
contingency tables, for instance, to decide whether the pro-portion of size 2 avalanches was equal for two different dan-ger levels. Relations of continuous data such as the AAI with ordinal variables were described with the Spearman rank-order correlation coefficientrs(Spiegel and Stephens, 1999).
3 Results
3.1 Avalanche activity
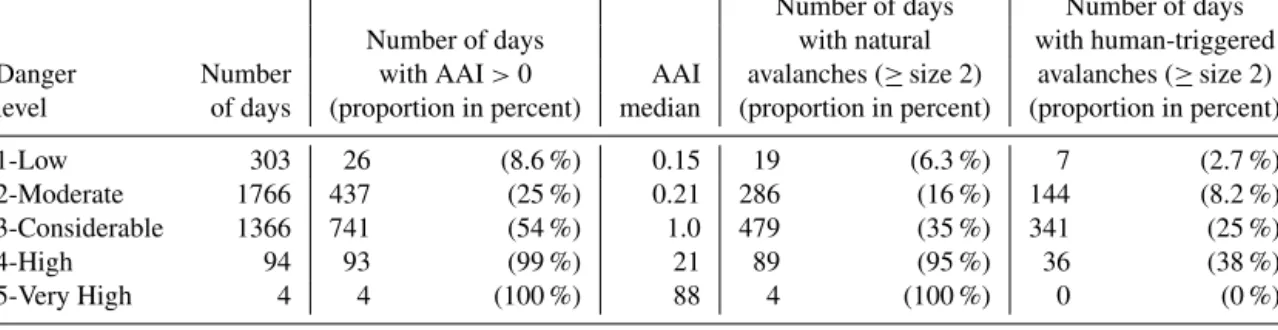
Figure 2 shows the avalanche activity index including all avalanches irrespective of triggering type or snow conditions, and Table 2 summarizes some key figures on the avalanche activity with respect to danger level. The avalanche activ-ity, expressed as AAI, increased with increasing danger level (rs=0.42,p <0.001). The median values were 0.15, 0.21, 1, 21 and 88 for the avalanche danger levels 1-Low to 5-Very High. The increase was particularly prominent from level 3-Considerable to 4-High. The highest values with AAI>145 correspond to four distinct, well-known avalanche periods in the region of Davos: 23 April 2008, 9 March 2017, 22 Jan-uary 2018 and 14 JanJan-uary 2019. There were only 4 d with danger level 5-Very High so that the corresponding AAI statistics are indicative at best.
The proportion of days when avalanches were observed at a given danger level (AAI>0) increased from about 9 % at level 1-Low to 99 % for level 4-High (Table 2). If only natu-ral avalanches were considered, these proportions were 6 %, 16 %, 35 % and 95 %. At level 1-Low, natural avalanches were observed on only 1 out of 16 d when this danger level was forecast. At level 3-Considerable, natural avalanches were recorded every third day and at level 4-High on almost all days. This increase in the proportion of avalanche days primarily reflects that snow stability decreases with increas-ing danger level.
Moreover, the number of observed natural avalanches in-creased with increasing danger level. At the lower dan-ger levels 1-Low and 2-Moderate, the median number of avalanches on a day with avalanche activity was 1; at level 3-Considerable the median number increased to 3, with an even stronger increase to 22 natural avalanches per day at level 4-High. As the avalanche records are likely incomplete for 2 out of 4 d with danger level 5-Very High, the median num-ber of natural avalanches per day was only 19. This promi-nent increase in natural avalanche activity with increasing danger level is also evident in the AAI (only considering natural avalanches; median value): 0.1, 0.1, 0.2, 20 and 76 for the danger levels 1-Low to 5-Very High, respectively. The increase in the AAI or the number of avalanches per day reflects the increasing avalanche occurrence probability with increasing danger level. The prominent increase is due to decreasing snow stability and at the same time increas-ing frequency of locations with poor snow stability where avalanches can initiate from.
Figure 2.Avalanche activity index (AAI) per danger level (1-Low, to 5-Very High). Only days with AAI>0 are included. Numbers indicate number of days per danger level; total number of days:N=
1301.
Whereas the number of natural avalanches steadily in-creased with increasing danger level, the relation differed for the human-triggered avalanches – mainly at the higher dan-ger levels. The proportion of days with at least one human-triggered avalanche (≥size 2) prominently increased from levels 1-Low to 3-Considerable (Table 2), about tripling from one danger level to the next; it less prominently increased to level 4-High, but was 0 at level 5-Very High – indicating that fewer people expose themselves to the hazard. The respective proportions were about 3 %, 8 %, 25 %, 38 % and 0 %.
Hence, triggering at the danger levels 1-Low and 2-Moderate was rather rare. In the case a human-triggered avalanche was observed (≥size 2) when the forecast avalanche danger level was 1-Low or 2-Moderate, this avalanche was in most cases (67 % and 68 %, respectively) the only one. In the case of natural avalanches, these propor-tions were lower, 47 % for level 1-Low and 48 % for level 2-Moderate.
The proportion of days with natural avalanches was higher than the proportion of days with human-triggered avalanches at all danger levels – even the lower ones (Table 2). The higher proportions of days with natural avalanches are primarily related to the occurrence of natural wet-snow avalanches at the lower danger levels. Below we will con-sider avalanche activity with regard to snow conditions and type of triggering in more detail.
3.2 Avalanche size
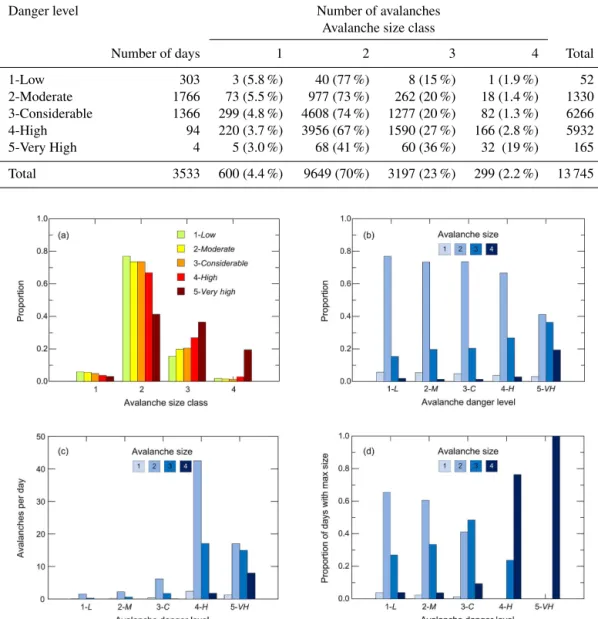
Smaller avalanches were more common than large avalanches – irrespective of the danger level (Table 3, Fig. 3a). The majority of the avalanches recorded (9649 out
Table 2.Avalanche activity per danger level. The AAI considers all types of avalanches independent of snow conditions and trigger type; median value per day is given. Moreover, the number of days with either natural or human-triggered avalanches, at least size 2 or larger is shown.
Number of days Number of days
Number of days with natural with human-triggered
Danger Number with AAI>0 AAI avalanches (≥size 2) avalanches (≥size 2)
level of days (proportion in percent) median (proportion in percent) (proportion in percent)
1-Low 303 26 (8.6 %) 0.15 19 (6.3 %) 7 (2.7 %)
2-Moderate 1766 437 (25 %) 0.21 286 (16 %) 144 (8.2 %)
3-Considerable 1366 741 (54 %) 1.0 479 (35 %) 341 (25 %)
4-High 94 93 (99 %) 21 89 (95 %) 36 (38 %)
5-Very High 4 4 (100 %) 88 4 (100 %) 0 (0 %)
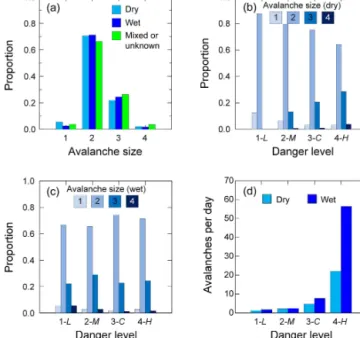
of 13 745) were size 2 avalanches. This size was the most frequent at all danger levels. Size 3 and size 4 avalanches were less frequent at all danger levels. In other words, for sizes 2 to 4, the frequency of occurrence decreased with increasing avalanche size. The overall frequencies were 4 %, 70 %, 23 % and 2 % for sizes 1 to 4, respectively (Table 3, bottom row).
The distributions of avalanche sizes per danger level (Fig. 3b) did not significantly differ for the danger levels 1-Low to 3-Considerable (see Table S2). For level 4-High the distribution looked similar, but still the size 2 avalanches were the most frequent followed by size 3 avalanches, but the distribution was statistically different (Utest,p <0.001). At danger level 5-Very High the distribution was clearly differ-ent with relatively more size 4 avalanches and fewer size 2 avalanches.
Overall, about 80 %–90 % of the avalanches were size 2 or 3, whereas size 1 and size 4 avalanches were always rare (5 %), except at level 5-Very High when about 19 % of the recorded avalanches were size 4 avalanches. Overall, size 2 avalanches tended to decrease, while size 3 and 4 avalanches tended to increase with increasing danger level (Fig. 3b).
The proportion of size 2 avalanches was similar (73 % to 77 %) at danger levels 1-Low to 3-Considerable (proportion test,p >0.57) but clearly decreased at danger levels 4-High (67 %; p <0.001) and 5-Very High (41 %;p <0.001). On the other hand, the proportion of size 3 avalanches increased from 15 % at level 1-Low to 20 % at both level 2-Moderate and 3-Considerable to eventually 27 % at level 4-High (Ta-ble 3). The latter increase was statistically significant (pro-portion test, p <0.001). Size 4 avalanches were relatively most frequent at danger level 5-Very High, about 5 times more frequent than at level 4-High and about 15 times more frequent than at level 3-Considerable (Fig. 3c); the increase was statistically significant (proportion test,p <0.001).
At danger levels 1-Low and 2-Moderate avalanches were not generally smaller, but were simply less frequently ob-served. There was a substantial increase in avalanche occur-rence with increasing danger level (Fig. 3c) as also reflected in the strong increase in the avalanche activity index (Fig. 2).
The average total number of avalanches per day was 2, 3, 8, 64 and 41 for the danger levels 1-Low to 5-Very High, respectively. Hence, in general, the frequency rather than the size increased with increasing danger level. The median avalanche length was 164, 154, 163 and 198 m for the dan-ger levels 1-Low to 4-High, respectively (see Fig. S2). Hence only at danger level 4-High were the avalanches about 25 % longer, and the difference was statistically significant (Utest, p <0.001). Avalanche length was weakly correlated with the danger levels (1-Low to 4-High) (rs=0.13).
Whereas size 2 avalanches were clearly the most fre-quent at the danger levels 1-Low to 4-High and the size distributions looked partly similar, the largest avalanche ob-served at a given day increased with increasing danger level (Fig. 3d). At the danger levels 1-Low and 2-Moderate the largest avalanche observed was a size 2 avalanche on most days, whereas at the danger levels 4-High and 5-Very High the largest avalanches were mostly or even always size 4 avalanches, respectively.
3.3 Snow conditions
For about half of all avalanches (56 %) snow conditions were reported as dry, for 30 % as wet and for 6.3 % as mixed; for the remaining 8 % (1072 avalanches) the type of avalanche snow was unknown, i.e., not recorded. As the dis-tributions of avalanche sizes were similar for the mixed and unknown conditions (U test, p=0.822), we merged these two groups. For the three groups (dry, wet, mixed/unknown), again about 70 % were size 2 avalanches and about 20 % size 3 avalanches (Fig. 4a). The distributions of avalanche sizes were similar and comparable to the overall distribu-tion (Table 3) but found to be statistically different (U test, p <0.001). Differences in size distribution with regard to snow conditions were however small. For size 2 avalanches, the proportions were even the same (71 %) for both dry-snow and wet-dry-snow conditions (proportion test,p=0.54). The proportion of wet-snow avalanches of size 3 was slightly larger (25 %) than the corresponding proportion of dry-snow avalanches (22 %;p <0.001). Most size 4 avalanches were
Table 3.Frequency of avalanche size per danger level (proportion in percent).
Danger level Number of avalanches
Avalanche size class
Number of days 1 2 3 4 Total
1-Low 303 3 (5.8 %) 40 (77 %) 8 (15 %) 1 (1.9 %) 52 2-Moderate 1766 73 (5.5 %) 977 (73 %) 262 (20 %) 18 (1.4 %) 1330 3-Considerable 1366 299 (4.8 %) 4608 (74 %) 1277 (20 %) 82 (1.3 %) 6266 4-High 94 220 (3.7 %) 3956 (67 %) 1590 (27 %) 166 (2.8 %) 5932 5-Very High 4 5 (3.0 %) 68 (41 %) 60 (36 %) 32 (19 %) 165 Total 3533 600 (4.4 %) 9649 (70%) 3197 (23 %) 299 (2.2 %) 13 745
Figure 3.Avalanche size per danger level.(a)Relative frequency of avalanche sizes (1 to 4) at the danger levels 1-Low to 5-Very High. (b)Distribution of avalanche size for each danger level (same data as in Fig. 3a).(c)Average number of avalanches per day by size class for each danger level, for days with AAI>0.(d)Frequency of days when the largest observed avalanche was size 1, 2, 3 or 4 for each danger
level.N=13 745 avalanches on 1301 d.
recorded for mixed or unknown conditions, relatively twice as many as for dry-snow or wet-snow conditions. In gen-eral, for mixed or unknown conditions, the avalanche size seems to be somewhat larger. Relatively fewer size 2 and more size 3 and 4 avalanches were reported. In fact, the me-dian avalanche length was 167, 188 and 190 m for dry-snow, wet-snow and mixed/unknown conditions, respectively. The avalanche length distributions were similar for wet-snow and unknown/mixed conditions (Utest,p=0.55), but both were different from the dry-snow conditions (U test,p <0.001). So far, in Fig. 4a, we have considered all avalanches irrespec-tive of the type of triggering. In the following, we will only consider natural avalanches.
Whereas overall the size distributions are not very differ-ent (Fig. 4a), some differences emerge when considering the size distribution per danger level for dry-snow and wet-snow conditions (Fig. 4b, c). For instance, at level 1-Low on a day with wet-snow avalanches size 3 and size 4 avalanches were also recorded. Avalanches tended to be larger and were also more frequent (Fig. 4d). On the 10 d with natural wet-snow avalanches, the number of avalanches was 18 and the total AAI was 15.2. However, on the 6 d with natural dry-snow avalanches, the number of avalanches was eight and the to-tal AAI was 0.71. Hence, the AAI was on average more than 10 times larger for wet-snow than for dry-snow conditions. On the other hand, as shown in Fig. 4d the average number
of avalanches per day was 1.3 for dry-snow and 1.8 for wet-snow conditions; this difference is not particularly large. In fact, the difference in the number of avalanches per day is statistically not significant (Utest,p=0.39).
At the danger levels 1-Low to 3-Considerable there were relatively more size 3 and size 4 wet-snow avalanches recorded than dry-snow avalanches. Whereas for dry-snow conditions the proportion of size 2 avalanches decreased and the proportion of size 3 avalanches increased with increas-ing danger level, this tendency was not evident for wet-snow conditions.
Natural avalanches under wet-snow conditions not only tended to be larger, but there were also more wet-snow avalanches than dry-snow avalanches observed on a given day. The average number of natural avalanches per day with a given danger level was larger for wet-snow than for dry-snow conditions (Fig. 4d). For wet-dry-snow avalanches the av-erage numbers were 1.8, 2.5, 7.7 and 56 for danger lev-els 1-Low to 4-High, for dry-snow conditions: 1.3, 2.2, 4.8 and 22. For the danger levels 3-Considerable and 4-High, the difference in the number of avalanches per day was sta-tistically significant (U test, p=0.001). Hence, the aver-age number of avalanches per day was about 1.6 and 2.6 times larger at levels 3-Considerable and 4-High, respec-tively, for a day with wet-snow avalanches compared to a day with snow avalanches. Overall, the 3044 natural dry-snow avalanches were recorded on 482 d and the 3955 natu-ral wet-snow avalanches on only 331 d; i.e., on average al-most twice as many wet-snow than dry-snow avalanches per day were recorded: 12 vs. 6.3. The difference in the number of avalanches per day between dry- and wet-snow conditions was statistically significant (Utest,p=0.001) Hence, under wet-snow conditions, avalanches were not only larger, but also more frequent compared to dry-snow conditions. 3.4 Type of triggering
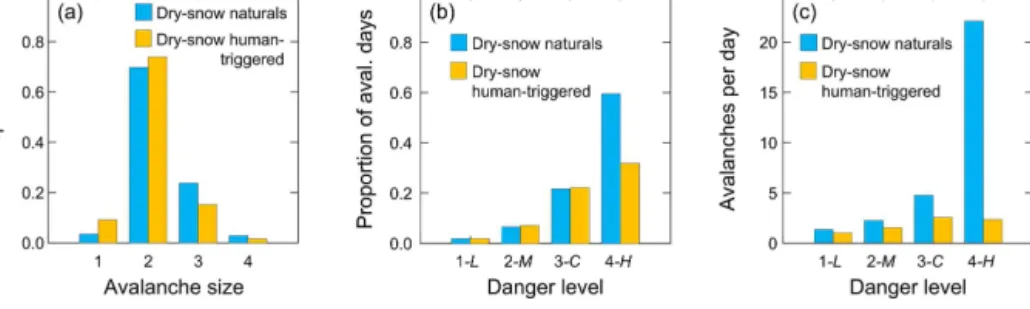
Whereas above we have compared avalanche activity with regard to snow conditions and primarily focused on natu-ral releases, in the following we will only consider dry-snow avalanches and focus on the type of triggering, i.e., compare natural to human-triggered avalanches. For dry-snow con-ditions, there were about 3 times more natural (N=3044) than human-triggered avalanches (N=1036). For both nat-ural and human-triggered avalanches, size 2 avalanches were most frequently observed, in 70 % and 74 %, respectively (Fig. 5a), followed again by size 3 avalanches (24 % and 15 %). Hence, the frequency distribution was again similar but statistically significantly different (U test, p <0.001). There were relatively more human-triggered avalanches of size 1 and 2, yet more natural avalanches of size 3 and 4. For instance, size 4 avalanches were 1.7 times more frequent among the natural than the human-triggered avalanches. Still, there were 17 human-triggered size 4 avalanches recorded. In summary, natural dry-snow avalanches tended to be larger
Figure 4. (a)Avalanche size distribution for dry-snow avalanches (N=7748), wet-snow avalanches (N=4056) and avalanches
where the snow type was either recorded as mixed or it was not recorded at all (N=1941). Avalanche size distribution per danger
level (1-Low to 4-High) for(b)natural dry-snow avalanches (N=
3044) and(c)natural wet-snow avalanches (N=3955).(d)
Num-ber of avalanches on a day with corresponding avalanche activity per danger level for dry-snow and wet-snow conditions.
than human-triggered dry-snow avalanches. In total, 27 % of the dry-snow natural avalanches were size 3 and size 4 avalanches, whereas the corresponding proportion was only 17 % among the human-triggered avalanches (propor-tion test,p <0.001).
For the dry-snow human-triggered avalanches the size dis-tributions at the four danger levels 1-Low to 4-High were similar to the overall distribution shown in Fig. 5a. For in-stance, at danger levels 3-Considerable and 4-High, the pro-portion of size 3 avalanches was 0.74 and 0.73 (propor-tion test,p=0.77). For size 4 avalanches the corresponding proportions were 0.14 and 0.19 (proportion test,p=0.36). Moreover, the median avalanche length was 154, 139, 128 and 142 m at the danger levels 1-Low to 4-High. The cor-responding length distributions per danger level were sta-tistically not different (pairwise U test, p >0.19). Hence, avalanche size did not increase with increasing danger level (rs=0.004).
We then considered the relative frequency of avalanche days per danger level (Fig. 5b). Human-triggered as well as natural dry-snow avalanches were rare when the danger was rated as level 1-Low. Only in 6 out of 303 d (2 %) with level 1-Low was a human-triggered avalanche recorded, and on 6 d a natural avalanche was recorded (considering all size classes). In total, there were six human-triggered and
Figure 5.Type of triggering for dry-snow avalanches.(a)Avalanche size distribution for natural and human-triggered avalanches.(b) Pro-portion of days with either natural or human-triggered avalanches with regard to danger level.(c)Number of avalanches per day vs. danger
level.
eight natural avalanches on 11 individual days; i.e., typically there was one avalanche per day when there were dry-snow avalanches at all at level 1-Low. Hence, avalanche occurrence at level 1-Low is unlikely, irrespective of the type of trigger-ing. The proportion of days with human-triggered dry-snow avalanches increased to 7.2 %, 22 % and 32 % for days with a forecast danger level of 2-Moderate to 4-High, respectively. For natural dry-snow avalanches, the corresponding percent-age values were 2 %, 6.7 %, 22 % and 60 %.
Not only the proportion of avalanche days but also the av-erage number of avalanches per day prominently increased with increasing danger level (Fig. 5c). For the human-triggered avalanches at level 2-Moderate, the average num-ber per day, when at least one avalanche was recorded, was 1.5. At level 3-Considerable it was 2.5, but at level 4-High it slightly decreased to 2.3. For the natural dry-snow avalanches, which are more closely related to the release probability and do not depend on the presence of people, the increase was more prominent: 1.3, 2.2, 4.8 and 22 natural avalanches per day with danger rating 1-Low to 4-High, re-spectively. This corresponds to about a factor of 2, 4 and 17 increase from level 1-Low to the higher levels.
If not only dry-snow natural avalanches are considered, the increase in the average number of avalanches per day is even more prominent. Considering all natural avalanches ir-respective of the snow conditions (i.e., dry, wet, mixed and unknown), the average number of avalanches per day was 2.1, 2.5, 6.0, 48 and 33 for the danger levels 1-Low to 5-Very High, respectively. The higher number of natural avalanches per day, when considering all types of snow conditions in-stead of dry-snow only, reflects the finding that generally more wet-snow than dry-snow avalanches were observed at a given danger level as shown above in Fig. 4d.
4 Discussion
We analyzed a data set of visually observed avalanches from the region of Davos (Switzerland). Even though the data set was collected with the aim to record all (or at least as many as possible) avalanches in the region of Davos, our data set
certainly cannot provide the complete picture of avalanche activity, too. Small avalanches may be underreported in gen-eral. Moreover, avalanche records based on visual observa-tions are known to be biased since during times of poor visi-bility it is often difficult, and sometimes even impossible, to accurately outline the avalanche extent or record the release date (van Herwijnen and Schweizer, 2011). Only with remote avalanche detection systems can the observation bias during storms be overcome, at least with regard to the temporal res-olution (Lacroix et al., 2012; Ulivieri et al., 2011). A good spatial resolution can only be achieved with remote sensing from satellites (Eckerstorfer et al., 2017). However, presently the temporal resolution over the Alps is still too poor for op-erational purposes, since only every 6 d are images acquired from the same orbit, which is necessary for change detec-tion. Hence, when we provide the number of avalanches per day observed in our study region, this number should be con-sidered as a lower limit, since with visual observation a full coverage of the study area cannot be achieved.
Moreover, there may be other biases as it is, for instance, easier to record wet-snow than dry-snow avalanches. Also, the level of reporting varied during the 21 winter seasons. There were relatively more observations in the period of 2004–2005 to 2018–2019 than in the first 6 years of our study period. Still, size 2 and size 3 avalanches were the most frequent ones in both periods. The proportion of size 2 avalanches was about 70 % in both periods (proportion test, p=0.93). The proportion of size 3 avalanches was 22 % and 23 % during the first and second periods, respectively, again not significantly different (p=0.28). Hence, the key charac-teristics did not change much.
With 13 918 avalanches the data set is extensive and cov-ers many different avalanche situations – small as well as large avalanches, single avalanches as well as records from intense storms with many avalanches – in short, it seems a rather complete data set. A much smaller data set also with mapped avalanche perimeters for the surroundings of the village Zuoz in the lower Engadine (Swiss Alps) was ana-lyzed by Stoffel et al. (1998). In France, the “Enquête per-manente sur les avalanches” (EPA) is an extensive data set including the avalanche events in approximately 5000
ma-jor paths in the French Alps and the Pyrenees (e.g., Eckert et al., 2010). Primarily large avalanches that can threaten in-frastructure are recorded. Hence this data set seems biased towards very large avalanches and less suited for our pur-pose. Other extensive data sets were recorded along moun-tain passes, e.g., along the Milford road in New Zealand (Hendrikx et al., 2005). They found a significant lack of smaller sizes in their size class distribution, which contained 1842 avalanches. Since only larger avalanches (size≥2.5) are relevant for road safety, smaller avalanches were un-derreported. Similar underestimation of size 1 and size 2 avalanches was present in avalanche records observed along the highway crossing Rogers Pass (Canada) (McClung and Schaerer, 1981). Hence, our data set seems to be one of the most comprehensive ones – providing unique insight into avalanche activity. In general, the type of recording and the potential impact (e.g., whether the avalanche hit the road and/or caused damage) may represent the most relevant bi-ases in avalanche data sets.
The avalanche activity as described based on our data set also depends on terrain characteristics and snow climate. Hence, the characteristics of avalanche activity in our study area cannot simply be transferred to other mountain regions. Nevertheless, we suppose the avalanche size distribution for a given danger level to be fairly robust and rather indepen-dent of terrain and climate characteristics. However, the fre-quency and intensity of avalanche occurrence will certainly vary between regions.
The proposed size classification based on perimeter data had previously been used to study indicator avalanches in the regions of Davos (Schweizer et al., 2012). With the sug-gested classification criteria, the resulting median length (Ta-ble 1) is well in line with the typical values associated with the corresponding size classes provided by the European Avalanche Warning Services (EAWS, 2019b). They indicate typical length categories of<50 m, 50–200 m, several hun-dred meters and 1–2 km for size classes 1 to 4, respectively.
We then compared avalanche activity to the forecast dan-ger level. Again, this is far from perfect as one would need the verified danger level to compare with. Whereas verifica-tion at the lower danger levels can be done with numerous snow instability tests (Schweizer et al., 2003), with measure-ments (Reuter et al., 2015) or by expert opinion (Techel and Schweizer, 2017), at the higher danger levels (4-High and 5-Very High) avalanche activity is the most reliable hazard indicator.
As no consistent verification data existed for the entire data set, we had to use the forecast. Still, we tried to re-move some obvious outliers such as days with forecast dan-ger level 4-High but no avalanche records. This quality check should not be considered comprehensive verification. In to-tal, we changed fewer than 4 % of the danger ratings and mostly increased the danger level (Table S1). In contrast, most verification studies showed a forecast accuracy of about 70 %–80 % and a trend to over-forecasting (e.g., Techel and
Schweizer, 2017). Hence, our avalanche danger data are still biased, yet also reflect some past and recent practice of ap-plying the danger levels. For example, the danger level 4-High was relatively rarely forecast (on fewer than 3 % of the days). This may partly be explained by the location of Davos, which is somewhat protected from major storms, but also re-lates to forecast practice in Switzerland (Techel et al., 2018). However, it is also remarkable that similar avalanche activity was often differently rated for dry-snow and wet-snow con-ditions – at all danger levels. This finding adds to the list of inconsistencies in avalanche warning as recently reported in several studies (Clark and Haegeli, 2018; Lazar et al., 2016; Techel et al., 2018).
Correcting the forecast danger level based on avalanche activity, while analyzing the relation between danger level and avalanche activity, may seem questionable. The main ef-fect of the correction procedure was that the median AAI for days with level 4-High increased from about 10 to about 21. For days with level 3-Considerable, the median AAI was 1 and did not change due to the corrections. Hence, the dif-ference in avalanche activity between levels 3-Considerable and 4-High was already very prominent before the correc-tion procedure (before and after the correccorrec-tions: U test, p <0.001). With regard to avalanche size, the effects are less prominent. Size 2 avalanches were the most frequent ones at danger levels 1-Low to 4-High before and after the correc-tions.
The avalanche size distribution we found was remarkably robust with regard to different data stratifications. In partic-ular, the size distribution did not change substantially with the danger level (Fig. 3). In other words, for our data set, avalanche size did not prominently increase with increasing danger level, at least for the danger levels 1-Low to 4-High; size 2 avalanches were the most frequent (Fig. 3b). This find-ing seems somewhat surprisfind-ing, given that the avalanche dan-ger level is characterized by a combination of the proba-bility of avalanche occurrence and expected avalanche size (Meister, 1995); it suggests that avalanche size may be of secondary importance compared to snowpack stability and its distribution when assessing the danger level (Techel et al., 2020). Hence, it seems unlikely that the typical (or most frequent) avalanche size is decisive for choosing between four different danger levels for one given snow stability sce-nario as suggested recently by Müller et al. (2016a). Also, in the conceptual model of avalanche hazard (CMAH) a frequency–magnitude (or likelihood–size) matrix was sug-gested to estimate avalanche hazard (Statham et al., 2018).
On the other hand, considering the largest avalanche recorded on a given day as suggested by Techel et al. (2020) showed more prominent differences between the danger levels 1-Low to 2-Moderate compared to levels 4-High to 5-Very 4-High (Fig. 3d). Hence, the maximum ex-pected avalanche size may be useful to differentiate be-tween some hazard situations (Techel et al., 2020). Clark and
Haegeli (2018) also reported maximum expected size to be the second most relevant factor for selecting a hazard rating. Moreover, our findings on avalanche size are in line with the results of a study on avalanche incidents in relation to the danger rating. Harvey (2002) reported that length, width and fracture depth of human-triggered avalanches were very sim-ilar at the danger levels 1-Low to 4-High and hence did not increase with increasing danger level; the median length was 200 to 250 m and the width 50 to 60 m, which corresponds to avalanche size 2, in agreement with our analysis. How-ever, when Harvey (2002) considered all avalanches that had caused damage, i.e., not only human-triggered avalanches but also avalanches that had destroyed trees or infrastruc-ture, he found avalanche size to be larger at the danger levels 4-High and 5-Very High than at the lower danger levels. Lo-gan and Greene (2018) also recently related avalanche size to danger level. They reported that size 2 avalanches (destruc-tive size) were the most frequent size at the danger levels 2-Moderate, 3-Considerable and 4-High – in agreement with our findings.
The relative frequency of the avalanche size classes 2, 3 and 4 were 70 %, 23 % and 2 %, respectively. Hence the fre-quency of avalanche sizes 2 to 4 decreased with increasing size (Table 3, bottom row). Stoffel et al. (1998) also reported decreasing frequency of occurrence for their avalanche size classes medium, large and very large. These findings are in line with the magnitude–frequency relation of most natural hazard events including earthquakes for which the relation is known as the Gutenberg–Richter law (Jentsch et al., 2006). Several other studies have shown frequency–size power laws for snow avalanches (e.g., Birkeland and Landry, 2002; Fail-lettaz et al., 2004). The fact that size 1 avalanches were not the most frequent, as theoretically should be the case, is prob-ably related to an observation bias: small avalanches may of-ten not be mapped, in particular when other larger avalanches occur, or cannot be mapped at all if they are too small. In fact, when considering avalanche length and plotting a cumulative curve of events, avalanches shorter than 100 m seem to be un-derrepresented. This type of observation bias is also present in earthquake catalogues (e.g., Woessner and Wiemer, 2005). The average number of observed natural avalanches strongly increased with increasing danger level: 2.1, 2.5, 6 and 48 for the danger levels 1-Low to 4-High, respectively. This suggests that the differentiation between the lower two danger levels cannot be based on avalanche occurrence. Also, the relative increase from one danger level to the other is increasing – suggesting an exponential increase in the haz-ard. Previously, it was suggested that the hazard would dou-ble from one level to the other (Munter, 2003). Using acci-dent data a 2- to 3-fold increase was shown (Pfeifer, 2009; Techel et al., 2015), whereas a survey among North Ameri-can avalanche professionals suggested a 10-fold increase in triggering probability when the regional danger increases by one level (Jamieson et al., 2009b). Based on avalanche obser-vations from Colorado, Elder and Armstrong (1987) assigned
avalanche frequencies per day to the four danger levels that were in use at those times: 0–3, 4–9, 10–20 and≥21.
The prominent, nonlinear increase in avalanche occur-rence with increasing danger level reflects that, according to its definition, the avalanche danger level increases with decreasing snow stability. With decreasing snow stability, the frequency of locations with a potential weakness where an avalanche may be released increases. However, the sug-gested increase in weaknesses in the snowpack can only be assessed with spatial variability studies (e.g., Reuter et al., 2016), which are most appropriate to determine the spa-tial distribution of instabilities. For example, Schweizer et al. (2003) reported an increase in the proportion of poorly rated profiles from virtually 0 % to 24 % to 53 % for the danger levels 1-Low to 3-Considerable, respectively. Their observations correspond to our finding that the number of natural dry-snow avalanches doubled from level 2-Moderate to 3-Considerable and increased by almost a factor of 3 for wet-snow avalanches. Whereas the number of natural dry-snow avalanches consistently increased with increasing danger level, this was not the case for the human-triggered avalanches. The frequency of human-triggered avalanches did not increase from level 3-Considerable to 4-High. This finding does not mean that triggering becomes less likely but rather reflects terrain usage and the effect of avalanche warnings. In fact, Techel et al. (2015) showed a decrease in ski touring activity already from level 2-Moderate to Considerable and even more prominently from level 3-Considerable to 4-High. On the other hand, Wäger and Zweifel (2008) found no decrease in frequency usage from levels 2-Moderate to 3-Considerable when considering off-piste skiing.
At danger level 4-High, the average number of natural avalanches per day in our study region was about 20 for dry-snow avalanches and about 50 for wet-dry-snow avalanches. If we assume that “many” natural avalanches are typically ob-served at the danger level 4-High (EAWS, 2019a), we may conclude that 10–20 avalanches per 100 km2have to be
ex-pected, considering some underreporting in our study area of about 300 km2, where about two-thirds is avalanche
ter-rain. Hence, our analyses suggest that in the terrain typical of our study area at least about 10 natural avalanches have to be observed for verifying the danger level 4-High. Based on satellite images, Bründl et al. (2019) recently analyzed the avalanche activity during a major avalanche cycle in Jan-uary 2018 when the danger level was 5-Very High. They ana-lyzed the number of size 4 avalanches per area; for an area of 250 km2the number of size 4 avalanches ranged from fewer
than 29 to up to 202 – roughly consistent with our observa-tions.
With regard to the definition of the avalanche danger by snow stability, its spatial distribution and avalanche size, we would like to point out that the spatial distribution does only refer to the frequency of locations with very poor snow stabil-ity where avalanches can initiate from. In other words, where
the points with very poor snow stability are located in space is irrelevant; only their frequency counts when deciding on a given danger level. Moreover, there is a difference between the probability of avalanche release, which is a local prop-erty related to local snow instability as recently revisited by Reuter and Schweizer (2018), and the avalanche occurrence probability, which depends on scale and is the result of sta-bility and its distribution (frequency of triggering spots) for a given area. Moreover, there is a third probability, not to be confused with the two previously mentioned, namely the probability of triggering an avalanche faced by an individual who travels in avalanche terrain on a given day with a given danger level, which also depends on scale (terrain traveled) and terrain choices.
Finally, when the definition for level 2-Moderate danger states that “large natural avalanches are unlikely” (EAWS, 2019a), this definition could also be modified to “natural avalanches are unlikely” since the probability for any size of natural avalanche at level 2-Moderate is less than 5 %, which according to the IPCC (IPCC, 2014) is best described by “very unlikely”. Likewise, the formulation in the definition of level 1-Low, “only small and medium avalanches are pos-sible”, is not appropriate and should be modified. Hence, our analyses of the avalanche activity may be used to improve the descriptions in the avalanche danger scale.
5 Conclusions
We quantified some of the key characteristics such as fre-quency and size of avalanches at a given danger level. To this end, we analyzed a unique data set of 21 years of visually observed avalanche records from the surroundings of Davos (eastern Swiss Alps, 300 km2), consisting of the mapped
out-lines of 13 745 avalanches, and we compared the characteris-tics of avalanche activity to the regional danger level as fore-cast on 3533 d.
The proportion of days with natural avalanches at a given danger level substantially increased with increasing danger level. Also, the overall number of avalanches per day promi-nently increased, which reflects the fact that with increasing danger level snow stability decreases and the frequency of lo-cations with a potentially critical weakness in the snowpack increases. The average recorded number of avalanches per day in our study region (300 km2) was 2, 3, 8 and 64 for the
danger levels 1-Low to 4-High, respectively.
The relative frequency of the four avalanche size classes did not substantially change with increasing danger level, ei-ther for human-triggered or for natural avalanches, except for danger level 5-Very High. In other words, avalanche size did not increase with increasing danger level: the most fre-quent avalanches were size 2 avalanches at any danger level. This suggests that avalanche size may be of secondary im-portance compared to snowpack stability and its distribution when assessing the danger level. Only in certain situations
might avalanche size be decisive – and rather by consider-ing the maximum expected size. Still, the absolute number of very large avalanches (size 4) per day prominently in-creased, namely by a factor of 20 from level 3-Considerable to 4-High.
At a given danger level the frequency of natural avalanches was typically larger for wet-snow conditions than for dry-snow conditions, and wet-dry-snow avalanches tended to be larger – potentially reflecting inconsistent usage of the dan-ger scale in Switzerland. Based on our findings, we propose revisiting the definitions of the danger scale and possibly quantifying some of the descriptions. For example, we sug-gest that “many avalanches” may mean on the order of at least about 10 avalanches per 100 km2.
We are aware that visual observations are notoriously in-complete. Hence, our results should be challenged by simi-lar analyses with simisimi-larly extensive data sets. In the future, more comprehensive data sets based on remotely sensed data and results from avalanche detection systems may allow bet-ter founded analyses.
Finally, our analyses confirm that different avalanche situ-ations are typically condensed into one specific danger level, which results in a loss of information. Hence, avalanche warning services are encouraged to describe the danger as best as they can and not only provide the danger level. Like-wise, risk assessment in avalanche education should not fo-cus solely on the danger level, or the release probability, but also include the potential consequences.
Data availability. The data sets of avalanche
ob-servations and avalanche danger are accessible at https://doi.org/10.16904/envidat.134 (Schweizer et al., 2020).
Supplement. The supplement related to this article is available
on-line at: https://doi.org/10.5194/tc-14-737-2020-supplement.
Author contributions. JS, CM and BR designed the study. AS, FT,
JS and CM extracted and curated the data. JS analyzed the data and prepared the manuscript with contributions from all co-authors.
Competing interests. The authors declare that they have no conflict
of interest.
Acknowledgements. We would like to thank everyone who
con-tributed to the avalanche occurrence data set, in particular the in-terns of the avalanche warning service at SLF, who mapped most of the avalanches. We are grateful for the constructive comments by the two reviewers and the editor that helped to improve the paper.
Review statement. This paper was edited by Evgeny A. Podolskiy
and reviewed by Rune Engeset and Pascal Haegeli.
References
Birkeland, K. and Landry, C. C.: Power-laws and snow avalanches, Geophys. Res. Lett., 29, 1554, https://doi.org/10.1029/2001GL014623, 2002.
Bründl, M., Hafner, E., Bebi, P., Bühler, Y., Margreth, S., Marty, C., Schaer, M., Stoffel, L., Techel, F., Winkler, K., Zweifel, B., and Schweizer, J.: Ereignisanalyse Lawinensituation im Januar 2018, WSL Bericht, 76, edited by: Steffen, K., Federal Research Institute WSL, Birmensdorf, Switzerland, 162 pp., 2019. Clark, T.: Exploring the link between the conceptual model of
avalanche hazard and the North American public avalanche dan-ger scale, M.Sc., Faculty of Environement, Simon Fraser Univer-sity, Burnaby BC, Canada, 104 pp., 2019.
Clark, T. and Haegeli, P.: Establishing the link between the concep-tual model of avalanche hazard and the North American public avalanche danger scale: initial explorations from Canada, Pro-ceedings ISSW 2018, International Snow Science Workshop, Innsbruck, Austria, 7–12 October 2018, 1116–1120, 2018. Dennis, A. and Moore, M.: Evolution of public avalanche
informa-tion: The north American experience with avalanche danger rat-ing levels, Proceedrat-ings ISSW 1996, International Snow Science Workshop, Banff, Alberta, Canada, 6–10 October 1996, 60–66, 1997.
EAWS: Avalanche Danger Scale, available at: https://www. avalanches.org/standards/avalanche-danger-scale/, last access: 27 July 2019a.
EAWS: Avalanche Size, available at: https://www.avalanches.org/ standards/avalanche-size/, last access: 27 July 2019b.
EAWS: EAWS Matrix, available at: https://www.avalanches.org/ standards/eaws-matrix/, last access: 17 January 2020.
Eckerstorfer, M., Malnes, E., and Müller, K.: A complete snow avalanche activity record from a Norwegian forecasting region using Sentinel-1 satellite-radar data, Cold Reg. Sci. Technol., 144, 39–51, https://doi.org/10.1016/j.coldregions.2017.08.004, 2017.
Eckert, N., Parent, E., Kies, R., and Baya, H.: A spatio-temporal modelling framework for assessing the fluctuations of avalanche occurrence resulting from climate change: application to 60 years of data in the northern French Alps, Clim. Change, 101, 515–553, https://doi.org/10.1007/s10584-009-9718-8, 2010.
Elder, K. and Armstrong, B.: A quantitative approach for veri-fying avalanche hazard ratings, Symposium at Davos 1986 – Avalanche Formation, Movement and Effects, IAHS Publ., 162, 593–601, 1987.
Faillettaz, J., Louchet, F., and Grasso, J. R.: Two-threshold model for scaling laws of noninteracting snow avalanches, Phys. Rev. Lett., 93, 208001/208001-208004, https://doi.org/10.1103/PhysRevLett.93.208001, 2004.
Föhn, P. M. B. and Schweizer, J.: Verification of avalanche dan-ger with respect to avalanche forecasting, in: Les apports de la recherche scientifique à la sécurite neige, glace et avalanche. Actes de Colloque, Chamonix, 30 May–3 June 1995, edited by: Sivardière, F., ANENA, Grenoble, France, 151–156, 1995.
Haegeli, P., Falk, M., and Klassen, K.: Linking avalanche problems to avalanche danger – A first statistical examination of the con-ceptual model of avalanche hazard, Proceedings ISSW 2012, In-ternational Snow Science Workshop Anchorage AK, USA, 16– 21 September 2012, 859–865, 2012.
Harvey, S.: Avalanche incidents in Switzerland in relation to the predicted danger degree, Proceedings ISSW 2002, International Snow Science Workshop, Penticton BC, Canada, 29 September– 4 October 2002, 443–448, 2002.
Harvey, S., Schmudlach, G., Bühler, Y., Dürr, L., Stoffel, A., and Christen, M.: Avalanche terrain maps for backcountry skiing in Switzerland, Proceedings ISSW 2018, International Snow Sci-ence Workshop, Innsbruck, Austria, 7–12 October 2018, 1625– 1631, 2018.
Hendrikx, J., Owens, I., Carran, W., and Carran, A.: Avalanche ac-tivity in an extreme maritime climate: The application of classi-fication trees for forecasting, Cold Reg. Sci. Technol., 43, 104– 116, https://doi.org/10.1016/j.coldregions.2005.05.006, 2005. IPCC: Climate Change 2014: Synthesis Report. Contribution of
Working Groups I, II and III to the Fifth Assessment Report of the Intergovernmental Panel on Climate Change, IPCC, Geneva, Switzerland, 151 pp., 2014.
Jamieson, B., Haegeli, P., and Schweizer, J.: Field observations for estimating the local avalanche danger in the Columbia Mountains of Canada, Cold Reg. Sci. Technol., 58, 84–91, https://doi.org/10.1016/j.coldregions.2009.03.005, 2009a. Jamieson, B., Schweizer, J., and Shea, C.: Simple calculations of
avalanche risk for backcountry skiing, Proceedings ISSW 2009, International Snow Science Workshop, Davos, Switzerland, 27 September–2 October 2009, 336–340, 2009b.
Jentsch, V., Kantz, H., and Albeverio, S.: Extreme events: magic, mysteries and challenges, in: Extreme events in nature and soci-ety, edited by: Jentsch, V., Kantz, H., and Albeverio, S., Springer, Berlin, Germany, 1–18, 2006.
Lacroix, P., Grasso, J. R., Roulle, J., Giraud, G., Goetz, D., Morin, S., and Helmstetter, A.: Monitoring of snow avalanches using a seismic array: Location, speed estimation, and relationships to meteorological variables, J. Geophys. Res.-Earth Surf., 117, F01034, https://doi.org/10.1029/2011jf002106, 2012.
Lazar, B., Trautman, S., Cooperstein, M., Greene, E., and Birkeland, K.: North American avalanche danger scale: are public back-country forecasters applying it consistently?, Proceedings ISSW 2016, International Snow Science Workshop, Breckenridge CO, USA, 3–7 October 2016, 457–465, 2016.
Logan, S. and Greene, E.: Patterns in avalanche events and regional scale avalanche forecasts in Colorado, USA, Proceedings ISSW 2018, International Snow Science Workshop, Innsbruck, Austria, 7–12 October 2018, 1059–1062, 2018.
McClung, D. M.: The elements of applied avalanche forecast-ing – Part I: The human issues, Nat. Hazards, 26, 111–129, https://doi.org/10.1023/a:1015665432221, 2002.
McClung, D. M. and Schaerer, P.: Snow avalanche size classi-fication, Proceedings of Avalanche Workshop, Vancouver BC, Canada, 3–5 November 1980, 12–27, 1981.
McClung, D. M. and Schaerer, P.: The Avalanche Handbook, 3rd ed., The Mountaineers Books, Seattle WA, USA, 342 pp., 2006. Meister, R.: Country-wide avalanche warning in Switzerland, Pro-ceedings International Snow Science Workshop, Snowbird, Utah, USA, 30 October–3 November 1994, 1995.