Analyzing the behavior of cyclists at intersections to improve behavior variability within micro-simulation traffic models
by
Alexander Mereu
A thesis
presented to the University of Waterloo in fulfillment of the
thesis requirement for the degree of Master of Applied Science
in Civil Engineering
Waterloo, Ontario, Canada, 2015 © Alexander Mereu 2015
ii
I hereby declare that I am the sole author of this thesis. This is a true copy of the thesis, including any required final revisions, as accepted by my examiners.
iii
ABSTRACT
The purpose of this thesis can be separated into two components:
Component 1:
The purpose of this component was to update the input parameters for cyclists for application in mixed-traffic micro simulation models. This component used GPS data from cyclists to develop distributions of desired speed under variable road and facility conditions. Desired speed distributions as a function of road grade and the effect that road surface and facility type have on desired speed were analyzed. The findings suggest that facility type (multi-use trail, bike lane, and no bike lane) had no significant effect on the desired speed of the cyclists in the study. A distribution of the desired speed of cyclists was developed and can be applied to improve variability within micro-simulation traffic models.
Component 2:
The purpose of this component was to observe and analyze the left turn behavior of cyclists at different types of signalized intersections in the City of Toronto with the intent of recommending what facilities are most effective at facilitating left turning movements under varying input conditions. From the observations, a database was created that includes turning behavior, approach conditions, and individual cyclist related variables for each cyclist.
By analyzing the behavior data base, conclusions were made regarding the effect that intersection type, facility type, and input conditions have on the rule compliance and facility compliance of the cyclists that were observed. From these conclusions, recommendations have been made that are intended to suggest some facility interventions that will result in improved rule compliance and facility compliance, ultimately creating a more comfortable cycling environment and one that matches that natural tendencies of cyclists in the city.
The measurement of rule compliance in this report is based on the simple observation of whether the cyclists, when making a left turn at the intersection, complied with the rules of the road or broke the rules of the road as defined by the Ontario Highway Traffic Act. The
iv
measurement of facility compliance is based on whether the cyclist made a left turn using the facility as the design intends them to use it.
Cyclist behaviors at five different intersection configurations were observed in the study. This sample of intersection configurations is significant as they represent most of the generic intersection types that are located throughout Toronto’s cycling network. The
distribution of these behaviors for each intersection type can be considered in micro-simulation models when considering the stochastic nature of a cyclists and their decision process with regards to navigating a left turn through an intersection.
Facilities with more left turning options proved to promote rule compliance more so than the intersections with fewer options.
v
ACKNOWLEDGEMENTS
Jeff Casello
PTV Group
City of Toronto
Region of Waterloo
Axel Leonhardt
Kevin Yeung
Kyrlo Rewa
vi
Table of Contents
List of Figures ... vii
List of Tables ... viii
1.0 CHAPTER 1: INTRODUCTION ... 1
2.0 CHAPTER 2: CONTEXT ... 4
2.1 THE GREATER GOLDEN HORSESHOE ... 4
2.2 WATERLOO REGION ... 5
2.3 THE CITY OF TORONTO ... 6
3.0 CHAPTER 3: LITERATRE REVIEW ... 10
3.1 THE BENEFITS OF PROMOTING UTILITY CYCLING ... 10
3.2 PROMOTING CYCLING CULTURE THROUGH DESIGN ... 12
3.3 TYPES OF BICYCLE FACILITIES ... 14
3.4 PERCEIVED SAFETY ... 19
3.5 TRAFFIC MODELLLING ... 23
3.6 GAPS IN THE LITERATURE ... 27
4.0 CHAPTER 4: METHODS ... 28
4.1 COMPONENT 1 METHOD ... 28
4.2 DATA LIMITATIONS AND RELIABILITY IN COMPONENT 1 ... 31
4.3 COMPONENT 2 METHOD ... 31
5.0 CHAPTER 5: RESULTS ... 39
6.0 CHAPTER 6: RECOMMENDATIONS ... 64
7.0 CHAPTER 7: GOING FORWARD ... 66
vii
List of Figures
Figure 1: Bike Box ... 15
Figure 2 - Two-phased left turn ... 16
Figure 3 - Vehicle Left Turn Lane ... 17
Figure 4 - Cycle Track ... 18
Figure 5 - Bike Lane ... 19
Figure 6 - Three left turn behaviors ... 22
Figure 7 - Camera set up - Annette Street and Runnymede Road... 35
Figure 8 - Camera set up - College Street and Beverley Street ... 35
Figure 9 - Camera set up - Hoskin Avenue and St. George Street ... 36
Figure 10 - Camera set up - Dundas Street and Jones Avenue ... 36
Figure 11 - Camera set up - Sherbourne Street and Wellesley Street ... 37
Figure 12 - Camera set up - Harbord Street and Spadina Avenue ... 37
Figure 13: 1 Participant’s Journey - Speed over time ... 40
Figure 14 - Desired Speed Distribution ... 44
Figure 15: Desired Speed and Road Grade ... 45
Figure 16: Uphill Grade and Desired Speed ... 46
Figure 17: Downhill Grade and Desired Speed ... 46
Figure 18 – Intersection Type 1 Layout ... 49
Figure 19 – Intersection Type 1 Compliance ... 50
Figure 20 – Intersection Type 2 Layout ... 51
Figure 21 – Intersection Type 2 Compliance ... 53
Figure 23 – Intersection Type 3 ... 54
Figure 22 – Intersection Type 3 ... 54
Figure 24 – Intersection Type 3 Compliance ... 55
Figure 25 – Intersection Type 4 Layout ... 56
Figure 26 – Intersection Type 4 Compliance ... 57
Figure 27 – Intersection Type 5 Layout ... 58
Figure 28 - Intersection Type 5 Compliance ... 59
Figure 29 - Comparing Intersections ... 60
Figure 30 - Comparing Rule Compliance during red and green signal phases ... 61
Figure 31 - Comparing facility compliance during red and green signal phases ... 62
Figure 33 - Combined Crossride ... 66
viii
List of Tables
Table 1 - Micro-Simulation Input Parameters... 25
Table 2 - Intersection Types ... 34
Table 3: Data Collection Details ... 38
Table 4: Example Data Points ... 40
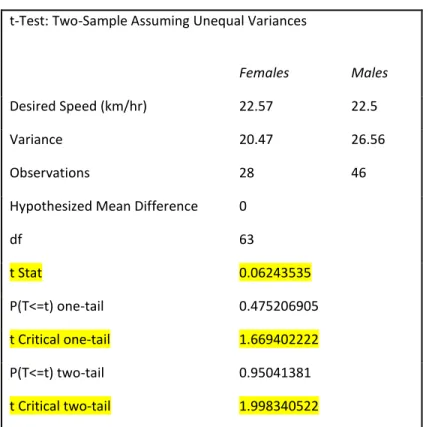
Table 5: t-Test: Two-Sample Assuming Unequal Variances ... 41
Table 6: Anova: Single Factor Results ... 42
Table 7: ANOVE results for facility type and desired speed... 47
Table 8 – Comparing bike box with advanced green and without advanced green... 57
1
1.0
CHAPTER 1: INTRODUCTION
The use of bicycles to accommodate the urban transportation needs of citizens is energy efficient, space efficient, generates no carbon emission, and it promotes a healthy and active life style for the user. The benefits of promoting cycling as a transportation mode choice are overwhelming, not just from an urban mobility perspective, but from an economic, social, and public health perspective as well (World Health Organization, 2003). In its simplest form, this thesis is focused on improving the cycling environment in cities by observing tendencies to gain a better understanding of cyclist behavior and to ultimately improve design to increase safety and convenience for existing and potential riders. The findings can also provide a better understanding of the stochastic nature of cyclists and provide a distribution of these behaviors that can be included in micro-simulation traffic models.
There is a clear trend that our world is becoming more urbanized and urban areas are becoming more densely populated. In 2014, the United Nations reported that 54 percent of the world’s human population is now living in cities and that the number is forecasted to increase to 66 percent by 2050 (United Nations , 2014). As this trend continues, maintaining and improving the mobility of urban citizens is a challenge of increasing complexity that requires more progressive and effective solutions than the approach planners, engineers and policy makers have taken over the past century. The traditional paradigm of urban growth in North America over the past century, which is predicated on sprawl and the development of new land made accessible by highways and arterial road networks, has proven to be
unsustainable. As cities sprawl and cover more area, commute times are increasing due to greater commute distances and the transportation networks that make these commutes possible are operating beyond their capacity, leading to extreme congestion and network failure in some cases (Vuchic, 1999). This has a negative impact on air and water quality, economic efficiency, and quality of life.
It is recognized within contemporary research related to urban studies, planning, and urban transportation, that progressive solutions to mobility problems include an attempt to
2
balance transportation mode choice away from the private automobile and to favor more efficient and environmentally sustainable modes of transportation. The promotion of cycling as a mode of transportation is one such example. However, regardless of all the benefits
associated with utilitarian cycling, encouraging citizens to consider leaving the familiar and comfortable confines of their personal automobile has significant challenges as the private automobile represents a major pillar of our society and our way of life. Attempting to invoke such a massive change is a challenge that needs to be approached in small increments and gradual improvements, and that draws from multiple lenses and avenues of expertise. One of these approaches is through design of transportation infrastructure or the retrofitting of the urban streetscape to better consider the needs of cyclists. By designing infrastructure that is better suited to cyclists, culture and change can occur gradually and the use of cycling as a mode of transportation will become more viable for the average citizen.
One of the tools that planners and engineers use when planning for new transportation projects is computer simulation modelling that model the effects and benefits that the
proposed improvements will have on traffic flow and traffic safety. Traditionally, these models are used to simulate the flow of automobiles, with limited consideration given to other road users, such as cyclists or pedestrians. As well, attempts to analyze the behavior of cyclists are limited and therefore a more generic approach to designing cyclist infrastructure has become common practice. The purpose of this study is to improve upon these inadequacies through research of the behavior of cyclists to gain a better understanding of the following:
how environmental variables, such as road grade, infrastructure type and gender, affect the desired speed of a cyclist;
how different intersection treatments affect the behavior of cyclists at those intersections;
the propensity for cyclists to comply to the defined rules of the road under varying conditions;
3
the desire lines of a left turning cyclist at various intersection configurations. From this research, the following two deliverables will be made available:
1. More variable input parameters to improve the micro simulation models of cyclists
2. Recommendations for bicycle facility types under varying conditions with specific application to the context of the City of Toronto
By gaining a better understanding of the behavior of cyclists, we can improve our design to match the desires and needs of cyclists and therefore make the cycling environment safer and more inviting to existing and prospective riders.
This thesis report is structured as follows. First, the context for the research is set and the specific challenges and attributes of the context is identified. Secondly, a literature review covers various topics that provide further justification for this research and identify gaps in the existing research that need to be addressed. Furthermore, a detailed overview of the methods used to conduct this research is presented. Finally, the results of the research will be presented and recommendations will be made.
4
2.0
CHAPTER 2: CONTEXT
The data that are used to formulate this thesis are taken from two different cities within the planning region in Ontario, Canada known as the Greater Golden Horseshoe. The first component of the thesis, which relies on GPS data from cyclists in a study conducted in 2011, comes from cyclists in Waterloo Region. The second component of the thesis uses video observation to analyze the left turning movements of cyclists in the City of Toronto. The purpose of this chapter is to summarize the contexts from which these data were collected and to identify the efforts that are being made to encourage residents to use more active modes of transportation. It is also important to note these contexts as they are not traditionally “cycling friendly” cities.
2.1
THE GREATER GOLDEN HORSESHOE
The Greater Golden Horseshoe is a geographic area in Ontario and is the most densely populated region in Canada. In 2006, a plan for the area was set in place by the Ministry of Infrastructure that was aimed at managing the growth of the region over the next 20 years (Ministry of Infrastructure, 2006)
The region had experienced substantial and continuous growth over the preceding decades and was expecting a similar level of growth going forward. The growth to date could be classified as urban sprawl, as the suburban communities of the Greater Toronto Area grew rapidly and outwardly, taking up new and previously undeveloped farm land and natural areas.
One of the key strategies to mitigate the sprawl and to manage the growth going forward, was to identify existing urban areas that host the majority of growth going forward through the process of intensification and urban revitalization. This strategy was a requirement that the identified centres for growth would aim to implement more efficient and sustainable modes of transportation to serve the prospective increase in urban densities.
5
2.2
WATERLOO REGION
The Region of Waterloo is now the 10th largest metropolitan area in Canada after
significant growth over the past half century. The Region is anticipating further growth into the future as the Ontario Places to Grow Plan has identified areas within the urban centres of the Region to be host to growth and intensification. The population of the region, based on 2011 census data, is 507,000 and is expected to grow to 729,000 by 2031 (Ministry of Infrastructure, 2006).
The Region is considered to be progressive with regards to transportation policy as it will become the smallest community in Canada to have light rail transit (LRT). The first phase of the LRT is under construction and is projected to be operational by 2017. This new investment in alternative transportation modes has been a catalyst for investment into all alternative modes. Part of the planning process surrounding the LRT includes accommodation of other alternative modes to help facilitate the movement of people to and along the LRT line.
Part of this attempt towards more sustainable modes of transportation has been a commitment to improving the condition for cyclists in the Region through mass implementation of on street bike lanes and the development of a strategic cycling network throughout the Region. The implementation of coloured bike boxes in downtown Kitchener has recently been completed as well as plans for a new off street multi use trail from east of Downtown Kitchener to Uptown Waterloo.
Although considerable effort has been made to improve the condition for cyclists in the Region, cycling numbers still remain low (2% mode split) as the sprawling urban landscape of the area has made cycling inconvenient and unsafe for the majority of potential riders (Region of Waterloo, 2011). A commitment to land use policy and a strategic approach to improving the bike network will only improve the condition for cyclists in the area.
Given the low cycling numbers in the Region, the data set that was collected in this context is made up of a group of experienced cyclists and does not represent the behavior beginner cyclists. Therefore, the conclusions that are based on the Waterloo Region data set
6
may only be applicable to micro-simulation models from similar contexts; where the cyclist population is made up of primarily experienced riders.
2.3
THE CITY OF TORONTO
The City of Toronto is the largest metropolitan area in Canada and the 4th most
populous city in North America. Although the City has grown to its geographic boundaries, with neighboring municipalities encroaching in all directions, Toronto continues to grow steadily in population. Between the last two census periods, 2006 and 2011, the City of Toronto
experienced population growth of approximately 110,000 new residents (Statistics Canada, 2011). This trend of growth is expected to continue and the City’s 2013 population of 2.77 million is forecasted to grow to 3.64 million by 2041 (Ministry of Finance, 2014). Given the land constraints of the city, the only way for Toronto to host the demand for new housing is through intensification. Specifically, the Ontario Places to Grow plan has set the following density target for the city:
“Under Places to Grow, Toronto was required to increase downtown resident/job density to a combined minimum of 400 per hectare by 2031. But city data suggest the downtown core is already at twice the prescribed density, with 708 jobs and residents per hectare. That ratio is expected to rise to 775 residents and jobs per hectare by 2022.”
(Scallan, 2012)
This level of growth and increase in density poses major challenges for mobility. The economic, social, and environmental costs of traffic congestion in the city are already staggering, and as population increases, this issue will become a more complex problem to solve. A report titled “Cost of Road Congestion in the Greater Toronto and Hamilton Area” estimated that the cost of congestion to commuters in the Greater Toronto and Hamilton Area was $3.3 Billion and a $2.7 billion cost to the economy (Metrolinx, 2008). The City and Province have developed robust policy initiatives, aimed at solving these issues using a more progressive
7
approach of planning land use and the transportation facilities needed to support it. The following are excerpts from the City of Toronto’s Official Plan that speak to the type of
development and the type of transportation facilities that will need to take on a higher level of priority:
8
In many cities in North America, sprawl and long trip distances are the primary reason that cycling is considered by many to be infeasible by most residents. In Toronto however, many neighborhoods have a dense concentration of residents, employment, and amenities and cycling is a very viable mode choice for the residents. However, one of the other major
deterrents for cycling in the city is the perceived safety of the mode; many citizens are resistant to cycling in the city because they do not feel safe doing so (City of Toronto, 2009).
The 2009 City of Toronto Cycling Study suggests that a concern for potential utility cyclists is related to safety. Further to that, the consensus amongst current riders and non-riders is that having more bike lanes and by improving facility design to separate cyclists from
“Promote mixed use development to increase opportunities for living close to work and to
encourage walking and cycling for local trips”
“Support the use of existing public investment in transit and other municipal assets, and create strong pedestrian and cycling linkages to transit stations.”
“Walking and cycling will be encouraged by creating safer and more attractive conditions in employment districts”
“In a mature city like Toronto, the emphasis has to be on using the available road space more efficiently to move people instead of vehicles and on looking at how the demand for vehicle travel can be reduced in the first place. Reducing car dependency means being creative and flexible about how we manage urban growth. We have to plan in “next generation” terms to make transit, cycling and walking increasingly attractive alternatives to using the car and to move towards a more sustainable transportation system.”
9
regular traffic, would have the greatest impact on making cycling safer and more viable in the city. This finding was and continues to be the primary catalyst in an effort to implement more effective cycling infrastructure around the city and to further develop the existing cycling network (City of Toronto, 2009).
Toronto has experienced increases in cycling numbers as well. As numbers increase, so too does the demand for more infrastructure, which provides further justification for the continuing improvement of the network. To be specific, cycling numbers in the City of Toronto have increased by 30% between 2001 and 2006 (Statistics Canada, 2006) and in high volume cycling areas in downtown, like the intersection of Spadina Avenue and College Street, the number of cyclists has increased by 74% in the past three years (Simcoe, 2015).
The development of a successful and robust cycling network will require the bridging of gaps between major cycling corridors. Turning left through a major intersections represent one of these network gaps. By gaining a better understanding of the stochastic nature of cyclists behavior at intersections, more accurate micro-simulation models can be developed that will help creating the most affective designs to encourage good behavior and to create a
comfortable cycling environment.
The 2001 Cycling Strategy has set out a framework for identifying areas that require improvement going forward. There is also a new cycling plan that is currently in development that will help guide new cycling projects in the city going forward. In conjunction with these efforts, this thesis will help to identify which types of facilities are the most affective at promoting the natural tendencies of cyclists in an effort to help inform facility selection decisions going forward.
10
3.0
CHAPTER 3: LITERATRE REVIEW
This literature review summarizes the research that has been conducted related to cycling infrastructure in the context of this study. Specifically, this literature review focuses on studies that support the opinion that building proper bicycle infrastructure has positive impacts on a community. It also supports the opinion that modelling and observing cyclist behaviors are important components in the process of building a better cycling environment. This
literature justifies the need for this research, identifies the research done to date, and identifies the gaps in that research that this thesis investigates.
3.1
THE BENEFITS OF PROMOTING UTILITY CYCLING
The benefits of promoting utility cycling in a city have been well documented across many disciplines, from public health, to urban planning, and economics. This chapter
summarizes the findings from two reports by major organizations that identify the benefits of investing in cycling infrastructure.
The World Health Organization (WHO), in their 2003 report titled “Social Determinants of Health: The Solid Facts Second Edition,” identifies the importance of transportation policy and mode choice on the health of society. The report identifies four ways in which taking measures to promote cycling and the use of public transit can improve public health: increased social contact, improved air quality, reduction in fatal traffic accidents, exercise.
The report suggests that by creating policy that promotes active modes of
transportation, individuals can make up for the lack of physical activity in other aspects of their life. Other benefits of promoting active modes include the social interactive component of these modes. Where cars alienate and separate people for their fellow travelers, walking, transit and cycling can promote interaction within a community (World Health Organization, 2003).
Another aspect of improved public health that comes from promoting active modes and transit are that deaths from traffic accidents would decrease. As active and transit modes
11
increase, fewer accidents will occur from high speed car crashes (World Health Organization, 2003). It calls for well-designed urban environments that separate cyclists and pedestrians from car traffic to create an environment that is safer for users.
The WHO report above is a summary of findings across multiple disciplines and uses a broad contextual lens to identify the benefits of promoting cycling. The second report, which is summarized below, is more context specific to the United Kingdom (UK) and uses a quantified cost benefit approach.
The Department of Transportation (DOT) in the UK released a report that summarizes cost benefit ratios of several proposals for new bicycle infrastructure. The DOT had a total £94 Million to allocate to bicycle infrastructure projects in cities and National Parks. The allocation of the funding was prioritized based on the various funding proposals. The cost benefit for each proposal was considered. (Department for Transport, 2014)
The majority of benefits came from improved health and the societal benefits that could be quantified from improved public health. The HEAT tool, designed by the WHO was used to generate monetary values associated with increased physical activity in society.
The second most common benefit was that of the benefit of reduced road congestion. Included in this benefit, were the economic gains from reduced congestion (time), reduction in traffic accidents, and also decreased GHG emissions and air pollution.
The cost benefit ratio results for each proposal ranged from 3:1 to 13:1. In all proposals, the B/C ratio was positive, and in some cases was extremely high. Overall, the investment of £94 Million was calculated to provide a benefit of 5.5:1. Meaning that for every £1 spent, the benefit would be £5.5 in social and environmental benefits (UK D.O.T., 2014).
This report is another example of the type of analysis that has been conducted to indicate the overwhelming benefits that come from investment in bicycle infrastructure.
12
3.2
PROMOTING CYCLING CULTURE THROUGH DESIGN
By designing urban areas to better accommodate cyclists, gradually, a bicycle culture can be created as more people see cycling as a viable and comfortable transportation choice. By introducing new cycling facilities, more cyclists will ride. The following two sources are some examples of the research that support the strategy of building better bicycle infrastructure as a way of promoting utility cycling in a city. The first is a report found in the Transportation Research Record that takes a scientific approach to quantify the variables, specifically the implementation of new cycling facilities, that affect the propensity to cycle in that city. The second report is a case study that summarizes the historical policy initiatives that helped the community of Davis California to become one of the best cycling communities in North America.
A study conducted by Jennifer Dill and Theresa Carr in 2003 set out to identify the variables that affect the propensity to cycle in a city. Several survey based, stated preference studies were conducted and from them, the stated preference among the respondents was that if better infrastructure was built, that they would be more likely to use it. This stated preference method has its limitations, and so this study used revealed preference using data from 43 cities and a multi-variate regression comparing different input variables to amount of people commuting by bike in the city. The study concludes that,
“Higher levels of bicycle infrastructure are positively and significantly correlated with higher rates of bicycle commuting.” (Dill & Carr, 2003)
This is a significant study within the North American context that suggests that investment in bicycle infrastructure will yield higher splits of bicycle commuting (Dill & Carr, 2003). A simple conclusion might be that increased cyclist numbers in a given area are
inevitable for other reasons, and when a city that notices this trend builds new infrastructure to support it. However, this study suggests a causal relationship; that building infrastructure has a direct impact on cycling numbers (Dill & Carr, 2003).
13
The 2008 paper titled “50 years of bicycling policy in Davis, California (Buehler & Handy, 2008)” looks at the evolution of the community of Davis, California from a small farming
community, to the “bicycle capital” of America. Although there are several variables, unrelated to policy and infrastructure, such as mild topography and weather that made this an ideal location for cycling, there were several public policy decisions that contributed to the development of Davis into a bicycle friendly community.
The first major policy decision was made at the local University. As the University was anticipating expansion in the 1940s, the president of the University instructed the planners to plan for a bicycle friendly campus and to encourage incoming students to bring their bicycle to campus. This level of leadership from an enthusiastic decision maker lead to the type of
development that helped Davis become the bicycle friendly community that it is today (Buehler & Handy, 2008).
Like many other communities during the post war development boom that saw the rise of the personal automobile and a sprawling urban fabric, Davis was no exception. As car traffic grew in the community, the conflict between cars and bikes started becoming a problem of increasing prevalence. However, where other communities welcomed and planned for this new trend and alienated the bicycle and other modes in favour of the automobile, Davis
maintained its priority of developing and promoting the bicycle as a utility transportation mode. As such, in 1963 the development plan for the university called for the elimination of cars from the campus core, the provision of several bicycle thoroughfares, and accommodation for bicycle parking throughout the campus.
The early 1960s in Davis was marked by the continuing angst between cyclists and automobiles, but the municipal election in 1966 was a major milestone as the elected council was pro-bicycle and recognized that more progressive solutions would be required to create a safe environment for all road users. The presence of the new leadership lead to the opening of the community’s first bike lane in 1967 (Buehler & Handy, 2008).
Having leaders that recognized the benefits of cycling in the policy and decision making arena was crucial in the development of the cycling environment for Davis going forward.
14
Planners and engineers used best practice solutions and observations from the Netherlands to justify it and became pioneer in North America. The 1990s saw decline in bike use primarily as a result of declining investment and a discontinuation of programs focused on promoting the mode. This era also marked the retirement of the original bicycle advocacy group that was a major reason for early success.
The case of Davis California is a great example of the influence a few enthusiastic and competent leaders/champions can have on promoting the construction of bicycle facilities and the affect that those facilities can have on the use of the bicycle as a viable mode of transport.
3.3
TYPES OF BICYCLE FACILITIES
There are several types of bicycle facilities that have become common practice solutions for creating a safer and more comfortable environment for cyclists. Lane markings,
infrastructure, and signage are all such examples. The focus of this research is on improving the condition for cyclists making a left turn through an intersection. Therefore, the following is an inventory of the facilities that have been implemented to improve the left turn in the City of Toronto.
The Bike Box
Bike boxes extend out from the bike lane, in front of the vehicle stop line at signal controlled intersections to allow cyclists to move to the front of the queue at an intersection. This positioning allows cyclists to take advantage of the advance green for left turns and to allow numerous cyclists to proceed straight through an intersection, ahead of motorists, once the green signal begins. (Ministry of Transportation of Ontario, 2013).
15 Figure 1: Bike Box
This diagram from the Ontario Traffic Manual for Bicycle Facilities illustrates the design of bike box on a two lane road. Like the photograph above, this bike box allows cyclists to travel from the bike lane to the front of the queue to perform left, through, and right turning movements.
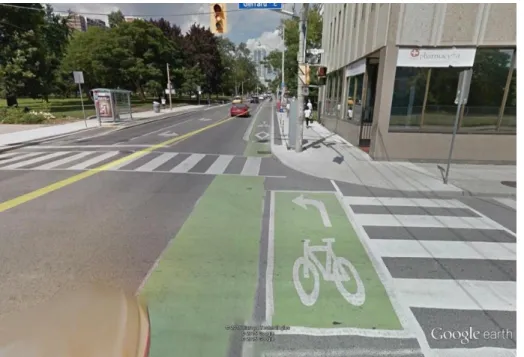
< Figure 1 is an example of a bike box at the south-west corner of Harbord Street and Spadina Aavenue in Toronto, Ontario. The initial design did not include the green coloured surface. The surface colour was added after to improve awareness of the facility’s presence for both cyclists and motorists. This design allows for cyclists riding eastbound down the Harbord Street bike lane to jump to the head of the queue for all turning movements.
16
The Two-Phased Left Turn
Figure 2 - Two-phased left turn
Two-phase turn boxes allow cyclist a space to wait for the signal to turn green after they’ve crossed the intersection, in the middle of turning left through an intersection. This design can also be referred to as “the Copenhagen Left” due to its original implementation in Copenhagen and its prevalence in the Copenhagen cycling network. This facility is effectively used by left turning cyclists as they approach a signalized intersection during a green signal phase. The box is located between the cycle lane and the pedestrian crossing. This is an important feature to eliminate the impedance of pedestrians and cyclists moving straight through the intersection.
Left Turn Lanes
Although the left turn lane is built to accommodate left turning vehicle traffic, it can also better facilitate left turning cyclists. Cyclists that use the left turn lane to conduct a left turn through an intersection must cross the general purpose lanes between the bike lane and the left turn lane. As the amount of lanes and the density of automobile traffic increase, the gaps in traffic
< Figure 2 is an image from Google Earth Street view. It is the two-phase turn box located on Sherbourne street in Toronto. These left turn facilities are located all along the Sherbourne Street cycling route to help facilitate the left turns of cyclists turning left off of Sherbourne Street.
17
decrease and this maneuver becomes more challenging. In the example illustrated in Figure 6, cyclists must wait for an appropriate gap in traffic to traverse the through lane to get to the left turn lane.
Figure 3 - Vehicle Left Turn Lane
Cycle Tracks
Cycle tracks run parallel to the road way but are separated by a barrier. This barrier is usually in the form of bollards, a raised curb, a boulevard, or parking. This barrier helps to prevent the conflict between forward moving cyclists and automobiles.
< Figure 3 exemplifies an approach to an
intersection that has a left turn lane, one through lane, and a bike lane. This is at the intersection of Annette St. and Runnymede Avenue in Toronto.
18 Figure 4 - Cycle Track
Bike Lanes
Bike lanes are road markings that identify an area for cyclists, separate from automobile traffic. Bike lanes are usually 1-2 meters in width in urban areas and are delineated by a solid white line. In sections where crossing a bike lane is necessary for laneway and drive way access, dashed lines are used.
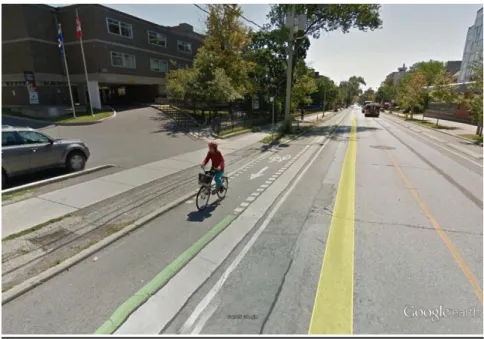
< Figure 4 is an example of a section of cycle track on Sherbourne Avenue in Toronto. This cycle track is separated from the automobile lanes by a raised curb.
19 Figure 5 - Bike Lane
3.4
PERCEIVED SAFETY
There are several variables that influence an individual’s mode choice decision, including safety, cost, convenience, comfort, and reliability. When it comes to choosing cycling as a mode choice, safety is one of the most influential factors.
As indicated in the context chapter of this thesis, perception of safety plays a major part in promoting cycling as a mode of transportation. It is important to define the concept of “perceived safety” and how it differs from actual safety. Actual safety can be quantified by accident rates, fatalities, etc. Perceived safety, although partially a function of actual safety, is a more qualitative measure (opinion based) and is related to the perception of safety, or whether or not someone feels safe riding their bicycle to get from their origin to their
destination. The perception of safety of a given network, or of a given origin and destination (O-D) varies greatly across the population of current and potential cyclists. Current and
< Figure 5 is an example of a bike lane found on Harbord Street in Toronto. At this location, a dashed white line is used to indicate the entrance to the lane way.
20
potential cyclists represent a wide range capabilities and confidence levels, their perception of safety differs accordingly, and it is a challenge to create a network that meets the needs of everyone. Ideally, a bicycle network should be made up of several options for any given O-D, each appealing to different levels of riders. For example, a single O-D might consists of 4 potential routes. One of these routes might have a segregated bike lane, one might be along a major arterial, with no bike facilities, and the other two might be along side streets. Depending on the safety of each of these route alternatives, riders with different confidence levels might choose a different option.
This type of O-D route decision process was modelled in a 2014 paper titled “Modelling Cyclists’ Route Choice Based on GPS Data” (Casello & Usyukov, 2014). This paper assumes that there is a trade-off between directness of a given route and the safety of a given route in that a cyclist may choose the longer route if it is safer (Casello & Usyukov, 2014). With this, it is assumed that as the proportion of people that perceive a given cycling route to be safe increases, it is more likely that they will consider cycling as a viable mode choice and cyclist numbers will increase.
As cities build their network, since much of it might already cater to high level,
comfortable cyclists, new facilities will help promote the use of cycling for current non-riders that use the lack of safety as their reason for not cycling. The following section is a summary of the research relating to the perception of safety of cycling, and how this impacts the willingness of a population to cycle and how design can improve this perception. Rule compliance and the use of safety equipment are also explored as indicators for perception of safety and the quality of a cycling environment.
Perceived Safety and Propensity to Cycle
As identified in the context portion of this thesis, cycling numbers in Toronto are heavily influenced by the perceived safety of the mode. It has been concluded and incorporated into Toronto planning policy that improving the environment by building separated cycle lanes and
21
cycle tracks will improve the condition and therefor increase the number of people the cycle to work in the city. The 2009 City of Toronto Cycling Study suggests that 40% of recreational cyclists would consider biking to school or work, and that half of them would do so if it was safer to do so (City of Toronto, 2009).
Consensus amongst researchers is that the perception of cyclist safety in established cycling cities, such as Copenhagen, is much better than in up and coming cycling cities like Brisbane and Toronto (Chataway, Kaplan, Nielsen, & Prato, 2014). The need to share the road in networks that are incomplete, like most networks in North America and Australia, compared to more developed networks of Europe, proves to be a major cause for concern amongst potential riders as the road sharing experience is perceived to be highly stressful for cyclists in these contexts.
Safety Gear as an indicator of Perceived Safety
Several studies have investigated the link between the propensity to wear safety gear and the perception of safety. It is suggested, and as one might intuitively assume, the
propensity to wear safety gear (i.e. higher helmet usage) is correlated with higher perception of risk (Chataway, Kaplan, Nielsen, & Prato, 2014). In this study, the percentage of cyclists
wearing helmets was 63% (1041 of 1648 cyclists). In Denmark, counts from the Cycling
Embassy of Denmark suggest that just 15% of Danish cyclists wear a helmet. This would be an indication of the difference in perceived safety between the two cities.
22
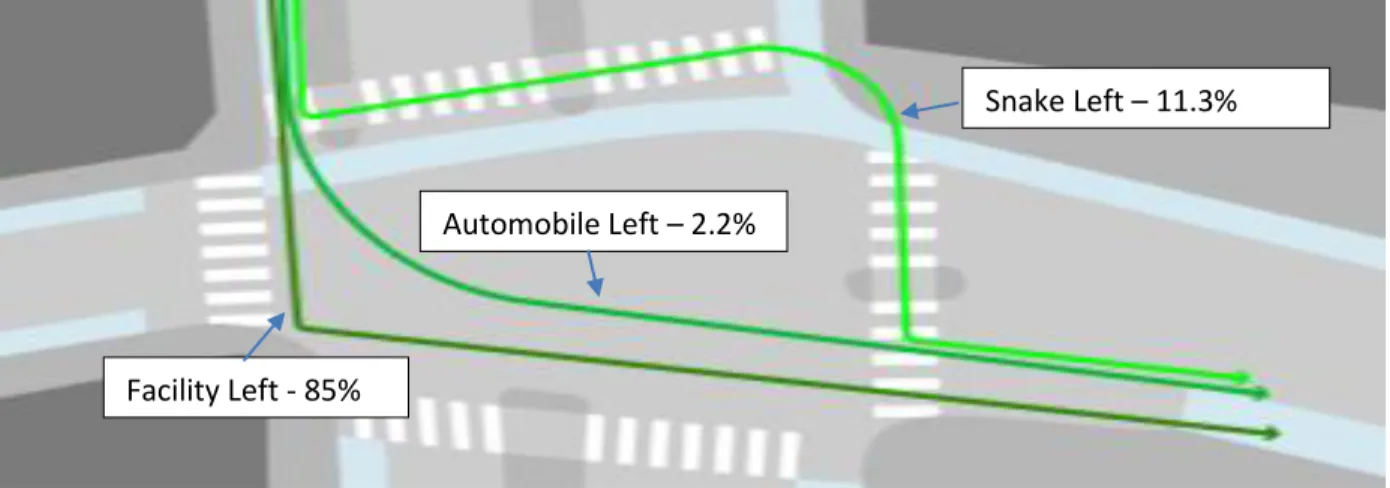
Rule Compliance as an indicator of the completeness and quality of a cycling environment. In a study conducted by the Copenhagenize Design Co., left turning cyclists at a high volume intersection in Copenhagen were analyzed using revealed preference behavior through observation. The purpose of the study was to compare the desire lines of the cyclists to the design of the intersection to assess the effect of the design on promoting rule compliance and facility compliance. The design that was analyzed in the study was a two-phased left turn box, referred to as a “Copenhagen Left” in this study, to facilitate the left turn of cyclists trying to navigate the intersection. Results revealed that 86.5% of cyclists turned left using the facility and therefore conformed to the facility design, 2.2% used the same maneuver as a left turning automobile, and 11.3% performed a “snake” crossing, which entails crossing the near side pedestrian cross, to minimize wait times at the signal, then crossing over once the light changes to get to their desired direction of travel. Figure 6 shows the three types of left turns that were observed. 63% of these “snake turners” got off their bike to cross the pedestrian area, and the remaining 37% stayed on their bike (Copenhagenize Design Co., 2014).
This high rule compliance is common across cities with highly developed cycling
networks. In cases like Copenhagen, where the cycling domain is well defined and the network is complete, there is little incentive to break the rules for safety or convenience reasons, and doing so would result in high risk of collision and high ridicule from other road users.
Figure 6 - Three left turn behaviors
Facility Left - 85%
Automobile Left – 2.2%
23
3.5
TRAFFIC MODELLLING
In today’s political arena, it can be a challenge to get leaders and policy makers to deviate from the status quo. Changing from the traditional paradigms of car centric improvements to improve traffic congestion could be viewed by the politician as “political suicide” and unconventional. Sound reason and scientific proof that is clearly communicated is imperative to the process of promoting the implementation of progressive and alternative transportation modes. However, generating these data and forming this argument in an easily communicable way is a challenge. Simple computer simulation models can be an effective way to communicate. By generating models that include active transportation, we can
demonstrate, within the limits of the model, that bike infrastructure can be used to alleviate congestion, rather than relying on hypothetical arguments to promote such solutions.
Caliper Corporation identifies the following benefits of modelling:
“provides something real for stakeholders to react to, rather than arguing abstract hypotheticals.”
“helps to build understanding of the level-of-service impacts on communities of transportation projects”
“asks and answers what if? Questions”
Prioritizes funding and projects
Base decision making on state-of-the-art analysis
Engage the public through dynamic and compelling visualization
(Caliper Corporation, 2013)
Traditionally, there is a major gap between efforts in transportation modelling, which are usually headed and carried out by engineers and technical staff, and the more qualitative methods used by planners and urban designers. There is an opportunity to bridge the gap between these two approaches by using the conceptual and observation of desire lines and to incorporate these behavioral tendencies into simulation models.
24
By observing behavior, we can design an environment that is better suited to the natural and comfortable tendencies of the cyclists instead of trying to design within the confines of the road, which is designed primarily for the automobile.
By taking into account observed behavior, we can develop distributions of behavior and model those tendencies and the propensity for a cyclist to behave a certain way under varying conditions. As these get incorporated into traffic simulation models, instead of assuming that cyclists will follow the rules that are defined by the design of the roadway, a more realistic approach to modeling cyclist behavior can be developed.
Modelling Efforts to Date
Extensive amounts of literature and software development have gone into improving micro-simulation traffic models. Traditionally, these models are focused on the flow of motorized traffic, including freight movement, public transit, and automobiles, with
significantly less consideration for bicycle traffic, and how bicycles interact with other road users. Traffic modelling, for both bicycles and automobiles, can be separated into three different categories:
1. How users of the system/mode interact to specific conditions of the road/surface
2. How users of the system/mode interact with traffic control systems and intersections
3. How users of the system/mode interact with other road users.
Each of these categories has variable distribution of behavior/interaction associated with it, but when it comes to cyclists, even more variability and unpredictability exists. Table 1 below outlines the input variables associated with each category for both automobiles and bicycles. The highlighted items in the table are the focus of this thesis. Component 1 is highlighted in green and component 2 is highlighted in orange.
25 Table 1 - Micro-Simulation Input Parameters
Automobiles Bicycles
Road Flow, speed and density
variability across road hierarchy.
- Arterial - Local Street - Controlled Access
Speed and acceleration variability across different facility/road type
- No Bike facility - On street bike lane - Off Street bike
path Co m p o n ent 1 Speed distribution as a function of road grade
Speed distribution as a function of road grade
Lateral movement within a lane
Lateral Movement within a lane
Traffic Control Distance between stopped
vehicles.
Distance between stopped vehicles.
Lane Changing Gap
acceptance – moving over to turning lanes
Lane Changing Gap
acceptance – moving over to turning lanes
Acceleration from stop, away from intersection.
Acceleration from stop, away from intersection. Deceleration approaching an intersection – Stopping Distance Deceleration approaching an intersection – Stopping Distance
Users Distribution of driver types
and erratic behavior probability distributions.
Distribution of left turn behaviors at intersections. Cyclists could act like pedestrians or they could act like cars. Behavior is much more erratic than motorist behavior at an intersection Comp o n en t 2
Other Vehicles Lateral movement within a
lane
Lateral movement within a lane
Following distances with other vehicles
Following distances with other vehicles
26
In 1999, A.Faghri and E.Egyhaziova developed the first computer simulation to include bicycles in a mixed traffic micro-simulation. At the time that this paper was published, very little research had been completed on the modelling parameters of cyclists. Where there were significant gaps in the data, this study collected new data (Faghri & Egyhaziova, 1999).
An acceleration rate for bicycles in this model uses a constant rate of acceleration for level grade and a linear equation to determine acceleration as a function of road grade but uses the same linear grade/acceleration function for bike acceleration as it does for other vehicles. The car following assumptions in this model also uses the same principles of behavior as
automobiles, with slight adjustments for the differences in vehicle characteristics (deceleration, acceleration).
Desired speed for cyclists is either maximum speed on road link or maximum speed for cyclists. There are no distributions of speeds considered, rather just one generic speed for all cyclists.
As this was the first micro-simulation to include bicycles in mixed traffic, it represents a baseline to work off of. However, there are significant shortcomings that lead to the need for further development and research into the variability amongst different cyclists’ physical (vehicle) characteristics, and behavioral (user) characteristics.
In 2013, Caliper Corporation recognized that previous mixed traffic micro-simulation models did not have proper inputs for cyclists and so they set out to investigate and improve these parameters. The justification for the research was based on the recognition that
motorists and cyclists have significantly different behavior and that variability in behavior from one cyclist to the next is extensive, even more extensive than that between motorists.
Caliper Corporation generated inputs for speeds, following distances and acceleration, lane changing, gap acceptance, critical distance with some consideration for average behavior and distributions of behaviors amongst the mean. (Caliper Corporation, 2013)
This research has made considerable improvements to developing distributions of physical characteristics of bicycles for inclusion in mixed traffic micro-simulation models. It has
27
done so by analyzing the physical movement of cyclists and developed distributions of these movements. However, the extensive variability of behavior amongst cyclists is not considered here.
3.6
GAPS IN THE LITERATURE
This literature review provides a thorough review of why improving cycling
infrastructure is an important part of making our cities better places to live. The literature also suggested that in order to make this happen, it is important to understand the behavior of cyclists on a more practical level so that proper infrastructure can be built; infrastructure that is designed to match the intuitive nature of cyclists.
The literature on modelling cyclists has gaps in addressing the stochastic nature of cyclist behaviors at intersections as well as how the desired speed of a cyclist is variable depending on input conditions such as path type or gender of the cyclist. In the models that have been reviewed in the literature, just one generic behavior is considered for a cyclist in a model. A huge amount of variability can occur at an intersection with regards to the desired path a cyclist takes and whether a cyclist complies with the rules of the road or the way the facility is designed. This study observes the behavior of cyclists at an intersection and specifically identifies the various methods that a cyclist navigates the left turn through the intersection. By identifying the distribution of behaviors, we can improve the input parameters for modelling cyclists at various intersection types.
In addition to providing improved input parameters, analyzing cyclists’ behavior can help to improve intersection design to satisfy the natural tendencies of cyclists (desire lines). By including design elements within a facility that matches the natural desire lines of a cyclist at a specific intersection, we can yield better results in terms of rule and facility compliance and overall make the design match the desire to improve safety and predictability of a cyclist.
28
4.0
CHAPTER 4: METHODS
4.1
COMPONENT 1 METHOD
The purpose of this component of the research was to investigate a set of cyclist GPS data and develop distributions of desired speed to provide a range of inputs for desired speed that can be adopted by the VISSIM simulation models. VISSIM is commonly used micro-simulation software developed by PTV Group and will be the software that is referred to in this thesis.
In 2011, a student at the University of Waterloo conducted a study to gain information on the behavior and physical attributes of cyclists in Waterloo Region (Rewa, 2012).
Participants of the study carried GPS units on them on their bike trips over the course of the study period. The GPS units were then returned to the researchers and the data were extracted and summarized into a database.
For the purpose of this analysis, data from 108 participants were analyzed. The number of trips from each participant varies, but the GPS units were configured to collect the following
information:
XY coordinates every 3 seconds
Z (elevation) values every 3 seconds
Velocity every 3 seconds
There was also a survey component to the study. For the purpose of this analysis, the gender and age information from the surveys were analyzed. Of the 108 participants, 75 provided age and gender information.
29
The desired speed of a cyclist refers to the speed at which the cyclist stops accelerating, and maintains a constant cruising speed. In the traffic modeling context, this refers to the speed a cyclists would accelerate towards.
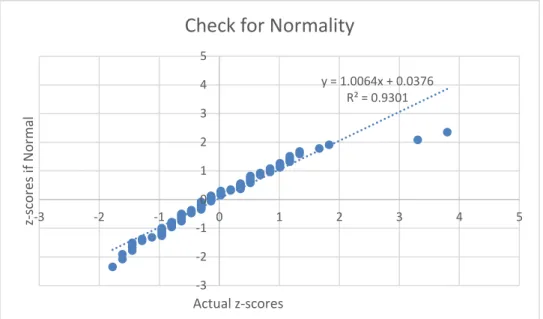
Desired speed distributions are based on the 85th percentile speed of each study participant. By choosing the 85th percentile speed, the top speeds and outlier speeds of a participant can be considered above desirable as a result of various factors, such as significant downhill periods, miscalculation of the GPS device, or other unexplainable factors.
To determine the 85h percentile speed of a participant, all the data points from every trip was grouped into one worksheet, speeds of 0 km/h were filtered out, and the excel function (=PERCENTILE,.85) was applied to the speed column.
Once a value for desired speed was determined for each cyclist, the cyclists were separated into age and gender groups to determine if desired speed varied depending on age and gender characteristics.
To determine if there was a difference between the desired speeds of the female and male study participants, a two sample t-test of means was completed.
To determine if there was a difference between the desired speeds of each age group, an ANOVA test for equality was conducted on the sample means.
The results of these hypothesis tests are summarized in the results chapter of this thesis.
Desired Speeds on Gradients
A macro was developed to determine average speed over a “hill.” A hill was defined by a succession of increasing or decreasing elevation values. When the elevation value switched from a negative to a positive value (or visa-versa), the hill ended and the average grade and speed for that hill was calculated.
30
The elevation data were collected during data collection. The accuracy of these data had been improved by deleting outliers to eliminate situations of extreme discrepancies from the altitudes of the study area.
For each participant, the 85th percentile speed was determined for each gradient. The gradients were separated into 1% intervals. A linear regression analysis was applied to determine how speed is a function of the change in road grade.
Facility Type and Speed
Using ArcGIS software, participant route shapefiles were created. Using a Region of Waterloo cycle network shapefile, each cyclist data point was assigned a facility type based on the facility type in the cycling network shapefile. If the data point was not in proximity to a cycling facility, it was assumed that the point was not on a cycling facility.
Once the facility type was added to the data base files, analysis could be conducted.
A macro was created that determined the average speed for three different facility types:
1. Off Road Path
2. Bike Lane
3. No Facility
The macro can be found in: CalcGandV Macro (Appendix A)
To determine if there was a statistical difference between the speeds in each facility, an ANOVA multiple means test was conducted.
31
4.2
DATA LIMITATIONS AND RELIABILITY IN COMPONENT 1
Most of the cyclists in this study were considered experienced cyclists based on a participant survey and therefore the sample did not include a lot of variability in the types of cyclists with ranging competence and comfort. Also, since the cyclist knows they are being tracked, it can have an influence on their performance. When a cyclist is not aware that they are being observed, more candid behavior and performance might occur.
The desired speed as a function of road grade only considered road grade as a factor and did not consider the presence of traffic control or the gradient prior to and after the hill. The grades in the study area were also relatively flat as there are no major hills. The
topography in the area is also extremely variable as the natural landscape is made up of shallow rolling hills. This makes it difficult to apply a constant speed to a hill because hills end before a desired speed can be reached.
4.3
COMPONENT 2 METHOD
The behavior of cyclists at different types of intersections was determined by collecting digital video footage at each intersection of study during peak hours.
For each intersection, two cameras were set up; one capturing footage along the E-W corridor and another capturing footage along the N-S corridor. Two cameras were required in order to capture the complete turning movements of the cyclists approaching from all
directions as well as the traffic conditions upon approach of the intersection.
Two traffic conditions were observed on approach:
1. Signal phase on approach (Green or Red) – This refers to the signal phase that the cyclist bases their decision on.
2. Traffic volume on approach
This is an observational evaluation of the traffic volume. To equate it to an exact traffic volume value, further research would need to be conducted or applied to transfer the observational
32
volume in a specific instant to the traffic volume counts of the subject intersection. The
following three volume conditions were considered. It should be noted that these are volumes based on the instant of observation and gap times were not calculated. For inclusion in micro-simulation models, further work would need to be conducted to determine gap size related to volume data and to categorize gap size into the low, medium, and high volume categories identified in this thesis.
a. Low volume refers to traffic flow that is sparse and provides no hindrance for cyclist to cross the general purpose traffic lane to get to the left turn lane. Further observation would need to be analyzed to determine which v/c ratio range might apply to the “low volume” category. As a speculative example, low volume might represent a v/c ratio of 0.3 or less.
b. Medium volume refers to traffic flow that has some traffic adjacent the bike lane but gaps are large enough to comfortably change lanes to get from the bike lane to the left turn lane. Further observation would need to be analyzed to determine which v/c ratio range might apply to the “medium volume” category. As a speculative example, low volume might represent a v/c ratio between 0.3 and 0.7.
c. High volume refers to heavy traffic flow with very few or no gaps to safely cross from the bike lane to the left turn lane. Further observation would need to be analyzed to determine which v/c ratio range might apply to the “high volume” category. As a speculative example, low volume might represent a v/c ratio of 0.7 or greater.
d.
The cameras were either fastened to a telephone poll (approx. 3 meters up) or on top of a high surface, such as a community notice board or bus shelter. This allowed for the viewing angle to be unobstructed by most passing vehicles.
33
The method of choosing the intersections of study was based on the following criteria:
1. The Intersection of two bicycle routes (defined by the presence of a bike lane, shared lane, or cycle track).
2. One through lane in each direction (with the exception of one subject intersection). 3. The presence of a vehicle left turn lane
4. A combination of different treatments of bicycles at intersections, including: a. No treatment
b. Two-phased left turn (Sherbourne Avenue) c. Bike Box (St. George and College Street)
Six intersections were included in the study that represent five different types of intersections:
1. Annette Street and Runnymede Road, Toronto (vehicle left turn lane and bike lane only) 2. Sherbourne Street and Wellesley Street, Toronto (cycle track and two-phased left turn
box)
3. Dundas Street and Jones Avenue, Toronto (vehicle left turn lane and bike lane only) 4. St. George Street and Hoskin Avenue, Toronto (bike lane and bike box)
5. St. George Street and College Street (bike lane and bike box and advanced green signal) 6. Harbord Street and Spadina Avenue (two through lanes, vehicle left lane).
Table 2 below indicates each of the intersection types, the facilities that are included in each, and the location of each of the intersection types. Figures 7-12 are schematics showing the camera set ups for each intersection of study.
34 Table 2 - Intersection Types
Intersection Type
Locations Intersection Configuration Description
1
Runnymede and Annette (all directions) Jones and Dundas (all directions)BL, 1T, LTL The approach has an on
street bike lane (BL), one through lane (1T) and a left turn lane (LTL)
2
Sherbourne and Wellesly (north and south bound approaches)CT, 1T, LTL, PHASED LEFT BOX
The approach has a cycle track (CT), one through lane (1T), a left turn lane (LTL), and a two-phase left turn box (PHASED LEFT BOX)
3
St. George and Hoskin (all directions)BL, 1T, LTL, BIKE BOX The approach has an on-street bike lane (BL), one through lane (1T), a left turn lane (LTL) and a bike box (BIKE BOX)
4
St. George and College (South bound approach)BL, 1T, LTL, BIKE BOX, AG The approach has an on-street bike lane (BL), one through lane (1T), a left turn lane (LTL), a bike box (BIKE BOX) and an advanced green left turn signal (AG).
5
Spadina and Harbord (north and south bound approaches)BL, 2T, LTL, AG The approach has an on-street bike lane (BL), two through lanes (2T), a left turn lane (LTL) and an
advanced green leftturn
35 Figure 7 - Camera set up - Annette Street and Runnymede Road
36 Figure 9 - Camera set up - Hoskin Avenue and St. George Street
37 Figure 11 - Camera set up - Sherbourne Street and Wellesley Street
38
Table 3 provides a detailed summary of the data collection details at each intersection
of study.
Table 3: Data Collection Details
Location Date and Time Equipment Data Collector Characteristics
Runnymede Road and Annette Street in Toronto, Ontario
9/23/2014 3:23 pm – 5:00 pm
2 Sony Handycam Video Cameras: 1 on top of a community notice board and one strapped to a telephone pole Alex Mereu (thesis author) Digital Video Data of Cyclists navigating the intersection. From this video data, the thesis author created a database of cyclist behaviors. Dundas Street and
Jones Street
9/24/20142014 3:12 pm to 5:03 pm
2 Sony Handycam Video Cameras: both strapped to telephone poles Sherbourne Street and
Wellesley Street
10/9/2014 9:11 am to 10:40 am
2 Sony Handycam Video Cameras: One strapped to a telephone pole and one sitting on top of a community notice board
Harbord Street and Spadina Street
10/27/2014 4:00 pm to 6:00 pm
2 Sony Handycam Video Cameras: one sitting on top of a community notice board and one on top of a bus shelter St. George Street and
College Street
10/8/2014 9:00 am to 10:30 am
2 Sony Handycam Video Cameras: one sitting on a bus shelter and one sitting on a garden stone
St. George Street and Harbord Street
9/25/2014 3:43 pm to 5:30 pm
2 Sony Handycam Video Cameras: 1 on top of a community notice board and one strapped to a telephone pole
4.4
Data Limitations and Reliability
The behavior and other descriptive variables of 1650 cyclists were recorded in this study. However, of those 1650, just 322 of them were navigating a left turn direction. In some of the low volume intersections studied, the sample of left turning cyclists was quite small.
39
Since each intersection had a similar amount of recorded time, the sample of left turning cyclists at the low volume intersections is lower than that of the left turning cyclists at the high volume intersections. If further studies are to be conducted using this methodology, more filming time at low volume intersections would be required, compared to that of the high volume intersections to ensure similar sample sizes across intersections and to ensure the sample of left turning cyclists is large enough at the low volume intersections.
It would be valuable to compare the rule compliance results of each intersection with the collisions at each intersection. However, collisions occurring at the intersections of study are very few over the last 5 years, and some of the intersection designs have been modified over the same time period. Also, collisions that are reported are believed to only represent 10% of collisions as a whole. Trying to draw comparisons or correlation between collisions at each intersection and the rule compliance at each intersection is therefore not reliable at this scale. If an inventory of all the intersections could be made and the rule compliance at each of those, that would be a worthwhile study moving forward. Since only 6 intersections were observed in this research, no reliable conclusions could be made between these two variables.
5.0
CHAPTER 5: RESULTS
5.1
Component 1 Results
The results of component 1 are intended help to improve the input parameters for cyclists within existing micro-simulation traffic models. The distributions of desired speeds for cyclists, as well as the affect grade and facility type have on desired speed are included in these results.
The Data
The database is comprised of data points, recorded every 3 seconds of a participants trip using a GPS unit. Each participant has a separate database that consists of several trips. For each study participant and each cycling trip, the GPS unit records the start time, coordinates,
40
altitude, and cyclists speed every 3 seconds. Table 4 contains an example of the outputs of the information in the form of an excel database. Further details regarding data collection can be found in the previously referenced study by (Rewa, 2012).
Table 4: Example Data Points
Track # Date Start Time Lat Long Alt m Speed km/hr 1 8/26/2010 18:16:22 43.44563 N 80.46718 W 301.9268 5 1 8/26/2010 18:16:27 43.44561 N 80.46721 W 297.532 6 1 8/26/2010 18:16:32 43.44559 N 80.46719 W 291.3782 8
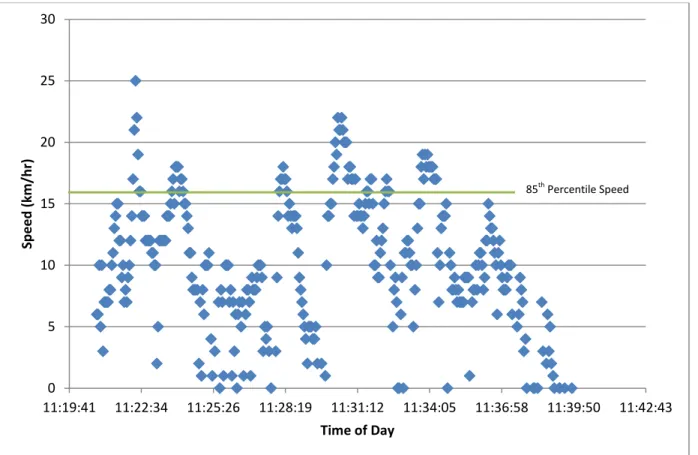
From this information, the conclusions from this thesis were developed. For example, the speed over the course of one participant’s trip is show in Figure 13. The 85th percentile speed of the cyclist was calculated based on the 85th percentile speed across all trips and was included in the distribution of desired speeds across all cyclists is shown in Figure 14. As an example, the desired speed for cyclist in Figure 13 was 16 km/hr.
Figure 13: 1 Participant’s Journey - Speed over time
0 5 10 15 20 25 30 11:19:41 11:22:34 11:25:26 11:28:19 11:31:12 11:34:05 11:36:58 11:39:50 11:42:43 Sp e e d (k m /h r) Time of Day 85th Percentile Speed