Envelopment Analysis in the evaluation of thermal
power plant performance.
by Almero de Villiers
Thesis presented in partial fulfilment of the requirements for the degree of
Master of Science in Engineering at the Stellenbosch University
Supervisor: Prof. H.J. Vermeulen
Department of Electrical and Electronics Engineering
ii
Declaration
By submitting this thesis electronically, I declare that the entirety of the work
contained therein is my own, original work, that I am the authorship owner thereof
(unless to the extent explicitly otherwise stated) and that I have not previously in its
entirety or in part submitted it for obtaining any qualification.
Date: ………
Copyright © 2015 Stellenbosch University. All rights reserved.
iii
Abstract
Recent capacity constraints on the South African power grid, coupled with the economic and environmental implications of increasing energy requirement, has given rise to major efforts to implement energy management initiatives in the industrial, commercial and residential load sectors. These efforts are supported by the construction of multiple new power plants, both thermal and renewable in nature. Additionally, the Energy Efficiency (EE) of existing plants is being optimised, which requires accurate performance evaluation and benchmarking as part of plant diagnostic and Measurement and Verification (M&V) exercises.
Energy management exercises require accurate tracking of power plant efficiency. In this project a South African coal-fired power plant is used as a test case, and is analysed utilising both classical and Data Envelopment Analysis (DEA) based EE evaluation methods in an attempt to track plant efficiency over time and in relation to similar US plants. DEA is a non-parametric linear programming-based benchmarking technique used to comparatively evaluate multiple peer branches. The historical plant data used in this project is provided in monthly intervals, but is of low quality, with measured fuel consumption values out of sync with actual fuel consumption values. For this reason data averaging is also considered. A software application is developed to analyse historical plant data, supported by the development of a relational database. This database allows for permanent storage and access of historical plant data while the software application incorporates all relevant analysis methodologies and graphic user interface.
The classical efficiency evaluation methods are found to provide a general overview of actual plant performance, but do not consider plant context, often making results ambiguous. The methods are also limited to energy datasets, and cannot incorporate additional factors that may be relevant to plant performance. Higher quality data is recommended to increase the accuracy of results.
M&V interventions include an energy audit before and after an EE implementation. Pre-implementation data is referred to as the baseline and is used to evaluate the positive impact of the implementation. Regression analysis is investigated as a means of gaining additional insight into the effect of additional factors on overall plant efficiency, but also as a means of baseline adjustment in an M&V context. The regression analysis study does not produce significant results, but increasing the quality of measured plant datasets may allow for more useful results.
The DEA efficiency tracking methodology is found to be of use when additional factors are incorporated with energy data, and can provide a brief overview of performance between plants. When a single plant is evaluated over time the process can also easily identify inefficient periods,
iv
although additional insight is required to establish the sources of these inefficiencies. DEA is thus not a complete replacement for classical EE methods, but rather a useful supplementary tool in efficiency evaluation. The accuracy of its results is highly susceptible to the quality of data used. Evaluation of individual plant component inputs and outputs rather than overall plant inputs and outputs would make for a useful future study.
v
Opsomming
Onlangse kapasiteitstekortkominge op die Suid-Afrikaanse kragnetwerk sowel as ekonomiese en omgewingsimplikasies van toenemende energiebehoeftes het aanleiding gegee tot 'n intensifisering van die pogings om energie bestuursinisiatiewe in die industriële, kommersiële en residensiële ladingsektore te implementeer. Hierdie pogings word vergestald deur onder andere die skepping van nuwe en alternatiewe opwekkingsfasiliteite. Verder word die bestaande sentrales se Energie-Doeltreffendheid (ED) geoptimaliseer, wat die verbetering van akkurate prestasie-evaluering en maatstawwe as onontbeerlike element van die sentrale se diagnostiese en Meting en Verifikasie (M&V) oefenginge vereis.
Energie bestuuroefeninge vereis die akkurate begeleiding van kragsentrale doeltreffendheid. In hierdie projek word ‘n Suid-Afrikaanse steenkool-aangedrewe kragsentrale gebruik as ‘n toets onderwerp, en die analise van beide die klassieke en Data Omhulsel Ontleding (DOO) gebaseerde ED evalueringsmetodes in ‘n poging om die kragsentrale se doeltreffendheid na te spoor oor ‘n gegewe tydperk in verhouding met soortgelyke Amerikaanse kragsentrales. DOO is 'n nie-parametriese lineêre programmering-gebaseerde maatstaf tegniek wat gebruik word om vergelyking te tref met verskeie ander soortgelyke takke. Die historiese kragsentrale data wat in hierdie projek gebruik word, is verskaf in maandelikse frekwensie. Die kwaliteit van die data word bevraagteken. Dit bevat gemete brandstofverbruik waardes wat uit verhouding is met die werklike verbruikswaardes. Om hierdie rede word die data wat verkry is vergemiddeld. ‘n Sagteware program is ontwikkel om historiese kragsentrale data te analiseer en word ondervang deur die ontwikkeling van ‘n verwante databasis. Hierdie databasis sorg vir permanente storing en toegang tot die historiese kragsentraledata, terwyl die sagteware program alle relevante analise metodes en ‘n grafiese gebruikerskoppelvlak insluit.
Die klassieke doeltreffendheid-evaluering metodes verskaf ‘n algemene oorsig oor die werklike prestasie van die kragsentrale, maar neem nie die kragsentrale se unieke omstandighede in ag nie wat veroorsaak dat die resultate dubbelsinnig van aard kan wees. Die metodes word beperk tot energie datastelle en kan nie bykomende faktore wat relevant is tot die kragsentrale prestasie assimuleer nie. Hoër data kwaliteit word aanbeveel om die akkuraatheid van die resultate te verhoog.
‘n M&V intervensie bevat ‘n energie-oudit voor en na die ED implementering. Die basislyn is voorimplementerings data en word gebruik om die positiewe impak van die implementering te evalueer. Regressie-analise is ondersoek as ‘n metode tot die verkryging van bykomende insig in die effek van bykomende faktore op algehele opwekkingseenheid doeltreffendheid en ook as 'n middel
vi
om die basislyn aanpassing in 'n M&V konteks te bepaal. Die regressie-analise studie bied nie beduidende resultate nie. Die verhoging van die kwaliteit van die gemete kragsentrale datastelle mag moontlik bruikbare resultate verskaf.
Die gebruik van die DOO doeltreffendheid metode is effektief wanneer daar bykomende faktore by gewerk word tot die energie data en kan as n kort vergelykende oorsig van die prestasie tussen die verskillende kragsentrales gebruik word. Wanneer ‘n enkele kragsentrale oor n tydperk evalueer word kan die proses ook maklik ondoeltreffende periodes identifiseer. Bykomende insig is nodig om die bronne van hierdie ondoeltreffendheid te bevestig. DOO is dus nie 'n volledige vervanging vir klassieke energie-doeltreffendheid metodes nie maar eerder 'n nuttige aanvullende hulpmiddel van doeltreffendheid evaluering en verifikasie. Die akkuraatheid van die resultate is baie vatbaar vir die gehalte van die data wat gebruik word. Evaluering van individuele kragsentrale komponent insette en uitsette eerder as algehele kragsentrale insette en uitsette sou as grondslag van n toekomstige studie-onderwerp kan dien.
vii
Acknowledgments
I would like to thank Prof HJ Vermeulen for his valuable guidance and efforts throughout this project, without which this study would not have been possible. Furthermore I would like to thank my mother, father, sister and Anelle for the massive amount of support they provided during the past few months.
viii
Contents
Abstract ... iii Opsomming ... v Acknowledgments ... vii Contents ... viiiList of figures ... xiii
List of tables ...xvi
List of abbreviations ... xix
1 Overview of project ... 1
1.1 Introduction ... 1
1.2 Project motivation ... 1
1.3 Project description ... 3
1.3.1 Overview of project description ... 3
1.3.2 Research objectives ... 4
1.3.3 Key questions ... 5
1.3.4 Research tasks ... 6
1.4 Document structure ... 7
2 Literature study ... 9
2.1 Overview of literature study ... 9
2.2 Coal fired power generation ... 9
2.2.1 Overview of coal fired power generation ... 9
2.2.2 Entropy and heat engine concepts ... 10
2.2.3 Coal fired power plant operation and energy flow ... 11
2.2.4 Types of coal ... 14
2.2.5 Climatic, operating and design factors affecting plant efficiency ... 14
ix
2.3 Measurement and verification ... 16
2.3.1 Overview of measurement and verification ... 16
2.3.2 Typical energy efficiency and demand side management project stages ... 16
2.3.3 Measurement and verification methodology ... 17
2.3.4 Typical measurement and verification project stages ... 19
2.4 Relational databases ... 21
2.4.1 Overview of relational databases ... 21
2.4.1 Database normalisation ... 22
2.4.2 Relational database structures ... 22
2.4.3 Database management systems and query languages ... 24
2.4.4 WAMP server ... 24
2.5 Integrated development environments ... 24
2.5.1 Overview of integrated development environments ... 25
2.6 Software design ... 26
2.6.1 Overview of software design ... 26
2.6.2 Unified modelling language ... 26
2.6.3 The unified process ... 27
2.7 Statistical methods ... 29
2.7.1 Overview of statistical methods ... 29
2.7.2 Coefficient of determination (R2) ... 29
2.7.3 Root mean square error ... 30
2.7.4 Mean absolute error ... 30
2.7.5 Correlation ... 30
2.8 Data envelopment analysis in plant efficiency evaluation ... 31
2.8.1 Overview ... 31
2.8.2 Other authors' findings in thermal power plant DEA efficiency ... 31
2.8.3 Variations on power generation efficiency DEA ... 33
x
3 Theory of efficiency evaluation ... 34
3.1 Overview ... 34
3.2 Classical energy efficiency evaluation ... 34
3.2.1 Overview ... 34
3.2.2 Efficiency terms ... 34
3.2.3 Plant efficiency evaluation methods ... 35
3.3 Data envelopment analysis ... 36
3.3.1 Overview ... 36
3.3.2 Introduction to data envelopment analysis ... 36
3.3.3 History of data envelopment analysis... 37
3.3.4 DEA example ... 38
3.3.5 The Charnes, Cooper and Rhodes model ... 40
3.3.6 The envelopment model ... 43
4 Database and application development ... 47
4.1 Overview of database and application development ... 47
4.2 Database development ... 47
4.2.1 Overview of database development ... 47
4.2.2 Database structure for projects ... 47
4.2.3 Database structure for plant and unit ... 49
4.2.4 Database structure for profile sets, profiles and profile data ... 53
4.2.5 Database implementation and testing ... 57
4.3 Application development ... 58
4.3.1 Overview of application development ... 58
4.3.2 Inception phase ... 58
4.3.3 Elaboration phase ... 60
4.3.4 Construction phase ... 64
4.3.5 Transition phase ... 73
xi
5.1 Research objectives and analysis methodology ... 75
5.1.1 Data acquisition ... 75
5.2 Plant configurations ... 75
5.2.1 Plant A ... 76
5.2.2 Plant B ... 76
5.2.3 Plant C ... 76
5.3 Summary of case studies ... 76
5.3.1 Overview of classical energy efficiency evaluation case studies ... 77
5.3.2 Overview of regression analysis case studies ... 77
5.3.3 Overview of DEA energy efficiency tracking case studies ... 77
5.4 Classical efficiency tracking analysis results ... 78
5.4.1 Overview ... 78
5.4.2 Daily classical energy efficiency tracking ... 78
5.4.3 Monthly classical energy efficiency tracking ... 79
5.4.4 Classical energy efficiency tracking with monthly averaging ... 82
5.4.5 Classical energy efficiency tracking with two year averaging ... 83
5.5 Regression analysis of classical efficiency results ... 84
5.5.1 Overview ... 84
5.5.2 Regression analysis for coal moisture content data ... 84
5.5.3 Regression analysis for monthly average capacity factor ... 85
5.5.4 Regression analysis for monthly average capacity factor ... 85
5.5.5 Observations for regression analyses ... 85
5.6 DEA efficiency tracking ... 86
5.6.1 Overview ... 86
5.6.1 DEA return-to-scale investigation for EE tracking ... 86
5.6.2 DEA EE analysis ... 87
5.6.3 DEA efficiency tracking using fuel mass and calorific content ... 88
xii
5.6.5 DEA efficiency tracking with capacity factor ... 93
5.6.6 DEA eco-efficiency tracking... 94
5.6.7 DEA efficiency tracking with monthly averaging ... 95
5.6.8 DEA efficiency tracking with calendar year averaging ... 101
5.6.9 Observations for DEA efficiency tracking ... 103
6 Conclusions and recommendations ... 104
6.1 Overview of conclusions and recommendations ... 104
6.2 Conclusions and recommendations ... 106
6.2.1 Design and development ... 106
6.2.2 Case study and analysis conclusions and recommendations ... 107
References ... 113
Appendix A : Classical energy efficiency results ... 119
Appendix A.1 : Plant A daily energy efficiency results ... 119
Appendix A.2 : Monthly energy efficiency results ... 130
Appendix B : DEA energy efficiency results ... 132
Appendix B.1 : Return-to-scale DEA results ... 132
Appendix B.2 : Energy efficiency tracking results ... 134
Appendix B.3 : DEA mass and calorific content analysis results ... 135
Appendix B.4 : DEA efficiency tracking with climate factors ... 135
Appendix B.5 : DEA efficiency with capacity factor ... 137
Appendix B.6 : DEA efficiency tracking of plant environmental impact ... 138
Appendix C : DEA energy efficiency with monthly averaging results... 138
Appendix C.1 : Monthly averaging results ... 138
Appendix D : DEA energy efficiency with averaging over multiple calendar years results ... 142
xiii
List of figures
Figure 1-1: Project components ... 7
Figure 2-1: Basic heat engine [13] ... 10
Figure 2-2: Entropy diagram for typical Rankine cycle [19] ... 13
Figure 2-3: Typical energy efficiency and demand side management project stages [6].... 17
Figure 2-4: Visual representation of Equation ( 2.6 ) [5]. ... 18
Figure 2-5: Visual summary of M&V options [5] [6]. ... 19
Figure 2-6: Summary of M&V project structure [6]. ... 20
Figure 2-7: Visualisation of typical relation [28]. ... 22
Figure 2-8: Visual representation showing PK and FK operation [32]. ... 23
Figure 2-9: Link table structure. ... 23
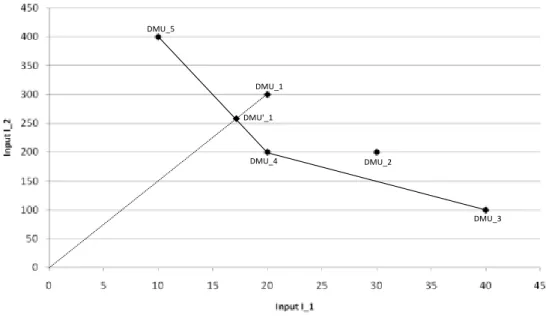
Figure 3-1: Graphical representation of DEA example [10]. ... 39
Figure 3-2: Input and output orientated DEA results. ... 43
Figure 3-3: Non-increasing and non-decreasing RTS. ... 45
Figure 4-1: Design of project table. ... 48
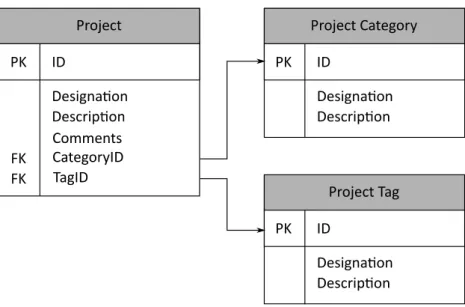
Figure 4-2: Design of project, project category and project tag tables. ... 48
Figure 4-3: Design of plant, plant category and plant tag tables. ... 49
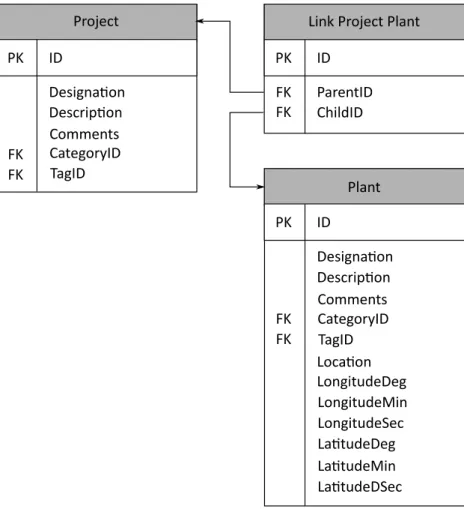
Figure 4-4: Design of plant, link project plant and project tables. ... 50
Figure 4-5: Design of plant, link unit, unit, unit category and unit tag tables. ... 52
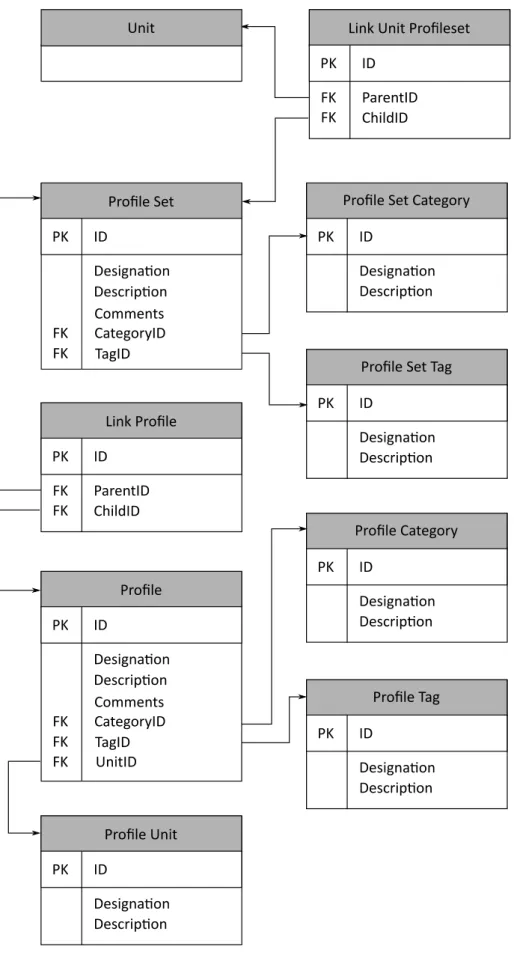
Figure 4-6: Design of linkunitprofileset, profileset, profileset category, profileset tag, link profile, profile, profile category, profile tag, profile unit tables. ... 54
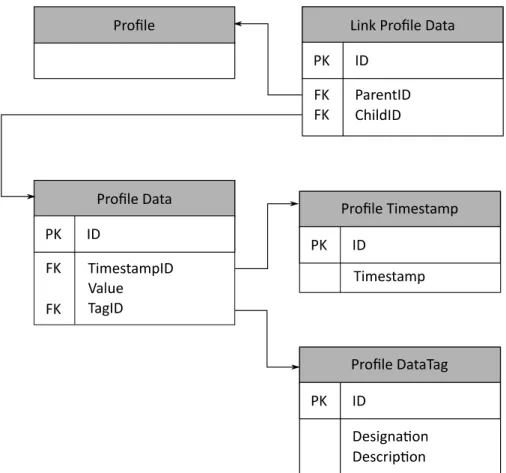
Figure 4-7: Design of profile data, link profile data, profile timestamp and profile data tag tables. .. 56
Figure 4-8: Design of complete relational database. ... 57
Figure 4-9: Use case diagram for software application. ... 59
Figure 4-10: Transitional system architecture showing application data flow. ... 60
xiv
Figure 4-12: Key for Figure 4-11. ... 62
Figure 4-13: Use case diagram for root module. ... 63
Figure 4-14: Use case diagram for efficiency analysis module. ... 63
Figure 4-15: Use case diagram for DEA engine module. ... 64
Figure 4-16: Activity diagram key. ... 65
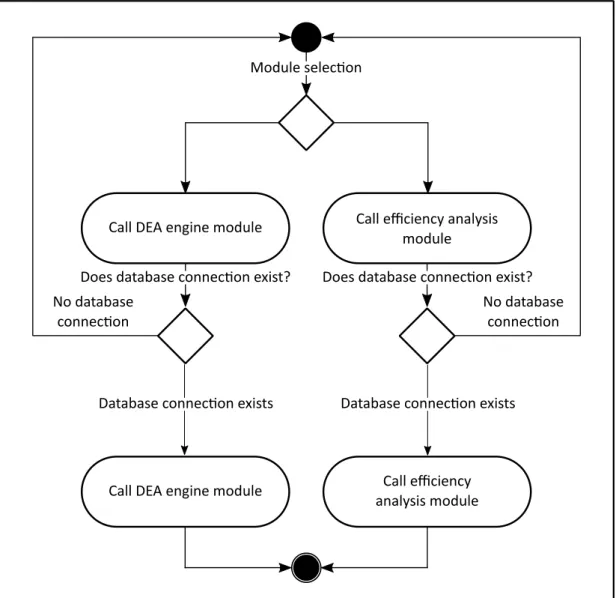
Figure 4-17: Activity diagram for root module showing component module calls.... 66
Figure 4-18: Activity diagram for efficiency analysis module. ... 67
Figure 4-19: DEA engine and lp_solve51 DLL interactions.... 68
Figure 4-20: Activity diagram for DEA engine module. ... 72
Figure 5-1: Daily actual efficiency for Plant A. ... 79
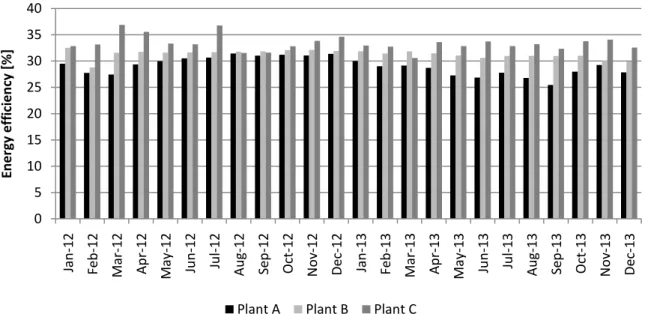
Figure 5-2: Monthly energy efficiencies of Plant A, Plant B and Plant C. ... 80
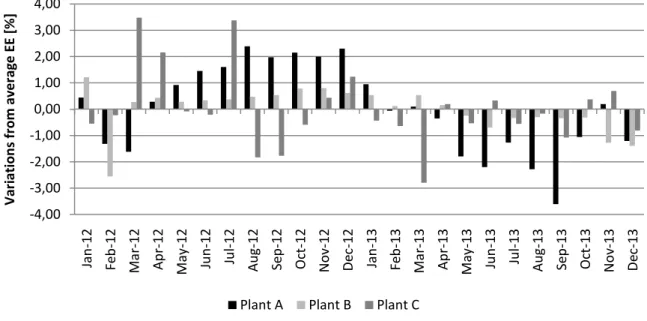
Figure 5-3: Monthly variations from average EE for case study plants. ... 81
Figure 5-4: Energy efficiency for case study plants with monthly averaging. ... 82
Figure 5-5: Monthly variations from average EE for case study plants with monthly averaging. ... 83
Figure 5-6: Energy efficiency for case study plants with two year averaging. ... 83
Figure 5-7: Monthly variations from average EE for two year averaging. ... 84
Figure 5-8: Scaled monthly DEA energy efficiency plant comparison results. ... 88
Figure 5-9: EE vs. mass/calorific DEA results for Plant A. ... 90
Figure 5-10: EE vs. mass/calorific DEA results for Plant B. ... 90
Figure 5-11: EE vs. mass/calorific DEA results for Plant C. ... 91
Figure 5-12: DEA mass analysis for Plant A including coal moisture content. ... 93
Figure 5-13: DEA results including monthly average capacity factor for Plant A. ... 94
Figure 5-14: DEA eco-efficiency and EE for Plant A. ... 95
Figure 5-15: Results of EE and EE DEA for Plant A with monthly averaging. ... 96
Figure 5-16: Results of EE and EE DEA for Plant B with monthly averaging. ... 97
xv
Figure 5-18: EE DEA with and without three month moving average for Plant B. ... 98
Figure 5-19: Results of DEA with coal moisture content three month moving average and EE with
three month moving average for Plant A ... 99
Figure 5-20: Results of fuel Mass/calorific value DEA for Plant A with and without three month
moving average. ... 100
Figure 5-21: Eco-efficiency DEA results for Plant A with monthly averaging. ... 101
Figure 5-23: EE DEA results for case study plants with two year yearly average data.... 102
Figure 5-24: Fuel mass and calorific value DEA results for Plant A with two year yearly average data.
... 103
xvi
List of tables
Table 2-1: Rankine and Brayton cycles [13] [20] ... 11
Table 2-2: EEDSM project stage details [6]. ... 17
Table 2-3: Summary of typical M&V process [5] [6]. ... 20
Table 2-4: Interpretation of correlation values [46]. ... 31
Table 3-1: Scale efficiency example [10]. ... 35
Table 3-2: DEA example. ... 38
Table 3-3: Results of DEA on Table 3-2. ... 38
Table 3-4: Output orientated DEA example. ... 42
Table 3-5: Return to scale definitions. ... 44
Table 3-6: RTS constraints to envelopment model [10]. ... 46
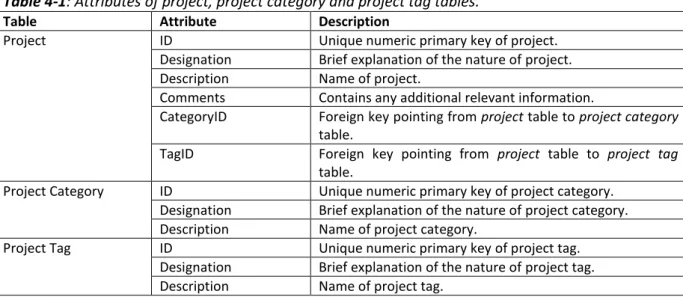
Table 4-1: Attributes of project, project category and project tag tables. ... 49
Table 4-2: Attributes of plant, plant category, plant tag and link project plant tables. ... 50
Table 4-3: Attributes of unit, unit category, unit tag and link unit tables. ... 52
Table 4-4: linkunitprofileset, profileset, profileset category, profileset tag, link profile, profile, profile category, profile tag, profile unit tables. ... 55
Table 4-5: Attributes of profile data, profile data tag, profile timestamp and link profile data tables. ... 56
Table 5-1: Plants analysed in case study. ... 76
Table 5-2: Inputs and outputs used in results of EE analysis between plants. ... 80
Table 5-3: Correlation between Plant A EE and unit up-time. ... 81
Table 5-4: Results of regressions for Plant A EE vs. coal moisture content. ... 84
Table 5-5: Results of regressions for Plant A EE vs. capacity factor. ... 85
Table 5-6: Results of regressions for Plant A EE vs. coal calorific value.... 85
Table 5-7: RMSE and correlations between actual and various RTS orientations DEA. ... 86
xvii
Table 5-9: DEA energy efficiency plant comparison results. ... 87
Table 5-10: Inputs and outputs used in DEA EE analysis between plants with fuel mass and calorific content. ... 88
Table 5-11: Average calorific content of coal for case study plants. ... 89
Table 5-12: RMSE and correlation between EE and mass/calorific value DEA results ... 89
Table 5-13: Correlations between DEA energy efficiency and climate factors. ... 91
Table 5-14: Inputs and outputs used in DEA EE analysis for Plant utilising coal moisture content data. ... 92
Table 5-15: Inputs and outputs used in DEA EE analysis for Plant utilising capacity factor data ... 93
Table 5-16: Inputs and outputs used in comparative DEA eco-efficiency analysis ... 94
Table 5-17: Results of comparative eco-efficiency DEA. ... 95
Table 5-18: Inputs and outputs used in DEA EE analysis for Plant utilising coal moisture content data ... 98
Table 5-19: Inputs and outputs used in DEA EE analysis for Plant B with fuel mass and calorific content and monthly averaging. ... 99
Table 5-20: Inputs and outputs used in comparative DEA eco-efficiency analysis ... 100
Table 5-21: Correlation and RMSE between EE DEA and EE results for two year yearly average datasets. ... 102
Table 5-22: Inputs and outputs used in DEA EE analysis for Plant A with fuel mass and calorific content and two year averaging. ... 102
Table A-1: Results of daily energy efficiency analysis for Plant A. ... 119
Table A-2: Monthly energy efficiencies of case study plants. ... 130
Table A-3: Monthly unit up-time for Plant A. ... 132
Table B-1: Various RTS EE results for Plant A.... 132
Table B-2: Various RTS EE results for Plant B. ... 132
xviii
Table B-4: Monthly energy efficiencies of Plant A, Plant B and Plant C. ... 134
Table B-5: Scaled monthly DEA energy efficiency plant comparison results. ... 134
Table B-6: Monthly DEA mass and calorific value results for Plant A, Plant B and Plant C. ... 135
Table B-7: Average monthly maximum temperature and total monthly rainfall for case study plants. ... 135
Table B-8: DEA EE and average monthly coal moisture content for 2012. ... 136
Table B-9: DEA including coal moisture content for Plant A. ... 136
Table B-10: Monthly capacity factor for case study plants. ... 137
Table B-11: DEA including monthly average capacity factor for Plant A. ... 137
Table B-12: DEA Eco-efficiency results for Plant A. ... 138
Table C-1: Monthly average EE and DEA results for Plant A. ... 138
Table C-2: Moving average EE and DEA results for Plant B. ... 139
Table C-3: Results of DEA with fuel mass and coal moisture content for Plant A with monthly averaging. ... 140
Table C-4: Results of DEA with fuel mass and calorific content with monthly averaging. ... 140
Table C-5 : DEA eco-efficiency results for Plant A with monthly averaging. ... 140
Table D-1: EE DEA results for case study plants with two year yearly average data. ... 142
Table D-2: Fuel mass and calorific value DEA results for case study plants with two year yearly average data. ... 142
xix
List of abbreviations
DB Database
DBMS Database management system
DEA Data envelopment analysis
DLL Dynamic link library
DMU Decision making unit
DSM Demand side management
EE Energy efficiency
EEDSM Energy efficiency and demand side management
EM Energy management
ESCo Energy service company
FK Foreign key
GJ Gigajoule
GUI Graphic user interface
IDE Integrated development environment
J Joule
kg Kilogram
KW Kilowatt
KWh Kilowatt hour
LP Linear programming
M&V Measurement and verification
MAE Mean absolute error
MJ Megajoule
MW Megawatt
MWh Megawatt hour
PK Primary key
QL Query language
RMSE Root mean square error
xx
SQL Structured query language
UML Unified modelling language
UP Unified process
VCL Visual component library
WAMP Windows apache MySQL PhP
1
Overview of project
1.1
Introduction
The South African power grid has been experiencing severe capacity constraints in generation and transmission in recent years, with a dramatic decrease in the size of the allocated reserve margin [1]. This, coupled with the decrease in the availability of fossil fuels, and the economic and environmental implications of the globally increasing energy requirement [2] has given rise to major efforts to implement Energy Management (EM) initiatives in all load sectors, including the industrial, commercial and residential sectors [3]. These efforts are supported by the construction of multiple new power plants, both thermal and renewable in nature. Additionally, the Energy Efficiency (EE) of existing plants is being optimised, which requires accurate performance evaluation and benchmarking as part of Measurement and Verification (M&V) exercises. There are several advantages to increased plant EE. These include both increased unit generation and reduced operating costs as well as reduced costs to the consumer. Also it is hoped that finite fuel will last longer and that the emission of the greenhouse gas CO2 and other pollutants will be reduced [4].
M&V exercises are used to determine the energy savings of an EE project, while providing unbiased feedback to all project stakeholders. This is done by measuring energy usage and demand before and after the completion of the intervention [5]. M&V baselines are usually constructed using historical data and adjusted where necessary to produce more accurate results. M&V activities are utilised by Eskom to assess and monitor the performance of EE projects [6] and, internationally, are required in certain federal EE contracts [5]. To be of use, it is imperative that power plant M&V activities need to accurately track plant inputs and outputs, as well as overall plant efficiency [6]. This efficiency may need to be calculated using incomplete or low-fidelity datasets. Once the dataset is acquired, M&V personnel can potentially formulate plant baselines using additional plant information to implement accurate adjustments in performance.
Besides EE and M&V efforts, plant efficiency can be increased by the optimisation of existing internal practices and processes. This requires the continual and accurate tracking of plant efficiency, making it possible to identify the presence and nature of inefficiencies to be identified. The results of efficiency tracking can be used by plant management personnel to address these issues. Under-performance detection also allows management to easily monitor plant economics.
2
Currently almost 99% of South African electrical energy is generated by thermal plants [7], with a further 9600MW capacity increase under construction at the time of writing [8]. As such, EE projects focusing on thermal power plant efficiency have the potential to make significant positive impacts on national energy usage. South Africa has received funding from the world bank to build additional power plants, as well as to increase the efficiency of our existing plants. M&V serves as validation of these improvements [6]. If a plant is benchmarked over time, its inefficient periods are highlighted [9], which allow the sources of these inefficiencies to be identified and addressed. In addition, more efficient periods can be emulated in some way [10]. When evaluating the efficiency of a power plant, a useful exercise is benchmarking against other plants, so as to gain insight into the plant's comparative performance. The selection of these plants is important, as plant vintage, technology, fuel quality and geographical location can have significant impacts [11].
Thermal plants are often criticised for their negative impact on the environment. Power plants are responsible for almost 25% of all greenhouse gas emissions and are thus major contributors to global warming and climate change [2]. Coal, as the largest provider of energy, is also responsible for numerous other pollutant emissions such as sulphur dioxide (SO2), nitric oxide and nitrogen dioxide
(collectively as NOx) and particulate pollution [12], as well as ash and soot [11]. Coal fired plants
typically release 26,4kg of Carbon per GJ sent out [13]. Thus, alongside EE efforts, the "eco-efficiency" of thermal power plants is also being minimised, with multiple projects aiming to reduce plant emissions while increasing output [2] [3].
Traditional methods of evaluating power plant EE performance, such as heat-rate monitoring [13], are difficult and often produce inconclusive results due to a lack of online data and the complex nature of factors, such as environmental conditions, that determine the overall efficiency of the plants. Furthermore, the different national standards used for heat rate monitoring can produce results for the same plant that vary by as much as 2% [4]. The savings impacts of many individual EE interventions are small compared to the plant ratings, resulting in difficulties in extracting the savings impacts from noisy baselines. These methods may also be too rigid in structure to allow for use in both comparative benchmarking between individual plants and a time-based evaluation of a single plant e.g. month-to-month or year-to-year. Ambiguity can easily arise when determining the efficiency of a plant, as various plant components (such as the boiler, turbines etc) are often evaluated independently, rather than in the context of the entire facility [4].
Baseline adjustments are a crucial step in M&V, serving to account for external factors that may have a significant effect on project performance [5]. Baseline adjustment can also be used to account for changes in metering equipment or overall project scope at later stages [6]. The
3
methodologies used in adjustments need to be flexible so as to be used in any desirable project. However, there is, to date, no formal method dedicated to baseline adjustment when performing M&V in a power generation context.
Data Envelopment Analysis (DEA) is a data-oriented, non-parametric benchmarking technique that utilises linear programming as its basis. DEA comparatively evaluates numerous peer branches, or Decision Making Units (DMUs), making use of multiple numeric input and output categories [10], which can consist of any quantifiable values, thus allowing any factor deemed relevant to be incorporated in the analysis [14].
DEA has been used in the past to comparatively evaluate plants (both thermal and renewable) and serve as a plant benchmarking tool [15, 16]. The process has also been used in other power generation-related roles, such as an environmental impact assessment tool [17] and in renewable energy contexts [18]. Regression analysis has also been combined with DEA [19]. The efficiency metric tracking capabilities of DEA may allow it to serve as a valuable diagnostic tool for power plant managers. DEA may also present a novel means to gain insight into the EE performance of power plants by tracking a metric of performance efficiency over a given timeline, serving as a valuable benchmarking tool for M&V applications. When applied to plant datasets, it may help identify the periods in which the plant did not perform as well as desired. DEA may also serve to identify the nature of any plant inefficiencies and can serve to provide insight into the economic performance of the plant.
1.3
Project description
1.3.1
Overview of project description
The aim in this project is to evaluate the overall efficiency of a target South African coal fire power plant by utilising classical efficiency evaluation methods. The plant is benchmarked against a US plant of similar design and vintage, as well as a modern US coal fired plant. This is done to establish the relative performance of the South African plant. The efficiencies of all three plants are tracked over time, to identify any similarities in seasonal trending. Energy efficiency efforts are imposed on the target plant during the first year of data. Thus, the efficiency results are analysed to establish the extent of these energy savings. Results are used in regression analyses to gain additional insight into the factors that may affect plant performance. In addition to classical efficiency evaluation methods, DEA efficiency tracking is employed to incorporate external factors in the analysis, potentially highlighting new plant information. DEA's ability to provide additional insight into plant performance is examined. Both classical and DEA efficiency evaluation methods must comply with the following:
4
Must make use of historical plant data.
Must utilise classical efficiency evaluation techniques and DEA theory, models and orientations to evaluate plant efficiency.
Must include an implemented database-centred software application.
The implementation of both the classical and DEA efficiency evaluation methodologies includes the development of a software application. This is an integral part of the project, as evaluating historical plant data can be complicated and an automated process will aid in this study. This application makes use of classical efficiency methods as well as various DEA models and orientations to analyse power plant datasets. The specific software application is thus considered a project outcome. Furthermore, regression analysis is investigated as a means of providing further insight into the effect of additional parameters, such as climate and operation datasets, on plant performance, as well as a method of baseline adjustment in the context of M&V.
During this project it is attempted to track the efficiency of the target plant via time-based efficiency tracking, as well as in comparison to other plants. An outcome of the project is thus accurate efficiency records for the target plant. Regression analysis is preformed using these results and additional plant datasets. In this project it is attempted to track the efficiency of plants over time using DEA. Various categories of inputs and outputs are considered to produce results. These results are compared to classical efficiency analysis data and their accuracy evaluated. Thus, another expected output of the project is accurate DEA-derived efficiency records.
1.3.2
Research objectives
In view of the considerations in section 1.3.1, this project aims to investigate the performance of the target South African plant both over time and in comparison to similar US plants. This is done by making use of both classical and DEA-based efficiency evaluation theory. The primary research objectives are listed below:
To perform a literature study to research relevant topics, including coal fired power generation, measurement and verification, relational databases, integrated development environments, software design, statistical methods for data validation, and previous research into DEA's use in power generation contexts.
To evaluate the efficiency of a South African target plant over time, as well as in comparison to similar US plants, using classical efficiency evaluation methods. Inefficiencies are identified and investigated. Seasonal variations in target plant performance are identified and compared to those of US plants.
5
To determine the extent to which regression analysis can provide additional insight into plant performance.
To determine the usefulness of DEA as a tool to track the energy efficiency performance of the target plant, as well as a comparison method with other plants. DEA's ability to identify not only the presence but also the source of plant inefficiencies is investigated. Furthermore, DEA's ability to incorporate additional plant data, such as climatic, environmental impact, fuel mass and calorific value, and capacity factor datasets, should be investigated as a means of gaining additional insights into plant performance.
To determine the required quality of data necessary to perform accurate classical efficiency analyses and DEA efficiency analyses on plants. The data accuracy, sampling rate and range of inputs and outputs should be considered, as well as the effect of averaging over multiple performance cycles, such as seasons or years.
To implement classical efficiency and DEA theory-based algorithms as part of a user friendly software application with back-end database support. This is supported by the development of a relational database structure that can be used to effectively store historical data used in this study.
This investigation must consider the following:
Historical generation data, both with and without monthly or yearly averaging.
Thermal power plants of various technologies and locations (in the case of this study the target plant is South African, while two additional US plants are also considered).
The utilisation of various regression (curve-fitting) models.
The utilisation of multiple DEA methodologies (envelopment and multiplier models, input- and output-orientated as well as various return-to-scale orientations).
1.3.3
Key questions
This project aims to answer the following key questions:
Can an efficient relational database be developed to store historical plant data and which database platform is best suited to this application?
Can regression analysis be used to make meaningful baseline adjustments when used as an M&V tool?
Can DEA serve as a useful diagnostic tool for power plant managers to both identify the presence and exact nature of a problem in plant operations?
6
What are the data criteria in terms of accuracy, sampling rate and choice of inputs and outputs necessary for accurate classical power plant efficiency and DEA efficiency tracking and can the accuracy an interpretation of classical and DEA efficiency results be improved by considering averaging over multiple performance cycle?
Can a software application be developed that connects to the previously implemented relational database to perform the above-mentioned efficiency evaluation tasks via a user-friendly graphical user interface (GUI)? Which software development platform is best suited to the development of this application? Which existing libraries can be used for DEA linear programming problems and which are most suited to this application?
1.3.4
Research tasks
This project consists of the following primary tasks:
The development of a Delphi-based application and corresponding GUI: This GUI should allow the user to select the plant or plants to be evaluated, the time-frame and the input/output categories to be included in the analysis. It should also allow the user to select the methodology to be utilised in the analysis, as well as whether a comparative or time-based analysis is performed.
The development and integration of an efficiency evaluation software module: This includes actual, scale and technical efficiency, as well as heat rate.
The development and integration of a DEA analysis engine: This comprises both envelopment and multiplier DEA models, the input- and output-orientated methodologies as well as constant, variable, non-increasing and non-decreasing return-to-scale orientations. An existing linear programming dynamic link library (DLL) is utilised.
Performing all necessary case studies: Case studies are performed for multiple thermal plants, allowing for the benchmarking of the target South African coal fired power plant against US plants of similar design. These case studies must make use of both classical and DEA-based efficiency evaluation methods, as well as regression techniques. Various classical efficiency methods as well as various DEA orientations are used, so as to examine which produces more accurate results in various contexts. Additional factors are incorporated into DEA case studies to establish if the process can provide additional insight into plant performance.
Analysing the results generated from case studies and deriving conclusions as well as making recommendations: The results of efficiency tracking and comparative benchmarking case studies are used to identify potential areas where energy savings may be achieved. The
7
results of classical efficiency evaluation, as well as those of regression analysis are used to determine the extent to which additional factors can effect overall plant efficiency. The accuracy of regression analysis results is evaluated, as well as the method's usefulness when used for M&V baseline adjustments. The accuracy of the DEA-based plant efficiency tracking method is determined, as well as its usefulness as both as a tool for usage in M&V exercises and in plant diagnostics.
The major components of the project are represented visually in Figure 1-1. These components include the design and implementation phase which covers the development of the relational database and the software application. The analysis and results component is also covered, which includes case study procedures as well as the formulation of results and conclusions. The final project component included is reporting.
Figure 1-1: Project components
1.4
Document structure
This project document consists of six chapters as well as three appendices. The structure is summarised below:
Chapter 1 comprises the project overview, project motivation and project description.
Chapter 2 comprises a literature study which shows research in topics relevant to this project, such as coal fired power generation, measurement and verification, relational
8
databases, integrated development environments, software design, statistical methods for data validation, and previous research into DEA's use in power generation contexts.
Chapter 3 comprises and examination of classical efficiency evaluation methods, including actual, technical and scale efficiencies, as well as heat rate, as well regression analysis in plant efficiency evaluation. An in-depth examination of Data Envelopment Analysis is performed, including the mathematical formulation of its various methodologies and model variations. These consist of the envelopment and multiplier models, input- and output-orientations, constant, variable, non-increasing and non-decreasing return-to-scale orientations.
Chapter 4 comprises the development and implementation phase of the project, consisting of the design and implementation of a relational database and a software application.
Chapter 5 comprises the results of the various case studies utilising classical efficiency evaluation, regression analysis, and DEA efficiency evaluation.
Chapter 6 comprises the conclusions that can be drawn from the case study results as well as recommendations for subsequent future projects.
9
2
Literature study
2.1
Overview of literature study
The focus during this project is the development of a software application to analyse single and multiple plants' efficiency using both classical and Data Envelopment Analysis (DEA) theory. The following aspects are investigated:
Coal fired power generation
o Entropy and heat engine concepts
o Plant operations and energy flow
o Types of coal
o Factors affecting plant efficiency
o Methods to increase plant efficiency
o Plant condition monitoring
Measurement and verification
o Energy efficiency and demand side management project stages
o Measurement and verification methodology
o Measurement and verification project stages
Relational databases
o Structures
o Management systems and query languages
Integrated development environments
Software design
o The unified modelling language
o The unified process
Statistical methods for data validation
Previous work using DEA in power generation
2.2
Coal fired power generation
2.2.1
Overview of coal fired power generation
Thermal fossil fuel power plants make up the vast majority of installed capacity, providing over 99% of South African [7] and 81% of global generated electrical energy [17]. Most thermal power plants use coal as primary fuel, as coal is an abundant fuel source, with an estimated 990 billion tons of reserves available [4].
10
Coal's popularity stems from being a relatively common but energy-dense resource [18], making it the ideal fuel for large-capacity baseload electrical energy supply. However, in recent years coal has come under fire for being a major contributor to greenhouse-gas release as well as other emissions that negatively impact the surrounding environment as well as human health [11]. For these reasons many developed countries have began replacing aging coal plants with more modern clean-burning gas-fired plants [11]. However, at the time of writing, approximately 40% of global electrical power is still produced from coal fired power plants [11, 4], making developments and research in coal fired electrical generation far from irrelevant.
2.2.2
Entropy and heat engine concepts
Thermal plants, in their simplest form, consist of heat engines, which harness heat from a hot source, extract part of this heat as work and reject the rest assigning to a cold sink. Such an engine is illustrated in Figure 2-1 [13].
Figure 2-1: Basic heat engine [13]
In Figure 2-1, TH and TC are the temperatures of the hot source and cold sink respectfully, while QH
and QC represent the heat transmitted from the hot source to the engine and the heat transmitted
from the engine to the cold sink respectively. W is the work done by the engine i.e. the portion of QC
converted into usable energy [13]. According to the second law of thermodynamics, no heat engine can be 100% efficient, as some energy will always be rejected to the cold sink [19]. Thermal efficiency is calculated as in Equation ( 2.1).
𝑇𝑒𝑟𝑚𝑎𝑙 𝑒𝑓𝑓𝑖𝑐𝑖𝑒𝑛𝑐𝑦 = 𝑊 𝑄𝐻 =𝑄𝐻− 𝑄𝐶 𝑄𝐻 = 1 −𝑄𝐶 𝑄𝐻 (2.1)
Entropy is defined as a measure of disorder or randomness when referring to the molecular nature of a system [19]. Unlike energy, which is conserved, entropy is seen to increase between processes. The loss of entropy (S) from a system is calculated as in Equation ( 2.2 ).
11
∆𝑆 =𝑄
𝑇
(2.2)
In Equation ( 2.2 ) Q represents heat, T represents temperature and ΔS represents the change in entropy. To find the maximum theoretical thermal efficiency of a heat engine, Equation ( 2.2 ) is applied to the heat engine illustrated in Figure 2-1. The work done, W, is assumed to be ideal and has no associated entropy. The entropy must increase between the hot source and the cold sink. This gives rise to Equation ( 2.3 ) [13].
𝑄𝐶 𝑇𝐶
≥𝑄𝐻 𝑇𝐻
(2.3)
Rearranging and substituting into Equation 2.6.1 gives Equation ( 2.4 ) 𝑇𝑒𝑟𝑚𝑎𝑙 𝑒𝑓𝑓𝑖𝑐𝑖𝑒𝑛𝑐𝑦 = 1 −𝑄𝐶
𝑄𝐻
≤ 1 −𝑇𝐶 𝑇𝐻
(2.4)
Therefore the maximum theoretical efficiency is given in Equation ( 2.5 ) 𝜂𝑚𝑎𝑥 = 1 −
𝑇𝐶 𝑇𝐻
(2.5)
As is visible in Equation ( 2.5 ), efficiency increases with the temperature of hot source and decreases with the temperature of cold source. Thus, efficiency is increased by increasing the temperature of hot source or decreasing the temperature of cold source [13].
2.2.3
Coal fired power plant operation and energy flow
In thermal power plants heat is generated from burning fuel which is used to boil water and make steam, which in turn drives turbines. Most plants utilise either the Rankine cycle or the Brayton cycle. The differences between the two are illustrated in Table 2-1 [13] [20].
Table 2-1: Rankine and Brayton cycles [13] [20]
Rankine cycle Brayton cycle
Typical
usage Baseload plants. Peaking plants.
Economics High initial cost, low running costs. Low initial cost, relatively high running costs.
Operating
12
Cycle
The Rankine cycle (and modifications on it) is most commonly used in coal fired power plants and thus major components are expanded on below.
2.2.3.1
Rankine cycle components and efficiencies
Coal handling, pulverisation and drying: From a stockpile, coal is typically dried and pulverised, before being sent to the furnace bunker. Larger pieces of coal burn less efficiently, making pulverisation important [21]. Moist coal also burns less efficiently, as heat energy is taken to evaporate coal moisture [4]. Effective coal drying can increase plant efficiency by up to 1,7%, depending on the grade of coal [21]. The furnace can be seen as the hot source when viewing the plant as a heat engine.
Boiler: Coal is burnt to heat the boiler, where water is converted into high -pressure steam. The process whereby heat is transferred to the water is known as heat addition [4]. Boiler losses tend to be relatively small, somewhere in the order of 10% to 20% [21, 13]. These inefficiencies are mainly caused by fuel not burning to completion and heat losses in plant emissions [13].
Turbine: High pressure steam is used to drive a turbine. Plants may utilise more than one turbine on the same shaft (driving the same generator) operating at different steam pressures. Turbine wear and tear can cause significant decreases in efficiency. Typical steam turbine efficiency falls between 45% and 57% [22].
Condenser: Once steam has passed through the turbine, it is sent to the condenser. Here it is cooled down and once again becomes liquid water. The condenser is sometimes cooled by air (known as dry cooling) but is usually cooled by water from a cooling tower, reservoir or the sea [13]. It can be seen as the cold sink when viewing the plant as a heat engine. The condenser creates a vacuum which draws spent steam out of the turbines. A deteriorated condenser may leak water or air, and will have a negative impact on overall efficiency, as the vacuum is lessened and thus steam is drawn less effectively from the turbine [21].
13
Electrical generator: Converts the mechanical motion of the turbine into electrical energy. Generators, coupled with the transformers used to connect to the utility grid, generally have an efficiency of approximately 99% [13].
Auxiliary sub-systems: These consist of the various minor components that supply the component listed above. All of these sub-systems consume auxiliary electrical power, usually drawing straight from the generating side of the plant. They may include [11, 21]:
o Induced draft fans: used to create a negative pressure or vacuum, usually in a smoke stack.
o Forced draft fans: used to create a positive pressure.
o Electrostatic precipitator: removes fine particulate matter from emission gases using electrostatic charge.
o Feed-water heaters: used to pre-heat water before being sent to the boiler.
o Air heaters: used to preheat air before being sent to the furnace.
o Soot blowers: remove soot and ash from furnace.
o Pumps, fans and conveyors.
2.2.3.2
Rankine cycle entropy
Figure 2-2 shows an entropy diagram for a typical Rankine cycle [19]. At point 1, the operating fluid is liquid water. This is sent to the boiler and heat is added, increasing the temperature. The fluid is steam at point 2, saturated at a certain pressure. The steam enters the turbine and expands, reaching point 3. The steam is sent to the condenser, where it is cooled down and returns to liquid form at point 4. The liquid water is pumped to the boiler and the cycle repeats [19].
14
2.2.4
Types of coal
Coal is a sedimentary rock made. up of organic and inorganic material and has been used for centuries as a fuel source [11]. Various classifications of coal exists and are covered below in brief:
Lignite: Often referred to as brown coal or immature coal, lignite is soft with a high moisture content of up to 66%. Lignite has a typical calorific value of 10 to 20 MJ/kg and a carbon content of between 25% and 35% [11].
Sub-bituminous: An intermediate quality coal, sub-bituminous coal usually has a calorific value of between 19 and 26 MJ/kg and a carbon content of 25% to 35% [11].
Bituminous: Typically has an energy content of 24 to 33 MJ/kg. Carbon content is high, ranging from 45% to 86% [11].
Anthracite: A mature form of coal with a carbon content of between 86 and 98%. Also called hard coal, anthracite has an energy value of approximately 35 MJ/kg [11].
2.2.5
Climatic, operating and design factors affecting plant efficiency
Thermal power plants are essentially heat engines (as described in section 2.2.2). This means that any factors affecting the temperature of the sinks or the transfer of heat between these sinks will have an effect on the overall efficiency of the system. These environmental factors consist of the following [4, 21]:
Ambient temperature: increases the temperature of the condenser coolant (cold sink), thus decreases useful energy released (see Figure 2-1) [21, 11].
Humidity: humid air is denser than dry air, which means that airflow to the compressor is reduced with more humid air. This results in a lower concentration of oxygen in the turbine, which means that the amount of unburnt fuel increases and thermal efficiency decreases. Humidity especially affects evaporative cooling systems [23]. Humid air also decreases the heat-absorbing characteristics of air used in condenser dry-cooling systems [21].
Air pressure: a lower air pressure leads to a lower concentration of oxygen, decreasing thermal efficiency, as described above [11].
Rainfall: rain may increase the amount of moisture in coal. A higher fuel moisture content leads to a lower efficiency, as energy is used to evaporate moisture [11]. Adequate coal drying can minimise the negative effects of coal moisture.
Apart from the above environmental factors there are various operating and design factors that affect overall plant efficiency. These are listed below, along with their relevant methods that may increase overall plant efficiency:
15
Coal quality: Coal with a higher calorific value is associated with higher plant efficiency, as it requires less processing and handling per MWh produced [11]. The quality of coal should be carefully monitored via accurate coal analysers, which measure moisture, calorific content, sulphur content, NOX and carbon content.
Coal processing: Pulverisers and conveyers draw auxiliary electrical energy to operate. Effective pulverisation can greatly increase plant efficiency.
Boiler: Boilers should be inspected often, as leaks causing pressure losses result in greatly decreased efficiency. Furthermore, boilers should be very well insulated to minimise radiated heat. Air heaters in boilers can also greatly increase boiler efficiency, however these should be cleaned often and checked for acid erosion.
Plant capacity: Plants with higher MW capacity ratings tend to be more efficient than smaller plants, as there are less losses in large scale equipment [11].
Soot blowing: Soot is removed from the furnace to increase heat transfer. Although this is traditionally performed on a periodic basis, a conditional basis is preferred in current international best practice. Soot blowers should not be used unnecessarily, as they consume large amounts of auxiliary electrical energy.
Air heaters: Air is pre-heated before being forced into furnace. Effective heating allows fuel to burn more effectively [13].
Plant generation configuration: Rankine cycle, Brayton cycle, combined cycle etc. have varying efficiencies depending on plant context. Fuel heating in combined cycle systems greatly increases efficiency [13].
Plant cooling configuration: Closed-circuit, evaporative, once through, dry and coastal cooling water systems have varying efficiencies. Heat recuperation from cooling systems also increases plant efficiency [4, 21]. In wet cooling systems filtration and/or reverse osmosis can be used to decrease the mineral content of cooling water, which in turn increases its heat carrying quality.
Use of reduced NOx cycles in coal plants consumes additional air and increases the amount of
unburnt fuel [24].
Air filtration and silencing cause pressure losses in the system, resulting a lower efficiency [23]. Electro-static precipitators remove particulate from released gases, but also consume auxiliary energy.
Capacity factor/load factor: Refers to the instantaneous ratio of the plant's rated maximum generating capacity to the generating capacity at which the plant is operating. A plant tends to become more efficient at higher capacity factor values [4].
16
2.2.6
Condition monitoring in power plants
The accurate measurement of plant data, such as fuel consumption, fuel calorific value, sent-out electrical energy, temperature and pressure of various subsystems, emissions and auxiliary electrical energy consumption, requires complex monitoring equipment [25]. However, this data is required to track plant heat rate, maximise efficiency and reduce required maintenance [26]. Advanced condition monitoring systems are usually absent in older plants and are very expensive and difficult to retrofit [25].
2.3
Measurement and verification
2.3.1
Overview of measurement and verification
Energy Efficiency and Demand Side Management (EEDSM) are increasingly relevant activities, aimed at decreasing the demand on electric utilities for environmental and financial reasons. EEDSM projects depend heavily on accurate measurement and evaluation of interventions [6]. Typical project stakeholders include:
Power utility
Project client
Energy service company (ESCo)
Measurement and Verification (M&V) is the name given to the process whereby project performance is evaluated and communicated to these stakeholders in a manner that is both objective and independent. The M&V process reduces the level of risk to stakeholders and encourages additional investments in EEDSM projects [5] [6].
2.3.2
Typical energy efficiency and demand side management project stages
In this section the typical stages found in an EEDSM intervention project are covered. The ESCo should adhere to the 8 steps shown in Figure 2-3 [6].
1. Project identification
2. Energy
audit/assumptions 3.Recommendations 4. Funding
5. Detail design 6. Implementation 7. Commisioning 8. Operation and
17
Figure 2-3: Typical energy efficiency and demand side management project stages [6].
The project stages shown in Figure 2-3 are expanded on in Table 2-2 [6].
Table 2-2: EEDSM project stage details [6].
1. Project identification Client or ESCo identifies potential for EEDSM project.
Client contracts ESCo to establish potential savings and financial impact.
Client provides letter of intent to ESCo.
2. Energy audit/assumptions Energy audit is performed. This usually consists of both a brief observational visit and a more detailed examination.
Potential savings of impact are estimated by establishing the number, type and rating of all relevant energy consuming devices.
Any non-measurable factors that may impact measurements are taken into account as assumptions. 3. Recommendations After all relevant information is gathered, the ESCo
provides the client with recommendations as to which EEDSM efforts should be pursued.
After the client has accepted these the utility is provided with a proposal for project funding.
4. Funding Once the utility has determined that the proposed EEDSM project will provide adequate results within an acceptable time frame and at reasonable risk, funding is granted. 5. Detail design Following project approval the ESCo produces a deliverable
documenting the complete design process of the project, as well as expected results.
6. Implementation Physical implementation of all steps listed in ESCo's design document. Demand typically fluctuates in this stage, as is shown in Figure 2-4.
M&V performance assessment begins during this stage (see section 2.3.4).
7. Commissioning ESCo commissions installed equipment after implementation to confirm correct installation.
8. Operations and maintenance
System maintenance is performed either by ESCo or client. The ESCo is held liable for decreases in system performance during an agreed initial period. Liability for failure falls on the client after this period.
2.3.3
Measurement and verification methodology
M&V, in its most simple definition, measures the energy savings of an EEDSM intervention. This is done by measuring energy usage and demand before and after the completion of the intervention [5]. This is shown in Equation ( 2.6 ) [6].
18
In Equation ( 2.6 ) Epre-implementation represents the baseline energy use i.e. before the completion of the
EEDSM intervention while Epost- implementation is the energy use after the intervention. Adjustments
accounts for any external factors that may have had an effect on operating conditions, such as weather or building occupancy [5]. Equation ( 2.6 ) is illustrated visually in Figure 2-4 [5].
Figure 2-4: Visual representation of Equation ( 2.6 ) [5].
There are four options that M&V teams may make use of in EEDSM interventions. These are listed below and summarised in Figure 2-5 [5] [6].
Option A: Retrofit isolation with primary measurements: Partial measurement of retrofitted equipment, important parameters are measured while others are estimated.
Option B: Total retrofit isolation: Like Option A but with all relevant parameters measured.
Option C: Whole building: Saving calculated from measurements taken from the entire facility where EEDSM intervention is performed.
Option D: Calibrated simulation: computer simulation is used to estimate overall savings. The simulation is “calibrated” with facility billing data.
19
Figure 2-5: Visual summary of M&V options [5] [6].
The following points are taken into account when selecting an M&V option [5]:
Intervention costs and projected savings: the extent of M&V activities and potential savings should be proportional to the total project cost.
Complexity of intervention project: a higher complexity system requires a more intricate M&V approach.
Number of associated projects in facility: in the case of multiple EEDSM projects in a single facility, the measurements may be related. Thus, measurement equipment may be shared or re-used.
Risk or uncertainty associated with the project: uncertainty in a project brings with it a requirement for more inclusive and accurate M&V procedures to provide adequate communication to shareholders.
Responsibility allocation between stakeholders: certain stakeholders may insist on a more thorough evaluation if they are held liable for project shortcomings.
Additional uses for measurement equipment or measured data.
2.3.4
Typical measurement and verification project stages
An M&V intervention plan needs to be clearly communicated by the M&V team to the other stakeholders to avoid ambiguity. These parties review and, if satisfied, accept the plan. Figure 2-6 shows the typical steps in an M&V process [6]. It should be noted though that there may be various iterations of each step, depending on stakeholder input or approval.