The Effect of Capital Adequacy Ratio (CAR), Non Performing
Loan (NPL), Operational Efficiency (BOPO), Net Interest Margin
(NIM), and Loan to Deposit Ratio (LDR), on Return on Assets
(ROA)
Yuhasril Yuhasril
Mercu Buana University, Economy and Business Faculty, Jakarta-Indonesia Abstract:
This study aimed to examine the effect of Capital Adequacy Ratio (CAR), Non- Performing Loan (NPL), Operating Efficiency (BOPO), Net Interest Margin (NIM), and Loan to Deposit Ratio (LDR) on Return on Assets (ROA).The population used in this study was Private Foreign Exchange National Bank in Indonesia that listed on Indonesia Stock Exchange (IDX) in 2013-2016. By using Purposive Sampling method, it could be obtained 44 samples of 15 banking companies which observed in 2013-2016. The analysis technique employed was Panel Data Regression. Research findings indicated that Capital Adequacy Ratio (CAR), Non-Performing Loan (NPL), Operational Efficiency (BOPO), Net Interest Margin (NIM), and Loan to Deposit Ratio (LDR) simultaneously had effect on Return on Assets (ROA). Then, partial test of each variables were CAR and LDR had not significant effect on ROA, while NPL, BOPO, and NIM have significant effect on ROA.
Keywords: ROA, CAR, NPL, BOPO, NIM, and LDR DOI: 10.7176/RJFA/10-10-19
Publication date:May 31st 2019
1. INTRODUCTION
Background of the Research
The economy restriction growth, banking industries have resistance, supported by sustainable credit risk, and strong capital adequacy ratio. In October 2016, Capital Adequacy Ratio (CAR) was still high, 22,9 %, it was far above minimum standard, 8%. This condition represented the quite high banking endurance to tackle pressure and fluctuation in economy. Meanwhile, Non-Performing Loan (NPL) ratio was still low and about 3,2 % (gross) or 1,5% (net).
In 2016, the performance of banking industry has slow growth as domestic economic growth. Banking industry has preserved profitability in positive growth. Credit growth in 2016 was decelerated to be 7,46% or lower than compared to 10,27% in December 2015. The consequence of the decelerated, Return on Assets (ROA) has decreased, however it was still in quite high level.
Bank is an institution has role to amass capital from people and return it to them efficiently and effectively. Therefore, bank is connector for parties which interrelate between capital providers (depositor) party and people who need the capital (borrower). By its function as connector or intermediate tool, it is important for bank to preserve people’s trust since people expect the capital saved in secure (Merkusiwati, 2007).
Bank companies have operated in Indonesia covering some kinds and banks analysed of the research were in private foreign exchange national category. Foreign exchange is bank has been appointed by Bank of Indonesia to run business in foreign exchange banking. They offer services in term of foreign currency as transfer to overseas, foreign currency trading, export-import transaction, and the other foreign currency (Lestari, 2007). Foreign exchange may be categorized either physically or non-physically. Physically, foreign exchange denotes non-metal foreign currency used to pay legally, while non-physically defines balance in foreign currency and it is on Bank of Indonesia. The following Table 1.1 is actual data of business gap taken from OJK website.
ratios. Referring to the table, it contains information concerning to business gap phenomena that can be enumerated below:
It can be perused that profitability averagely (ROA) in 2013 – 2016 attained standard of bank in Indonesia, was above 1,5%. During 2013-2016, profitability progress had decreased of each year, 2,43% in 2013, 2,13% in 2014, 1,75% in 2015, and in 2016 was 1,65%. From the table, it confirmed that ROA of those banks had decreased although the percentage was small.
On the Table 1.1, it exemplified that CAR as capital indicator had increment from 2013 to 2016. Bank of Indonesia’s (BI) regulation was above 8%, it meant that the CAR increment signified bank capital was better. If it discerned from data consistency between CAR financial ratio and ROA in 2013-2016 that average value was increased and followed by ROA decreasing in the same period. It does not conform to Kuncoro and Suhardjono‘s (2011) theory who declared that the higher CAR, then bank profit is getting high as well. In the other words, the lower of a bank risk, then bank profit is getting high to earn. Subsequently, it is needed to scrutinize the gap.
NPL is distributed credit. However, it does not run well, hesitated, and jammed. Based on the obtained data from Bank of Indonesia, it can be known that NPL ratio growth of Private Foreign Exchange National Bank in Indonesia of 2013-2016 continuously had increased. NPL has targeted to know management performance in using assets efficiently. On the Table 1.1, national banking condition averagely was under 5%, however, in 2014-2016 NPL was increased until 4,75 – 5,83. Individually, some of banks had difficulties in holding their NPL to be 5%. Consequently, it needed to do further research in elucidating the difference.
On the Table 1.1, it appointed that BOPO achievement from 2013 through 2016 was unstable and it can be stated that it fluctuated. BOPO ratio exemplified level of banking efficiency in running its operational that was increased from 2013 to 2015. The number of increment was 78,07% - 84,58%. Meanwhile, in 2016 it had increment was to be 84,98%. It was occurred followed by Return on Assets (ROA) decreased. This is in line with existed theories where the increment of BOPO, the ROA should decrease. If BOPO is getting higher, then it can be inferred that performance of a company financial is getting lower or worst (Riyadi, 2006).
Financial ratio of Net Interest Margin (NIM) was by average 3, 78% in 2013 and 2016 was 5,27%. It signified that average value of NIM in 2013 – 2016 had increased. The higher of this ratio value, then the interest income is getting higher will be obtained from productive asset that managed by bank (Riyadi, 2006). In other words, return on assets (ROA) is getting higher as well. However, on the Table 1.1, in 2013, ROA had increment was 2,43% and 2016 was 1,65%. It portrayed that ROA had decreased.
Variable employed in liquidity aspect assessment was LDR. Table 1.1 exposed LDR of Private Foreign Exchange National Bank in Indonesia of 2013-2016 continuously fluctuated. The LDR achievement was increasingly high in 2013-2015 and decreased in 2016, and then the assessment was not in line with the existing theories where relationship between LDR and ROA were equal. Every increment of LDR would be followed by Return on Assets’ (ROA) increment as well.
2. Literature Review and Hypothesis
2.1 Return On Assets (ROA)
Return On Assets (ROA) is the ratio between profit before tax and total average assets in a period. This ratio can be used as a measure of financial health. This ratio is very important, because the profits derived from the use of assets can reflect the level of business efficiency of the bank. To assess the health of the bank, BI will provide a maximum score of 100 (healthy) if the bank has an ROA> 1.5% (Hasibuan, 2009).
=
2.2 Capital Adequacy Ratio (CAR)
Capital Adequacy Ratio (CAR) is the ratio of a bank’s capital in relation to its risk weighted assets and current liabilities. It is decided by central banks and bank regulators to prevent commercial banks from taking excess leverage and becoming insolvent in the process. in line with the standards set by the Bank for International Settlements (BIS), the Indonesian bank requires each bank to provide at least 8% of the risk-weighted assets. But since the end of 1997 the CAR must be achieved at least 9%. Each bank is required to maintain a capital adequacy ratio.
=晡
!
2.3 Non Performing Loan (NPL)
Non Performing Loan is a non-performing loan ratio, NPL is not more than 5% of total credit and the settlement is complex. Nonperforming loan is a group of debtors who can not afford and or intentionally not pay off their obligations to the bank. The higher the risk of bad loans faced by banks, the higher the NPL. Banks with high NPLs will increase the cost of poduktif assets, thus potentially resulting in losses for banks (Dendawijaya, 2009). High NPLs will result in lower profits earned by the company.
"#$ = %&
! ' 100% 2.4 Operational Eficiency (BOPO)
Operational Eficiency (BOPO), is the ratio between operating expenses and operating income. Operating expenses are calculated based on the sum of the total interest expense and other total operating expenses. Operating income is the sum of total interest income and total other operating income. This ratio is used to measure the level of bank efficiency in conducting its operations. According to Dendawijaya (2009) based on Bank regulation, the normal BOPO is 94% -96%.
+ # =, -.
, ' 100%
2.5 Net interest margin (NIM)
Net interest margin (NIM) is a measure of the difference between the interest income generated by banks or other financial institutions and the amount of interest paid out to their lenders (for example, deposits), relative to the amount of their (interest-earning) assets. It is similar to the gross margin (or gross profit margin) of non-financial companies.
"/0 = 1
- ' 100%
2.6 Loan to Deposit Ratio (LDR)
Loan-to-Deposit Ratio (LDR) is used to assess a bank's liquidity by comparing a bank's total loans to its total deposits for the same period. This number is expressed as a percentage. If the ratio is too high, it means that the bank may not have enough liquidity to cover any unforeseen fund requirements. Conversely, if the ratio is too low, the bank may not be earning as much as it could be.
$2 = !
! % 3 45 ! ' 100%
Based on the definitions above, it proposed that:
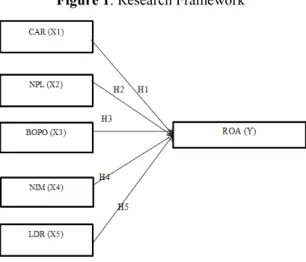
Hypotesis 1.1 : Capital Adequacy Ratio (CAR) has effect on Return on Assets (ROA) at Private Foreign Exchange National Bank in Indonesia in 2013-2016.
The CAR that Bank Indonesia has set is 8%, so banks with a CAR below 8% indicates that the bank is not able to absorb losses arising from the business of the bank, but if the CAR owned by the bank is more than 8% then the bank is declared as a solvable bank, because the greater the CAR owned by the bank, the smaller the risk will be for the bank and the bank's profits will be greater (Kasmir, 2010). The research conducted by Rachdi (2013), Tommy, Saerang, and Mitasari (2014), Putri and Suhermin (2015) showed that CAR has effect on ROA. Based on the discussion above, it is proposed:
Hypotesis 1.2 : Non Performing Loan (NPL) has effect on Return on Assets (ROA) at Private Foreign Exchange National Bank in Indonesia in 2013-2016.
Bank Indonesia regulations stipulate that bank NPLs are not more than 5%, so the Allowance for Earning Assets Losses (PPAP) must be provided by the bank to cover losses arising from earning assets. In lending, the bank must perform an analysis of the ability of the debtor to repay by reviewing and binding of the collateral (Dendawijaya, 2009). If the bank’s NPL is high then it indicates a lot of credit problems experienced by the bank concerned, so the possibility of banks experiencing increasingly big problems in lending. So in this case the higher the NPL, the lower the ROA generated by the bank.
Research conducted by Tommy and Saerang (2014), Prasetyo, Darmayanti, Putri and Suhermin (2015) showed that NPL has effect on ROA. Based on the discussion above, it is proposed:
Hypotesis 1.3 : Operational Eficiency (BOPO) has effect on Return on Assets (ROA) at Private Foreign Exchange National Bank in Indonesia in 2013-2016.
If the BOPO owned by a bank is higher, then the lower the ability of banks to reduce operating expenses which causes the banks to run not so efficiently. Banks that are not effective in carrying out their operational activities will increase the allocation of costs so that the bank's profitability. and the smaller the BOPO owned by a bank then the bank can run the operational activities effectively so that the smaller the risk of banks in the face of problems.
Research conducted by Indarwati, Anan, Tommy, Saerang, and Mitasari (2014), Chaidir, Prasetyo and Darmayanti (2015) showed that BOPO has effect on ROA. Based on the discussion above, it is proposed: Hypotesis 1.4 : Net Intrest Margin (NIM) has effect on Return on Assets (ROA) at Private Foreign Exchange National Bank in Indonesia in 2013-2016.
Net Interest Margin (NIM) is important to evaluate the bank's ability to manage interest rate risk. When interest rates change, interest income and interest rates will change. For example when interest rates rise, both interest income and interest costs will increase as some bank assets and liabilities will be priced at a higher rate. Research conducted by Zain (2013) showed that NIM has effects on ROA. Based on the discussion above, it is
proposed:
Hypotesis 1.5 : Loan to Deposit Ratio (LDR) has effect on Return on Assets (ROA) at Private Foreign Exchange National Bank in Indonesia in 2013-2016.
The amount of LDR indicates the ability of the bank to manage liquidity so that the bank is in good condition (Lesmana, 2008). The regulation stipulated by Bank Indonesia states that the minimum LDR is 78% and the maximum is 92%, if the bank complies with the established standard, the bank's profit will increase. The higher the LDR is, indicates the higher the funds disbursed and the lower the LDR is, indicates the lower the funds disbursed. Distribution of large funds will get the bank revenue so that ROA increases. Research conducted by Mitasari (2014). showed that LDR has effect on ROA.
Figure 1. Research Framework
3. RESEARCH METHODOLOGY
3.1 Population and Sample
According to Sugiyono (2012), population is generalization area which consisted of object/subject has particular quality and characteristic prescribed by researcher to analyse and deduce. Population of the research was entire bank in Indonesia, while sample was Indonesian banking that listed at Indonesia Stock Exchange per January 2016 by purposive sampling technique. Sample is part of number and characteristic owned by the population (Sugiyono, 2012). The samples of the research used were Indonesian banking that listed at Indonesia Stock exchange per January 2016 by purposive sampling technique and sample determination criteria of Indonesia banking below:
1. Listed at Indonesia Stock Exchange in 2013-2016 and number of the banks were 44. 2. Banks completely had not issued Financial Statement in 2013-2016.
3.2 Data Collection Technique A. Bibliography Study
Bibliography study employed by collecting relevant data and theories conform to problems to be analysed and doing bibliography study on literatures and other references, like article, journal, books and other relevant researches.
B. Documentary Study
This research used secondary data as data source and obtained in Indonesia Stock Exchange library. Those data in history in term of the research were companies financial statement have been sample of the research.
4. Analysis
Analysis method applied of the research was panel data regression by software Eviews 9 assistance to quantify effect between independent variables and dependent variable, and test hypotheses have been proposed then it employed statistical test as follows:
1) Stationary Test
Stationary test works to discern whether data is stationary or not. The Data is stationary if it is flat and does not contain trend component by diversity in constant and has periodic fluctuation.
2) Panel Data Regression Analysis
According to Nachrowi and Usman (2006), panel data is combination of time series and individual (cross section) data. Time series data is collected data from time to time of an individual. Meanwhile, cross section is collected data in particular time of many individuals.
The model used was panel data regression technique by three alternative approaches, namely: Common Effect (pooled least square), Fixed Effect (FE), and Random Effect (RF) method.
a. Common Effect (pooled least square)
Common Effect method addresses to combine data only without discerning time and individual difference. This approach does not consider either individual or time dimension. It assumed that data behaviour between companies and any time ranges.
b. Fixed Effect (FE)
Widarjono (2007) asserted that fixed effect is method to estimate panel data by dummy variable in elaborating any intercept difference. This method assumes that regression coefficient (slope) is static between individual and time series. However, the intercept is difference of each company and equal to time series (time invariant).
c. Random Effect (RE)
Widarjono (2007) enumerated that Random Effect is method to estimate panel data which distraction variable may interrelate between time series and cross section. Technique used in this method is Random Effect by adding distraction variable (error terms) may rise up in relationship between time series and companies data.
4.1 Model Selection
To select the most appropriate model employed in panel data processing, it conducted some tests as follows: a. Chow Test
Chow test aims to specify whether regression panel data model by Common Effect or Fixed Effect method is fit or not. If the conducted test has been prescribed that Common Effect is fit one and used, then it does not need to further test or retest by Hausman Test. The conducted test by Chow-test or Likelihood ratio test manifested by some assumptions as follows:
H0: The model follows Pool HA: The model follows Fixed b. Hausman Test
Hausman test is statistic test to select whether Fixed Effect or Random Effect is the most appropriate model to be used if the result of Chow test determined and then Fixed Effect method practised to estimate panel data regression. The conducted test by Hausman test manifested by assumptions as follows:
H0: The model follows Random Effect HA: The model follows Fixed Effect
1) Determination Coefficient Analysis
The variance of determination coefficient proportion from the obtained variable denotes the most appropriate model, yet it is rare happened. R2 value can be counted by formulation below:
R2 = 66 66
2) T Statistic Test (Partial Test)
Ghozali (2011) expounded that t statistic test basically designates how far of an explanatory variable or independent variable individually has effect on dependent variable and elaborates its variance. Zero (0) hypothesis is going to be tested is any parameter (bi) that is equal zero (0).
3) F Statistic Test
According to Ghozali (2011), F statistic test portrays whether entire independent variables in a model simultaneously have effect on dependent variable. Zero (0) hypothesis is going to be tested any parameter (bi) in a model is equal zero (0).
5. Result
5.1 Overview of the Company
Samples were being object of the research comprised of banking companies that listed in The Financial Services Authority (OJK) form 2013 to 2016. Those companies were Private Foreign Exchange National Banks and component of the samples satisfied data completeness criteria namely banks had consistency in issuing profitability value (ROA) and financial statement during 2013-2016.
Based on the criteria have been prescribed, it can be obtained 15 Private Foreign Exchange National Banks have already met samples criteria of the research.
5.2 Descriptive Analysis
Descriptive analysis is statistic tool serves to describe and highlight object of research to be elucidated through sample or population of data factually without analysing and concluding the data in publicly used (Sugiyono, 2009). Moreover, it conducted to describe data have been discerned in number of samples (N), mean, median, deviation standard, minimum and maximum value. This test, works to simplify the used variables in understanding the research.
Based on descriptive statistic test on the Table, it can be recognized that:
1. N=60 means number of data processed in the research were 60 samples consisted of 15 companies to be enacted sample for 4 years and they were Return on Assets (ROA), Capital Adequacy Ratio (CAR), Non-Performing Loan (NPL), Operational Efficiency (BOPO), Net Interest Margin (NIM), and Loan to Deposit Ratio (LDR) variables.
2. Return on Assets (ROA) had highest value was 0.0396 at Bank Central Asia Tbk in 2016. On the other hand, the lowest value of Return on Assets (ROA) was 0.0011 and achieved by HSBC Tbk in 2015 that had standard of deviation value was 0.008910. It was lower than mean was 0.017143, consequently it indicated that its assets were in good category.
3. Capital Adequacy Ratio (CAR) had highest value was 0.2636 at Index Selindo in 2015. On the other hand, the lowest value of Capital Adequacy Ratio (CAR) was 0.1044 and posited by Mayapada Internasional Tbk in 2014 that standard of deviation value was 0.036558. It was lower than mean was 0.176212, subsequently it appointed that its data were good.
4. Non-Performing Loan (NPL) had highest value was 0.0606 at HSBC Tbk in 2016. On the other hand, the lowest value of Non-Performing Loan (NPL) was 0.0006 and attained by Index Selindo in 2014 that had standard of deviation value was 0.011739. It was lower than mean was 0.023520, as the result it signified that the results were pretty good.
5. Operational Efficiency (BOPO) had highest value was 0.9899 at HSBC Tbk in 2015. On the other hand, the lowest value of Operational Efficiency (BOPO) was 0.5604 and obtained by Bank Himpunan Saudara 1906 Tbk in 2013 that had standard of deviation value was 0.093521. It was lower than mean was 0.841315, as consequence it exemplified that the results were quite good.
6. Net Interest Margin (NIM) had highest value was 0.0960 at Danamon Indonesia Tbk in 2013. On the other hand, the lowest value of Net Interest Margin (NIM) was 0.0189 and achieved by Bank Himpunan Saudara 1906 Tbk in 2014 that had standard of deviation value was 0.014735. It was lower than mean was 0.050833, it represented that the data had better distribution.
7. Loan to Deposit Ratio (LDR) had highest value was 1.3788 at ICBC Indonesia in 2015. On the other hand, the lowest value of Loan to Deposit Ratio (LDR) was 0.5535 and placed by Bank Mega Tbk in 2016. It indicated that the data had better distribution.
5.3 Data Feasibility Analysis
To recognize feasibility data employed in the research, then it committed stationary test by unit root test.
The result on the table was obtained Pro. ROA 0.0166 value < 0.05, CAR 0.0002 < 0.05, NPL 0.0016 < 0.05, BOPO 0.0113 < 0.05, NIM 0.0137 < 0.05, and LDR 0.0017 < 0.05, it meant that the data were not exposed by unit root.
5.4 Panel Data Regression Analysis 1) Common Effect
assumeed that among companies data were equal of any time range.
Referring to the result of Common Effect method, it can be discerned that NIM and BOPO variables had effect on Return on Assets and it had probability value was 0.0000 < 0.05. Meanwhile, CAR, NPL, and LDR had not effect on Return on Assets. It can be known by probability results of each variable. CAR had probability value 0.2210 > 0.05, NPL 0.0571 > 0.05, and LDR 0.3206 > 0.05. In addition, R-squared value was 0.908081 or 90.8% and probability of F-statistic was 106.6951. It meant that there was any effect of 90.8% on Return on Assets and the rests were other factors.
2) Fixed Effect
Fixed Effect is method used to estimated panel data by dummy variable to capture any difference of intercept. This method assumes that regression coefficient (slope) is static between time series and cross section. The following is the result of Fixed effect model.
Based on the result of Fixed Effect method, it can be recognized that NPL, NIM, and BOPO had effect on Return on Assets and the probability value of NPL was 0.0047 < 0.05, NIM was 0.0000 < 0.05, and BOPO was 0.0000 < 0.05. On the other hand, CAR and LDR had not effect on Return on Assets. It indicated that the result of each of variable probability, such as CAR was 0.7501 > 0.05, and LDR was 0.1163 > 0.05. Meanwhile, R-squared was 0.949996 or 94.99% and F-statistical probability value was 0.000000.
3) Random Effect
Random Effect is a method to estimate panel data where distraction variables may interconnect both time series and cross section. The following is the result of Random Effect model:
From the result of Random Effect method, it can be discerned that NPL, NIM, and BOPO had effect on Return on Assets. The probability value of each variable was NPL 0.0220 < 0.05, NIM 0.0000 < 0.05, and BOPO 0.0000 < 0.05. Moreover, CAR and LDR had not effect on Return on Assets. It exemplified from the result of each probability value was CAR 0.2826 > 0.05, and LDR 0.8961 > 0.05. R-squared value was 0.878709 or 87.87% and F-statistical was 0.000000.
5.5 Panel Data Regression Selection 1) Chow Test
This test committed to define whether fixed effect or Common Effect model was better. Hypothesis of H0: common effect model
H1: fixed effect model
- Chi Square < α = 0.05: H0 was rejected, fixed effect model was selected. - Chi Square > α = 0.05: H0 was accepted, common effect model was selected.
Based on the Chow test, it can be obtained the result of probability was 0.0009 < 0.05, it meant that H0 was rejected, Common Effect was improper model. Since the result of Chow test was H0, then it continued to Hausman test in redefining the best model whether Fixed Effect or Random Effect.
2) Hausman Test
Hausman test used to define whether Fixed Effect and Random Effect model was better than Common Effect method.
Hypothesis of H0: random effect model H1: fixed effect model
- Chi Square < α = 0.05: H0 was rejected, fixed effect was selected.
Referring to the Hausman test, it can obtained the result of probability value was 0.0275 < 0.05, it meant that H0 was rejected Fixed Effect was precise model.
5.6 Panel Data Regression Model Analysis
Concerning to the statistical test of panel data regression analysis, it can be attained result of Fixed Effect as employed model.
It can be known that C (Coefficient) value was 0.062671. It can be interpreted that entirely independent variables had positive effect on dependent variable. Moreover, Prob. Value was 0.0000. This value could be rendered that 5% and 1% were lower than 10%. Hence, it can be concluded that entirely independent variables had positive and significant (less than 1%) effect on dependent variable.
Additionally, it can be known that variables of NPL, NIM, and BOPO had effect on Return on Assets (ROA). It was confirmed by probability value of each variable, NPL was 0.0047 < 0.05, NIM was 0.0000 < 0.05, and BOPO was 0.0000 < 0.05. Then, probability value for F-statistic was 0.000000 and Adjusted R-squared coefficient was 0.926245. It portrayed that the effect was 92% on Return on Assets (ROA).
5.7 Hypothesis Test
1) Determination Coefficient R2
The conducted test exposed that Adjusted R-squared (R2) value was 0.926245. It can be recognized that 92% of profitability of ROA can be elaborated by independent variables, namely Capital Adequacy Ratio (CAR), Non-Performing Loan (NPL), Operational Efficiency (BOPO), Net Interest Margin (NIM), and Loan to Deposit Ratio (LDR). Meanwhile, the rest was 0.08% can be elaborated by factors outside of the research.
2) Model Test (F Test)
On the Table of Fixed Effect, it can be discerned that F test value was 39.99702 by probability 0.000000 and the value was lower than degree of significant was 5%. It appointed that H0 was rejected. Additionally, the minimum was one independent variable of the research had significant effect on dependent variable, Return on Assets (ROA).
3) Model Test (T Test)
The result of regression test was conducted by t test on degree of trust 95% or α = 5%. T test employed to know whether regression model of Capital Adequacy Ratio (CAR), Non-Performing Loan (NPL), Operational Efficiency
(BOPO), Net Interest Margin (NIM), and Loan to Deposit Ratio (LDR) on Return on Assets (ROA) partially had significant effect on Return on Assets (ROA) through defining “tcount” and “ttable”. This test enacted as reference of the research and acknowledging how far of each independent variables had effect on dependent variable. • CAR : 0.7501 > 0.05 = Had not effect.
• NPL : 0.0047 < 0.05 = Had Effect • BOPO : 0.0000 < 0.05 = Had Effect • NIM : 0.0000 < 0.05 = Had Effect • LDR : 0.1163 > 0.05 = Had not effect 6. Discussion and Implications
Based on the findings, discussion and conclusion have been proposed of the research, it can be delivered suggestions below:
1) CAR ratio had not significant effect on bank profitability. In this case, Foreign Exchange bank was quite success to balance CAR ratio, and elevate ROA. It should preserve the ratio to fund operational activity and share big contribution for profitability.
2) Non-Performing Loan (NPL) had negative and significant effect on bank profitability. Consequently policy making should balance number of Non-Performing Loan (NPL) in order not to overwhelm or maximum 5% as standard of Bank of Indonesia regulation. Therefore, to lower NPL value from year to year, then bank has to define or have carefully principles applied to problem loans.
3) Decision makers should pay attention to BOPO since it has crucial effect on bank profitability. This is by reason if BOPO is getting high then operational cost is getting high as well. Subsequently, ROA of a bank is decreased eventually. Hence, bank management should lowering BOPO in more effective spending operational cost or supervising expenditure of every year.
4) In the research, Net Interest Margin (NIM) had most dominant effect on bank profitability. For bank managements, they should rise up interest income or productive assets by sharing credit to people who need capital, giving deposit to other bank and place other banks’ capital in this country and overseas.
5) LDR ratio had not effect on bank profitability. In this matter, Foreign Exchange bank has already succeeded in preserving ratio and active enough to share credit in ideal position. Additionally, it concerns to quality credit and is distributed to anticipate loan problem. As the result, it earns profit from the credit.
7. Limitations and future research
For the next researcher (s), it expected to scrutinize other variables except this one to get variation may be highlight kinds of something predisposing ROA. It may extend observation time and content of the research in term of financial effect on ability of bank management to earn profit entirely by using other ratio exclude ratio have been stated in this research.
References:
Abdullah, M N and Nusrat J. (October, 2014). The Impact of Liquidity on Profitability in Banking Sector of Bangladesh: A Case of Chittagong Stock Exchange Bangladesh. EPRA International Journal of Economic and Business Review, 2 (10)..
Bank Indonesia. (1998). Undang-Undang Nomor 10 Tahun 1998 tentang Perubahan Undang-Undang No. 7 Tahun 1992 tentang Perbankan. Jakarta: Gramedia.
Budisantoso, T., and Triandaru S. (2006). Bank dan Lembaga Keuangan Lain. Jakarta: Salemba Empat.
Chaidir, L. (2015). Pengaruh Kondisi Permodalan, Efisiensi Operasional, Likuiditas, Resiko Kredit Dan Resiko Pasar Terhadap Tingkat Profitabilitas Bank (Studi Kasus Sepuluh Bank Dengan Aset Tertinggi di Indonesia Periode 2009-2014). Fakultas Ekonomi dan Bisnis Universitas Brawijaya Malang.
Chandra., Chintya P., and Suhermin (April, 2015) “ Pengaruh NPL, LDR, CAR terhadap Profitabilitas Bank Umum Swasta Nasional Devisa. Jurnal Ilmu dan Riset manajemen, 4(4).
Christiano, M., Parengkuan T., Saerang. (2014). Analisis terhadap Rasio-Rasio Keuangan untuk Mengukur Profitabilitas pada Bank-Bank Swasta yang Go Public di Bursa Efek Indonesia. Jurnal EMBA, 2(4). Darsono. (2006). Manajemen Keuangan: Pendekatan Praktis Kajian Pengambilan Keputusan Bisnis Berbasis
Analisis Keuangan. Jakarta: Diadit Media.
Dendawijaya, L. (2009). Manajemen Perbankan Edisi Kedua. Jakarta: Ghalia Indonesia.
Endri. (2016). Mediasi Profitabilitas pada hubungan antara Good Corporate Covernance dan Firm Size Terhadap Corporate Social Responsibility, Jurnal Ilmiah Mnajemen,volume Vi, no 3, 2016.
Hanafi, M M., and Abdul H. (2000). Analisis Laporan Keuangan. Yogyakarta: UPP AMP YKPN. Hasibuan, M S P., (2001). Manajemen Sumber Daya Manusia. Jakarta: PT. Bumi Aksara.
Husnan, S., and Enny P. (2006). Dasar-Dasar Manajemen Keuangan (1st Ed.). Yogyakarta: UPP STIM YKPN. Indarwati, V., and Anan E. (2014). Effect of Financial Ratios toward Bank Performance in Indonesia (Case Study
on the Regional Development Banks in Indonesia Period 2008-2012). EBBANK, 5(2), 35- 54.
James, C., Van H., and Wachowicz. (2005). Prinsip-prinsip Manajemen Keuangan (12th Ed.). Jakarta: Salemba Empat.
Kasmir. (2008). Manajemen Perbankan (Revised Edition). Jakarta: PT Raja Grafindo Persada.
Kuncoro, M., and Suhardjono. (2011). Manajemen Perbankan, Teori dan Aplikasi (2nd Ed.). Yogyakarta: BPFE. Lestari, M I., and Toto S. (August, 2007). Kinerja Bank Devisa Dan Bank Non Devisa Dan Faktor-Faktor Yang
Mempengaruhinya. Proceeding PESAT (Psikologi, Ekonomi, Sastra, Arsitek & Sipil), 1 (2), 21-22. Martono and Agus H. (2010). Manajemen Keuangan (3rd Ed.). Yogyakarta: Ekonisia.
Merkusiwati, N K L A. (2007). Evaluasi Pengaruh Camel Terhadap Kinerja Perusahaan. BULETIN STUDI EKONOMI, 12(1).
Mitasari, D R. (2014). Analisis Pengaruh CAR, NPL, LDR, NIM dan BOPO terhadap Proofitabilitas Bank (Studi pada Bank Umum Go Public tahun 2009-2013). Jurnal Dinamika Manajemen, 1(3).
Prasetyo, D A., Darmayanti., and Ni P A. (2015). Pengaruh Resiko Kredit, Likuiditas, Kecukupan Modal, dan Efisiensi Operasional terhadap profitabilitas Pada PT. BPD Bali. E-Jurnal Manajemen Unud, 4(9), 2590-2617.
Rita, S., and Faliany. (November, 2012). Analisis Pengaruh Rasio CAR, NPL, BOPO, dan LDR terhadap Profitabilitas Perbankan (Studi Kasus Pada 10 Bank Besar Berdasarkan Peringkat Asset Perbankan yang Terdaftar di BEI. Universitas Katolik Indonesia Atma Jaya, 2(7).
Riyadi, S. (2006). Banking Assets dan Liability Management. Jakarta: Fakultas Ekonomi Universitas Indonesia. Sianturi, M R R. (2012). Pengaruh CAR, NPL, LDR, Dan BOPO Terhadap Profitabilitas Perbankan (Studi Kasus
Pada Bank Umum Yang Listed Di Bursa Efek Indonesia Tahun 2007 – 2011) (Thesis). Makasar: Universitas Hasanuddin Makasar.
Sugiyono, 2011,. Metode Penelitian Kuantitatif, Kualitatif dan R&D. Bandung :Alfabeta.
Taswan. (2010). Manajemen Perbankan Konsep, Teknik, dan Aplikasi. Yogyakarta: UPP STIM YKPN.
Yudiartini, D A S., and Dharmadiaksa. (2016). Pengaruh Rasio Keuangan Terhadap Kinerja Keuangan Sektor Perbankan di Bursa Efek Indonesia. Fakultas Ekonomi dan Bisnis Universitas Udayana, Bali, Indonesia. E-Jurnal Akuntansi Universitas Udayana, E-E-Jurnal Akuntansi Universitas Udayana, 2302-8556.
www.ojk.go.id. Statistik Perbankan Indonesia 2016. Retrieved on 20 March 2017. www.ojk.go.id, Laporan Triwulanan OJK IV-2016. Retrieved on 25 October 2017. www.bi.go.id. Peraturan Perbankan. Retrieved on 20 March 2017.