Comparisons of Heat Map and IFL Technique to
Evaluate the Performance of Commercially
Available Cloud Providers
Shyam S. Wagle
∗‡, Mateusz Guzek
†, Pascal Bouvry
†, Raymond Bisdorff
†University of Luxembourg
6, rue R. Coudenhove-Kalergi, Luxembourg City, Luxembourg
∗ Email: [email protected]† Email: [firstname.lastname]@uni.lu ‡ LAST-JD
Abstract—Cloud service providers (CSPs) offer different Ser-vice Level Agreements (SLAs) to the cloud users. Cloud SerSer-vice Brokers (CSBs) provide multiple sets of alternatives to the cloud users according to users requirements. Generally, a CSB considers the service commitments of CSPs rather than the actual quality of CSPs services. To overcome this issue, the broker should verify the service performances while recommending cloud services to the cloud users, using all available data. In this paper, we compare our two approaches to do so: a min-max-min decomposition based on Intuitionistic Fuzzy Logic (IFL) and a Performance Heat Map technique, to evaluate the performance of commercially available cloud providers. While the IFL technique provides simple, total order of the evaluated CSPs, Performance Heat Map provides transparent and explanatory, yet consistent evaluation of service performance of commercially available CSPs. The identified drawbacks of the IFL technique are: 1) It does not return the accurate performance evaluation over multiple decision alternatives due to highly influenced by critical feedback of the evaluators; 2) Overall ranking of the CSPs is not as expected according to the performance measurement. As a result, we recommend to use performance Heat Map for this problem.
Index Terms—Cloud Computing; Decision Recommendation; Cloud Brokering; Evaluation; Performance Heat Map; IFL
I. INTRODUCTION
It is a difficult task for normal cloud users to select appro-priate cloud services from different Cloud Service Providers (CSPs). Cloud Service Broker (CSB) facilitates the selection of the CSPs according to users’ requirements from multi-cloud environment. To ensure users that their services are reliable, CSPs define Service Level Agreement (SLA). The provisions of SLA offers may motivate cloud users during the product selection. SLA [1] is composed of different Quality of Service (QoS) rules, which are obligations that have to be followed by the CSPs. Generally, Cloud service users (CSUs) or CSBs consider the SLA offered by CSPs to select the cloud services [2]. In reality, CSPs may not deliver cloud services according to their SLA commitments [3]. In such situation cloud users may not receive exact services according to their expectations. Thus, it is necessary to develop a cloud brokering framework which considers both offered QoS and delivered
QoS to analyze the performance of cloud providers and recom-mend services to the users according to their expectations [4]. In this paper, we present the comparisons of our two ap-proaches: Intuitionistic Fuzzy Logic (IFL), formulated in [5], initially proposed by Wang [6] for web service selection, and Heat Map Performance Table to evaluate commercially available CSPs based on service performance delivered by them [3]. For the CSP evaluation, we collect the service delivery performance of CSPs using commercially available service monitoring tools. Not all of the properties expressed in the SLA provided by CSPs are directly measurable. While evaluating performance of CSPs, we include CSUs feedback to include non-measurable parameters. IFL evaluation technique can provide the total order of CSPs as a result of the CSP evaluation system. Heat Map Table is more explanatory and less influenced by inconsistencies in users’ opinions.
The paper is organized as follows: Section II gives the general overview of the related works. Framework used to measure and recommend the commercially available cloud providers with performance measurement from different CSPs under selected criteria and sub-criteria are mentioned in Sec-tion III and SecSec-tion IV respectively. SecSec-tion V gives the overview of IFL and Heat Map techniques to evaluate the per-formance of CSPs. Attribute-wise evaluation and ranking by both techniques are provided in Section VI. Result discussions with conclusions are presented in Section VII and VIII.
II. RELATEDWORKS
An IFL technique for the web service selection based on consumer’s vague perception which was introduced by P. Wang [6]. It was further applied for the selection of the best cloud provider according to service offer and service delivery from commercially available cloud providers [5]. S. Wang et al. [7] presented a collaborative web service selection approach to enhance the traditional trustworthy service selection ap-proaches using two metrics: 1) reputation provided by other service’s recommendation and 2) interaction frequency among its web services. It can be also implemented in cloud service selection by collaborative evaluation but this approach may not
be implemented for new cloud services or the services with no or very low reputation records.
A framework SMICloud [8] was proposed for comparing and ranking cloud services. It considers only quantifiable SLA attributes defined in CSMIC [9] and as such it does not consider the qualitative attributes. It implements an analytic hierarchy process (AHP) [10]. The main difficulty in provider ranking based on an AHP technique is assigning the hierar-chy of SLA attributes. Practically, each SLA attributes are important and dependent on each user’s preferences; it may be therefore difficult to assign their hierarchy.
Low-level performance metrics of Cloud services such as CPU utilization and network throughput etc. are considered in CloudCmp [11] to compare the performance of different Cloud services such as Amazon EC2, Windows Azure and Rackspace. Such low-level performance metrics could be further used to create models of high-level system properties, such as power consumption or performance [12], but it has not been included in CloudCmp. Qu et al. [13] have proposed a cloud service selection process based on consumer experience and involving the third party to avoid a biased assessment of cloud services from users, however, it does not cover the performance measurements from cloud providers. SLA offers provided by CSPs search in Service Ranking System proposed by [14] rather than service delivered by providers to rank the CSPs. Wagle et al. [3] propose the Performance Heat Map technique to evaluate the performance of commercially available CSPs.
To the best of our knowledge, in all the mentioned works, ei-ther SLA offers or low-level performance metrics by providers are considered to evaluate the performance of CSPs. Authors in [5] and [3] consider both offered SLA and delivered service performance to evaluate the CSPs based on Intuitionistic Fuzzy Logic (IFL) and Heat Map Table respectively. In this paper, we compare mentioned two evaluation techniques for the feasibility in current cloud brokering scenario.
III. SERVICEEVALUATIONFRAMEWORK
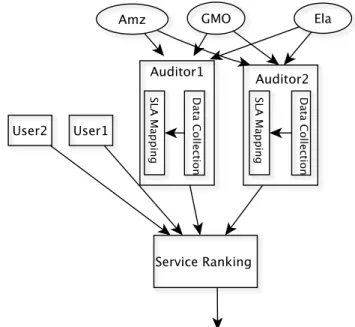
Figure 1 shows a framework for evaluating service perfor-mance delivered by CSPs including cloud users experience. For the evaluation propose, we choose three commercial cloud providers; Amz, Ela and GMO. Cloud auditors (Auditor1
and Auditor2) monitor the service performance from CSP
premises. Auditor1 and Auditor2 measure low-level perfor-mance metrics of CSP services of commercially available cloud providers. These values are mapped to SLA parameters so that measured performance can be compared with SLAs offered by cloud providers to validate these values against offers of CSPs. In this work, two cloud auditors for the service measurement and two cloud users for the customer feedback are chosen for the evaluation. Number of cloud providers, cloud users and auditors and criteria and sub-criteria can be modified in the proposed framework. Because of the space constraints and for the sake of simplicity, we chose only three cloud providers for comparison of the feasibility both techniques in the real scenario.
TABLE I: Criteria and sub-criteria for evaluating cloud ser-vices
Criteria Sub-criteria Short Name
Availability (C1) Uptime(c11) upT
Downtime(c12) dwT
Outage Frequency(c13) ouT
Reliability (C2) Load Balancing(c21) LB
MTBF(c22) MTBF
Recoverable(c23) Rcv
Performance (C3) Latency(c31) Lat
Response time(c32) rsT
Throughput (c33) tpT
Cost (C4) Storage Cost (c41) stC
VM instance cost(c42) snC
Security (C5) Authentication(c51) auT
Encryption(c52) enC
Audit-ability(c53) auD
To include both measurable attributes and non-measurable attributes, five main performance criteria are chosen: Avail-ability, Reliability, Performance as functional criteria, Cost andSecurityas non-functional criteria. They measure quality of cloud computing services with respect to the important requirements of the cloud users [5]. Under each main criterion, sub-criteria are defined (See Table I) for both evaluation techniques.
IV. PERFORMANCEMEASUREMENT
Two cloud auditors (CloudAuditor1,CloudAuditor2) are
used to evaluate the performance of the services of cloud providers. Table III and Table IV present the measurement of performance of three potential CSPs collected during seven
TABLE II: Internet Connection between Local Test Environment and Cloud Providers
Name of CSP Short Form Website Downlink (Mbps) (256 Kbps-10 Mbps) Latency (ms)
GMOCloud -US GMO www.us.gmocloud.com 1.31 506
Amazone S3 Amz aws.amazon.com/s3/ 36.3 40.5
Elastic Host Ela www.elastichosts.com 12.53 34
days of observations. Presented values are subject to the specifics of each cloud auditor (which are not controlled by the proposed system), observation period length and start. These values are further used as external input data for the evaluation control as an example, but we do not guarantee its accuracy. Internet connection between local test environments to cloud providers is presented in Table II. All service users are considered based on Luxembourg. Measured values are merged performance of all the regions provided by particular cloud providers. For the user feedback, performance rating
of U ser1, U ser2 are considered randomly. CloudAuditor1
uses CloudHarmony (www.cloudharmony.com) monitoring tool and CloudAuditor2 uses Monitis (www.monitis.com)
monitoring tool. ‘N A’ stands for missing data. Measurements of cloud service performance of each CSP depend on cloud auditors due to differences in their methodologies and monitor-ing environment. In some cases there are contradictory results. Cost parameters are directly referred from CSPs websites. Service measurement of the selected CSPs covers only the computing and storage service.
TABLE III: Service Measurement byCloudAuditor1
U pt im e (c 11) % D ow nt im e (c 12) (m in) O ut age (c 13) (fre que nc y) L oa dba la nc ing (c 21) M T BF (c 22) (m in) Re cove ra bl e (c 23) L ate nc y (c 31) (m s) Re spons e T im e (c 32)(m s) T hroughput (c 33) (M bps ) S tora ge Cos t (c 41) (G B/ m ont h) $ S na ps hot c os t (c 42) $ A ut he nt ic ati on (c 51) E nc rypt ion (c 52) A udi ta bi lit y (c 53)
GMOCloud -US 44.70 2.3 1 Yes 10 G 210 NA 4.24 0.17 NA Yes Yes Yes
Amazon S3 100.00 1 1 Yes H G 47.73 NA 40.81 0.04 NA Yes Yes Yes
Elastic Host 99.97 18.52 7 Yes 18hr VP 84.05 NA 10.07 0.1 0.03 Yes Yes Yes
Cloud Provider SLA Delivered Auditor 1 (Measurement) A va ila bi lit y (C1) Re lia bi lit y (C2) P erform anc e (C3) Cos t (C4) S ec uri ty (C5)
V. SERVICEQUALITYEVALUATIONTECHNIQUES
A. IFL Technique
Instuitionistic Fuzzy sets (IFS) introduced by Atanassov et al. [15] and [16] incorporate the degree of hesitation called hesitation margin (π), which enables to include the confidence of opinion in decision recommendation process. In this section, we describe the CSP evaluation technique based on IFS [5], which provides the group decision based on auditors’ service measurement and consumer’s perception, which was first proposed by Wang [6] for web service selection using consumers’ vague perception.
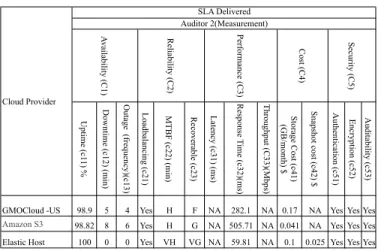
TABLE IV: Service Measurement byCloudAuditor2
U pt im e (c 11) % D ow nt im e (c 12) (m in) O ut age (fre que nc y)(c 13) L oa dba la nc ing (c 21) M T BF (c 22) (m in) Re cove ra bl e (c 23) L ate nc y (c 31) (m s) Re spons e T im e (c 32)(m s) T hroughput (C33)(M bps ) S tora ge Cos t (c 41) (G B/ m ont h) $ S na ps hot c os t (c 42) $ A ut he nt ic ati on (c 51) E nc rypt ion (c 52) A udi ta bi lit y (c 53)
GMOCloud -US 98.9 5 4 Yes H F NA 282.1 NA 0.17 NA Yes Yes Yes
Amazon S3 98.82 8 6 Yes H G NA 505.71 NA 0.041 NA Yes Yes Yes Elastic Host 100 0 0 Yes VH VG NA 59.81 NA 0.1 0.025 Yes Yes Yes Cloud Provider SLA Delivered Auditor 2(Measurement) A va ila bi lit y (C1) Re lia bi lit y (C2) P erform anc e (C3) Cos t (C4) S ec uri ty (C5)
The general steps followed in an IFL technique are: 1) Evaluators first select the evaluation criteria, 2) evaluators involved in evaluation provide the importance of each criteria in the form of linguistic terms (in IFN value), 3) Similarly, evaluators also give the performance evaluation in the form of linguistic terms. These two parameters (IFN values) are further manipulated according to criteria mentioned in this section to reach into the final performance evaluation and ranking.
1) Ranking Algorithm: Decision makers involved in ser-vice evaluation determine the importance of each criteria ac-cording to the linguistic terms defined in Table V and calculate aggregated importance of the criterion [6],w(cj), wherew(cj)
is calculated using intersection operator of Intuitionistic Fuzzy Number (IFN) number defined by Atanassov [16] with all the IFN values provided by decision makers. To provide the aggregate weight of the sub-criteria under the same crite-ria [5], aggregate weights of the subcritecrite-ria is calculated using
W(cj) =ci1∩ci2∩....∩cin. Performance Matrix (X)(See
Table XI) is created to evaluate each of the alternatives and gives the corresponding score for each alternative.
Finally, Max-Min-Max composition (T) defined by Biswas [17] and De et. al [18], Zk(CSPi) is calculated from Performance Matrix (X) and w(cj) using Zk(CSPi) =
T(xk
ij, w(cj)), where xij are the elements of Performance
Matrix (X) and k is the number of evaluators. Average of
Zk(CSP
i)is denoted asZ(CSPi), to aggregate the score of
the decision makers/evaluators. To evaluate the performance and rank order of alternatives, score functions Sw(Cj) and
SCSP(CSPi)are calculated usingSw(Cj)=µw(Cj)−πw(Cj)·
νw(Ci) andSCSP(CSPi) =µz(CSPi)−πz(CSPi)·νz(CSPi).
The values of SCSP(CSPi) can be interpreted as a total
order, or ranking, of CSPs, e.g. the highest value maps to the highest rank and lowest value maps to the lowest rank
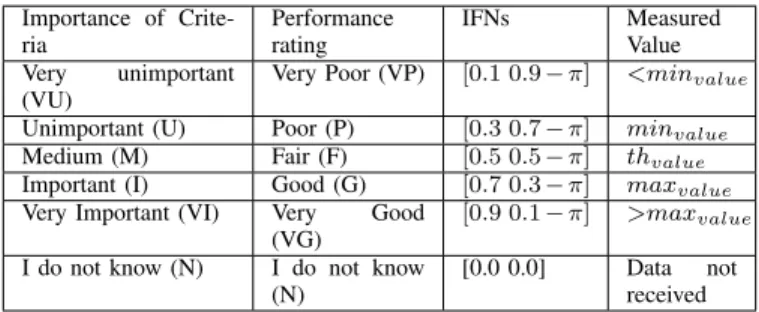
TABLE V: Linguistic terms for the Importance of a Criteria and Perfromance Rating
Importance of Crite-ria Performance rating IFNs Measured Value Very unimportant (VU)
Very Poor (VP) [0.1 0.9−π] <minvalue
Unimportant (U) Poor (P) [0.3 0.7−π] minvalue
Medium (M) Fair (F) [0.5 0.5−π] thvalue
Important (I) Good (G) [0.7 0.3−π] maxvalue
Very Important (VI) Very Good
(VG)
[0.9 0.1−π] >maxvalue
I do not know (N) I do not know
(N)
[0.0 0.0] Data not
received
for that particular SLA parameter. µandν represent a degree of membership and degree of non-membership to the element [15] respectively.
2) Auditors’ Measurement and Cloud User’s Feedback Mapping in IFN: CSPs define typically multiple breaking points, which define the level of quality of delivered service. Value of service credit, i.e. a discount, is offered by a CSP for each of the levels. The minimum value (minvalue), the
maximum value (maxvalue) and the threshold value (thvalue)
are set in order to compare SLA offer of CSPs. These values are used to determine the linguistic term for the measured value (See Table V). For example, if a measured value is greater than maxvalue, it is interpreted as Very Good (VG).
If measured value is less than minvalue it is interpreted as
very poor (VP). If cloud provider does not allow collecting the service status or some parameters are missing from cloud provider, it is interpreted as I do not know (N).
B. HeatMap Technique
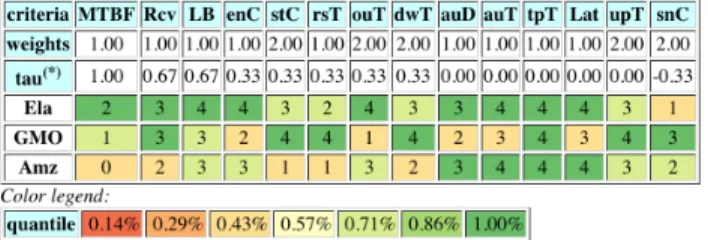
Heat Map table evaluation approach sorts the CSPs into marginal performance quantile classes to rank the providers with multiple performance criteria in an increasing or de-creasing order [19], [20], [3]. The general steps of the Heat Map Technique followed in this evaluation are: 1) sort the potential cloud providers into marginal quantile classes, 2) cloud providers are ranked, according to the defined multiple ordinal performance criteria. The performance criteria are sorted in decreasing order of correlation with the ranked position, 3) the order of providers is visualized in the form of performance heat map.
Performance quantile classes are mapped to colors on a scale fromdark red (worst) todark green(best) in the perfor-mance Heat Map visualization (See the color legend for7-tiles in Table XVII). Let x, y, ... are the observed performances of CSPs in X where X is the set of CSPs evaluated on a single real performance criteria. The performances such that
p% of the observed n inX are less or equal to q(p) where
q(p)is estimated by linear interpolation from the cumulative distribution of the performances in X.
Obviously, it is a multiple criteria ranking. In this tech-nique, CSPs are ranked in decreasing order from the overall best performing to the overall worst performing. It is also possible to rank providers in an increasing order from the
TABLE VI: Ordinal Level and Interpretation of auditor mea-surement in Ordinal Value
Linguistic terms Ordinal Value Measured Value
Very poor(VP) 0 <minvalue
Poor (P) 1 minvalue
Fair (F) 2 thvalue
Good(G) 3 maxvalue
Very Good(VG) 4 >maxvalue
No Value NA Data not received
worst to the best performing. Overall ranking is computed using bipolar outranking situations Bisdorff [21], which define that alternative x outranks an alternative y when there is a significant majority of criteria that warrant an ’better than’ relation between them and there is no considerable counter-performance observed between when considering xin place of y [3].
1) Auditors’ Measurement and Cloud User’s Feedback Mapping in Heat Map Table: As shown in table VI collections of measured values are mapped into an ordinal performance scale consisting of five levels: fromVery Poor(0) toVery Good (4). In this method, decision makers can provide the impor-tance of the criteria using different values of weights. In our evaluation, weights are assigned to each sub-criteria to make equally significant with weight assigned in IFL evaluation (See Table X) to make comparable with both techniques. Average weights are assigned for combined evaluations of all cloud auditors and users. We obtain the following sets of significance weights of the criteria and sub-criteria for cloud auditors and users:
1) For cloud auditors
wA=wc11+wc12+wc13= 6.0; wR=wc21+wc22+ wc23 = 6.0; wP =wc31+wc32+wc33 = 6.0;wC = wc41+wc42= 4.0; wS=wc51+wc52+wc53= 3.0 2) Foruser1 wA=wc11+wc12+wc13= 3.0; wR=wc21+wc22+ wc23 = 3.0; wP =wc31+wc32+wc33 = 3.0;wC = wc41+wc42= 4.0; wS=wc51+wc52+wc53= 3.0 3) Foruser2 wA=wc11+wc12+wc13= 6.0; wR=wc21+wc22+ wc23 = 3.0; wP =wc31+wc32+wc33 = 3.0;wC = wc41+wc42= 4.0; wS=wc51+wc52+wc53= 3.0
4) Average of cloud auditors and users for combined eval-uations
wA=wc11+wc12+wc13= 5.25; wR=wc21+wc22+
wc23 = 4.5; wP =wc31+wc32+wc33 = 4.5;wC =
wc41+wc42= 4.0; wS=wc51+wc52+wc53= 3.0
wherewcij represents the significance weight assigned to
sub-criterion j under criterion i. As monitoring environment of
CloudAuditor1andCloudAuditor2are different, their
map-ping reference tables are independent. Values of M axvalue, minvalueandthvaluefor each sub-criteria are defined for each
cloud auditor basing on their SLAs. Ordinal values obtained by the mapping values from Tables III and IV are presented in Tables VII and VIII, respectively.
TABLE VII: Service Mapping to ordinal value measurement by CloudAuditor1 U pt im e (c 11) % D ow nt im e (c 12) (m in) O ut age (c 13) (fre que nc y) L oa dba la nc ing (c 21) M T BF (c 22) (m in) Re cove ra bl e (c 23) L ate nc y (c 31) (m s) Re spons e T im e (c 32)(m s) T hroughput (c 33) (M bps ) S tora ge Cos t (c 41) (G B/ m ont h) $ S na ps hot c os t (c 42) $ A ut he nt ic ati on (c 51) E nc rypt ion (c 52) A udi ta bi lit y (c 53) GMOCloud -US 0.00 3 3 4 1 3 2 NA 1 3 NA 4 4 4 Amazon S3 4.00 3 3 4 3 3 4 NA 4 4 NA 4 4 4 Elastic Host 2.00 2 1 4 3 1 3 NA 2 3 4 4 4 4 Cloud Provider SLA Delivered Auditor 1 (Mapped) A va ila bi lit y (C1) Re lia bi lit y (C2) P erform anc e (C3) Cos t (C4) S ec uri ty (C5)
TABLE VIII: Service Mapping to ordinal value measurement
by CloudAuditor2 U pt im e (c 11) % D ow nt im e (c 12) (m in) O ut age (c 13) (fre que nc y) L oa dba la nc ing (c 21) M T BF (c 22) (m in) Re cove ra bl e (c 23) L ate nc y (c 31) (m s) Re spons e T im e (c 32)(m s) T hroughput (c 33) (M bps ) S tora ge Cos t (c 41) (G B/ m ont h) $ S na ps hot c os t (c 42) $ A ut he nt ic ati on (c 51) E nc rypt ion (c 52) A udi ta bi lit y (c 53) GMOCloud -US 1 3 3 4 3 2 NA 4 NA 3 NA 4 4 4 Amazon S3 2 2 2 4 3 3 NA 3 NA 4 NA 4 4 4 Elastic Host 4 4 4 4 4 4 NA 4 NA 3 4 4 4 4 Cloud Provider SLA Delivered Auditor 2(Mapped)) A va ila bi lit y (C1) Re lia bi lit y (C2) P erform anc e (C3) Cos t (C4) S ec uri ty (C5)
TABLE IX: Performance Evaluation by CloudAuditor1
TABLE X: The ratings of importance weight of each criteria by decision makers
Criteria Sub-criteria Auditor1 Auditor2 User1 User2 w(cj) W(cj) Uptime(c11) VI(0.0) VI(0.0) I(0.1) M(0.1) [0.5,0.4] Downtime(c11) VI(0.0) VI(0.0) I(0.1) M(0.1) [0.5,0.4] Outage(c13) VI(0.0) VI(0.0) I(0.1) M(0.0) [0.5,0.5] Loadbalancing(c21) VI(0.0) VI(0.0) I(0.0) I(0.2) [0.7,0.3] MTTB(c22) VI(0.0) VI(0.0) I(0.0) I(0.0) [0.7,0.3] Recoverable(c23) VI(0.0) VI(0.0) I(0.0) M(0.1) [0.5,0.4] Latency(c31) VI(0.0) VI(0.0) I(0.0) M(0.0) [0.5,0.5] Responsetime(c32) VI(0.0) VI(0.0) I(0.1) I(0.0) [0.7, 0.3] Throughput(c33) VI(0.0) VI(0.0) VI(0.0) VI(0.0) [0.9,0.1] Installation cost(c41)U(0.1) U(0.1) VI(0.0) VI(0.0) [0.3,0.6] Running cost(c42) U(0.1) U(0.1) VI(0.0) VI(0.0) [0.3,0.6] Authentication(51) VI(0.0) VI(0.0) M(0.1) M(0.1) [0.5,0.4] Encryption(c52) I(0.0) U(0.1) U(0.1) U(0.0) [0.3,0.7] Auditability(c53) VI(0.0) VI(0.0) M(0.2) U(0.1) [0.3,0.6]
Cost(C4) [0.3,0.6]
Security(C5) [0.3,0.7]
Availability(C1) [0.5,0.5]
Reliablity(C2) [0.5,0.4]
Performance(C3) [0.5,0.5]
TABLE XII: Decision Matrix Z(CSPi)
AMZ GMO Ela
Auditor1 [0.9, 0.1] [0.7, 0.3] [0.7, 0.3]
Auditor2 [0.7, 0.1] [0.7, 0.1] [0.7, 0.1]
User1 [0.9, 0.1] [0.9, 0.1] [0.9, 0.1]
User2 [0.9, 0.1] [0.9, 0.1] [0.9, 0.1]
Avg [0.24992, 3e−10] [0.24977, 7.5e−5] [0.24977, 7.5e−5]
VI. EVALUATION
A. Evaluation by IFL technique
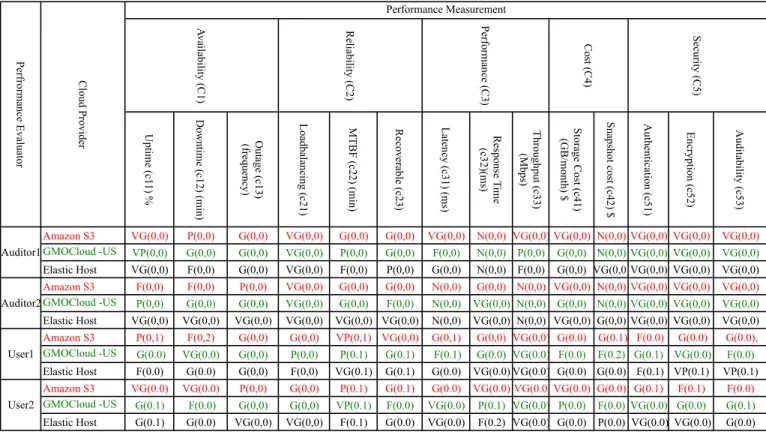
Using performance matrix assigned from decision makers from Table XI and weight ratings of each criteriaW(cj)from Table X, Z(CSPi) is calculated to assign the scoring value for each criteria (See Table XII). The corresponding values of Z(CSPi) with each SLA criteria Cj signifies the group
decision provided by 4 decision makers for 3 alternative CSPs. To evaluate the performance of the CSPs, aggregated value of all the criteria is calculated. Scoring values of each SLA criteria are calculated in Table XIII which provide the scoring for each SLA parameter under different CSPs. On the basis of scoring value, cloud user selects the appropriate cloud provider according to his/her requirement in each SLA parameter. Average value of Z(CSP)is high for the CSP Amzand low for the CSP Ela and GMO and (See Table XII), however, difference is very low. So, the overall ranking is of the selected CSPs is:Amz>Ela=GMO. Performance CriteriaCost, Secu-rityandAvailabilityofAmzshow better performance than for GMO.Elashows better performance inAvailability,Relaibility and Performance than others. However, the performance of GMO is very low in comparisons with Ela and Amz (See Table XIII) in most of the performances and does not seem equal with providerElain overall performance.
B. Evaluation by Heat Map Table
In Table IX it can be observed that, for CloudAuditor1,
providersAmzshows on sub-criteriatpT:Performance,upT: Availability, M T BF: Reliability the best performance(4), whereas cloud provider GM O shows the worst performance (0) on sub-criteria upT: Availability and bad performance (1) on sub-criteria tpT:Performance, M T BF: Reliability but cloud provider GM O shows bad performance only on
TABLE XI: Performance Matrix U pt im e (c 11) % D ow nt im e (c 12) (m in) O ut age (c 13) (fre que nc y) L oa dba la nc ing (c 21) M T BF (c 22) (m in) Re cove ra bl e (c 23) L ate nc y (c 31) (m s) Re spons e T im e (c 32)(m s) T hroughput (c 33) (M bps ) S tora ge Cos t (c 41) (G B/ m ont h) $ S na ps hot c os t (c 42) $ A ut he nt ic ati on (c 51) E nc rypt ion (c 52) A udi ta bi lit y (c 53) Amazon S3 VG(0,0) P(0,0) G(0,0) VG(0,0) G(0,0) G(0,0) VG(0,0) N(0,0) VG(0,0) VG(0,0) N(0,0) VG(0,0) VG(0,0) VG(0,0) GMOCloud -US VP(0,0) G(0,0) G(0,0) VG(0,0) P(0,0) G(0,0) F(0,0) N(0,0) P(0,0) G(0,0) N(0,0) VG(0,0) VG(0,0) VG(0,0) Elastic Host VG(0,0) F(0,0) G(0,0) VG(0,0) F(0,0) P(0,0) G(0,0) N(0,0) F(0,0) G(0,0) VG(0,0)VG(0,0) VG(0,0) VG(0,0) Amazon S3 F(0,0) F(0,0) P(0,0) VG(0,0) G(0,0) G(0,0) N(0,0) G(0,0) N(0,0) VG(0,0) N(0,0) VG(0,0) VG(0,0) VG(0,0) GMOCloud -US P(0,0) G(0,0) G(0,0) VG(0,0) G(0,0) F(0,0) N(0,0) VG(0,0) N(0,0) G(0,0) N(0,0) VG(0,0) VG(0,0) VG(0,0) Elastic Host VG(0,0) VG(0,0) VG(0,0) VG(0,0) VG(0,0) VG(0,0) N(0,0) VG(0,0) N(0,0) VG(0,0) G(0,0) VG(0,0) VG(0,0) VG(0,0) Amazon S3 P(0,1) F(0,2) G(0,0) G(0,0) VP(0,1) VG(0,0) G(0,1) G(0,0) VG(0,0) G(0.0) G(0.1) F(0.0) G(0.0) G(0.0), GMOCloud -US G(0.0) VG(0.0) G(0,0) P(0,0) P(0.1) G(0.1) F(0.1) G(0.0) VG(0.0) F(0.0) F(0.2) G(0.1) VG(0.0) F(0.0) Elastic Host F(0.0) G(0.0) G(0,0) F(0,0) VG(0.1) G(0.1) G(0.0) VG(0.0) VG(0.0) G(0.0) G(0.0) F(0.1) VP(0.1) VP(0.1) Amazon S3 VG(0.0) VG(0.0) P(0,0) G(0,0) P(0.1) G(0.1) G(0.0) VG(0.0) VG(0.0) VG(0.0) G(0.0) G(0.1) F(0.1) F(0.0) GMOCloud -US G(0.1) F(0.0) G(0,0) G(0,0) VP(0.1) F(0.0) VG(0.0) P(0.1) VG(0.0) P(0.0) F(0.0) VG(0.0) G(0.0) G(0.1) Elastic Host G(0.1) G(0.0) VG(0,0) VG(0,0) F(0.1) G(0.0) VG(0.0) F(0.2) VG(0.0) G(0.0) P(0.0) VG(0.0) VG(0.0) G(0.0) Auditor1 Auditor2 User1 User2 P erfrorm anc e E va lua tor Cl oud P rovi de r Performance Measurement A va ila bi lit y (C1) Re lia bi lit y (C2) P erform anc e (C3) Cos t (C4) S ec uri ty (C5)
TABLE XIII: Scoring Value for CSP based on SLA ParametersSW(Cj)
Amz GM O Ela
C1 C2 C3 C4 C5 C1 C2 C3 C4 C5 C1 C2 C3 C4 C5
0.1964 0.1796 0.1255 0.2376 0.20498 0.10985 0.1383 0.142 0.044 0.145 0.219 0.215 0.1750 0.161 0.12
TABLE XIV: Performance Evaluation byCloudAuditor2
TABLE XV: Performance Evaluation byU ser1
sub-criteria upT:Availability observed by Auditor2 (see Ta-ble XIV). Cloud provider Elashows the worst performance (0) on sub-criteriaenC:SecuritywhereasAM Zshows the best
performance (4) on the same sub-criteria by U ser1. Cloud providerGM Oshows the worst performance (0) only on sub-criteria M T BF: Reliability by U ser2 (see Table XV) and Table XVI). In the same way, we observed that in Table XVII, for combining result of both auditors, providerAM Z shows the best performance (4) on sub-criteria tpT: Performance,
M T BF:Reliability,upT:Availabilityas by CloudAuditor1
whereas provider GM O shows the worst performance (0) the subcriteriaupT: Availabilityand bad performance (1) on sub-criteria tpT: Performance, M T BF:Reliability. Ranking position byCloudAuditor1andU ser1among selected CSPs
is:Amz>Ela>GMO whereas the ranking isEla>Amz>GMO
byCloudAuditor2 andU ser2.
The overall ranking by both cloud auditors is: Amz>Ela>GMO and it is the same when considering opinions of all auditors and users. It is important to mention that the quantile sorting result has not to be considered as a kind of service rating. When observing in the Heat Map table that a CSP is evaluated best on a criteria, this only means that its performance is to be considered best relatively to the actually given set of potentially available CSPs [3]. That is why, in case of a same evaluation for all potential CSPs, the performance will be sorted into the best quantile for all of them (see for instance in last the column in Table IX). Dark
TABLE XVI: Performance Evaluation by U ser2
green, respectively dark red marked performances indicate best ones; respectively worst ones, on each sub-criterion.
Ordinal correlation tau provides the dominancy role in sorting order, i.e. higher the tau value, higher the domi-nancy role(for instance the third row of Heat Map table in Table IX). Performance sub-criteria Throughput (tpT) and Latency (Lat), Availability sub-criteria Uptime (upT) eval-uated by CloudAuditor1, Reliability sub-criteria Recover-able (Rcv), Availability sub-criteria Uptime (upT) evaluated
by CloudAuditor2 andPerformancesub-criteriaThroughput
(tpT) and Latency(Lat),Reliability sub-criteriaMTBF, Avail-ability sub-criteria Uptime (upT) evaluated by both auditors do influence most of the ranking recommendation. Similarly, Availability subscription Uptime (upT) andDowntime (dwT) evaluated by U ser1 and Reliability subscription MTBF eval-uated by U ser2 dominated the ranking decision respectively. Table XVIII returns the complete evaluation by all evaluators where sub-criteria with tau= 1.00 do influence the ranking order.
VII. RESULTANALYSIS
Both Heat Map and IFL techniques provide evaluations of three potential CSPs using the same input data. In the overall evaluation, IFL techniques gives the ranking order of CSPs: Amz >Ela = GMO whereas Heat Map technique gives the overall ranking order: Amz> Ela> GMO by both auditors. Similar performance evaluation is assigned in Heat Map individually for U ser1 and U ser2 as in IFL technique. In general, the overall position of CSPs remains the same. CSPs Ela and GMO have the same performance ranking in the overall IFL evaluation (See Table XII) but performance evaluation in individual criteria is clearly different for overall evaluation by IFL technique for Ela and GMO. Individual evaluation of GMO is comparatively lower than the overall evaluation of providerEla.
Performance evaluation by Heat Map does not only provide the performance ranking of the CSPs but it also provides a transparent visualization of individual criteria, which separates evaluations of individual decision makers, but it still combines result of all the decision makers. In overall performance ranking (see for instance in Table XVIII), it gives convinc-ing results accordconvinc-ing to the performance measured by cloud auditors. For instance, cloud providers Amz and Ela look comparatively close in ranking position of performance mea-surement.Availabilityfactor subs-criteriadowntime(dwT) and
Uptime (upT), Performance factor subs-criteria Throughput (tpT) andLatency(Lat),Reliabilityfactor subs-criteria MTBF (MTBF) played dominating role for the position determination as represented by highesttauvalue (See Table XVIII). In case of providerGMO, it is clear that it has lower performance than the other cloud providers.
Positions of cloud providerElaandGMO are the same by IFL and 2nd and 3rd in Performance Heat Map Table. IFL technique is less convincing, because individual performance is in fact very low in providerGMO (See Table XIII). In our observation, it is because the IFL technique is heavily guided by the opinion of the most critical performance evaluators. If any of the users provides very bad feedback of a CSP, it has strongly negative impact on the final position of that CSP. Even if other decision makers judge this CSP as the one with the best performance, the position of that CSP may be lower due to single inconsistent performance evaluator. Beside the fact that IFL can include hesitation degree, it does not increase the precision of the ranking. In spite of high multiple decision alternatives, a new HPC linear ranking algorithm for very big performance tables (up to several thousand of decision alternatives) gives the results less than 3 seconds [22] in Heat Map Technique. So, performance Heat Map is highly computationally scalable for the multiple decision alternatives. In both performance evaluation techniques (see Table X and Section V-B1) decision makers can provide the importance of their requirements in specific selection criteria.
VIII. CONCLUSIONS ANDFUTUREWORK
In this paper, we analyzed the performance of three com-mercial providers using data from measurements and opinions on cloud providers, using IFL and Heat Map techniques. These two techniques return different overall performance rankings. Performance Heat Map provides a convincing, consensually ranked and transparent multiple criteria performance ranking of commercially available providers, contrary to the IFL technique. In our observation, the performance Heat Map is a tool that is more expressive and precise than the IFL technique in case of recommendation of cloud services to the cloud users according to their specific requirements by cloud service brokers. The performance Heat Map technique provides more convincing results when numbers of alternatives increases to more than few alternatives. Our future work includes an evaluation of big numbers of cloud providers with multiple decision criteria and sub-criteria of commercially available cloud providers using Heat Map technique.
ACKNOWLEDGMENT
This work was partially funded from Luxembourg National Research Fund (FNR) Green@Cloud (INTER/CNRS/11/03) project. S. S. Wagle would like to thank LAST-JD program for financially supporting to perform this research.
REFERENCES
[1] “Qos modeling for green scheduling in clouds,” 2015,
”http://homepages.laas.fr/tguerout/data/PUBLIS/REVUES/SUSCOM EARMS QoS Modeling for Green Scheduling in Clouds.pdf”.
TABLE XVII: Performance Evaluation by all Auditors
TABLE XVIII: Performance Evaluation of All Auditors and Users
[2] M. Guzek, A. Gniewek, P. Bouvry, J. Musial, and J. Blazewicz, “Cloud brokering: Current practices and upcoming challenges,”Cloud
Computing, IEEE, vol. 2, no. 2, pp. 40–47, Mar 2015.
[3] S. S. Wagle, M. Guzek, P. Bouvry, and R. Bisdorff, “An evaluation model for selecting cloud services from commercially available cloud providers,” inIEEE 7th International Conference on Cloud Computing, Vancouver, Canada, Nov. 2015, pp. 107–114.
[4] S. S. Wagle, “Sla assured brokering (sab) and csp certification in cloud computing,” inUtility and Cloud Computing (UCC), 2014 IEEE/ACM
7th International Conference on, Dec 2014, pp. 1016–1017.
[5] S. S. Wagle, M. Guzek, and P. Bouvry, “Cloud service providers ranking based on service delivery and consumer experience,” inIEEE
4th International Conference on Cloud Networking (CloudNet), Niagara
Falls, Canada, Oct. 2015, pp. 202–205.
[6] P. Wang, “Qos-aware web services selection with intuitionistic fuzzy set under consumers vague perception,”Expert Systems with Applications, vol. 36, no. 3, Part 1, pp. 4460 – 4466, 2009.
[7] S. Wang, L. Huang, C.-H. Hsu, and F. Yang, “Collaboration reputation for trustworthy web service selection in social networks,”Journal of
Computer and System Sciences, vol. 82, no. 1, Part B, pp. 130 –
143, 2016, mobile Social Networking and computing in Proximity (MSNP): A Multi-disciplinary Inspired Approach. [Online]. Available: http://www.sciencedirect.com/science/article/pii/S0022000015000719 [8] K. Garg, S. Versteeg, and R. Buyya, “Smicloud: A framework for
comparing and ranking cloud services,” in IEEE 4th International
Conference on UCC, Dec 2011, pp. 210–218.
[9] “C. S. M. I. C. (csmic), smi framework,” 2014,
”http://betawww.cloudcommons.com/servicemeasure mentindex”. [10] S. Thomas, “Theory and applications of analytic network process.”
Pittsburgh, PA: RWS Publications, 2005.
[11] A. Li, X. Yang, S. Kandula, and M. Zhang, “Cloudcmp: Comparing public cloud providers,” inProceedings of the 10th ACM SIGCOMM
Conference on Internet Measurement, ser. IMC ’10, 2010, pp. 1–14.
[12] M. Guzek, S. Varrette, V. Plugaru, J. E. Pecero, and P. Bouvry, “A
holis-tic model of the performance and the energy efficiency of hypervisors in a hpc environment,” Concurrency and Computation: Practice and
Experience, vol. 26, no. 15, pp. 2569–2590, 2014.
[13] L. Qu, Y. Wang, M. A. Orgun, L. Liu, and A. Bouguettaya, “Cloud service selection based on contextual subjective assessment and objective assessment,” in Proceedings of the 2014 International Conference on
Autonomous Agents and Multi-agent Systems, ser. AAMAS ’14, 2014,
pp. 1483–1484.
[14] P. Choudhury, M. Sharma, K. Vikas, T. Pranshu, and V. Satyanarayana, “Service ranking systems for cloud vendors,” January 2012, pp. 433– 440.
[15] K. Atanassov and G. Gargov, “Interval valued intuitionistic fuzzy sets,”
Fuzzy Sets Syst., vol. 31, no. 3, pp. 343–349, Jul. 1989.
[16] K. T. Atanassov, “Intuitionistic fuzzy sets,” Fuzzy Sets Syst.,
vol. 20, no. 1, pp. 87–96, Aug. 1986. [Online]. Available:
http://dx.doi.org/10.1016/S0165-0114(86)80034-3
[17] R. Biswas, “Intuitionistic fuzzy relations,” Bulletin for Studies and
Exchange of Fuzziness and its Applications BUSEFAL, vol. 70, p. 2229,
july 1997.
[18] “An application of intuitionistic fuzzy sets in medical diagnosis,”Fuzzy
Sets and Systems, vol. 117, no. 2, pp. 209 – 213, 2001.
[19] R. Bisdorff, “On polarizing outranking relations with large performance differences,” Journal of Multi Criteria Decision Analysis, vol. 20, no. 1-2.
[20] ——, Evaluation and Decision Models with Multiple Criteria: Case
Studies. Berlin, Heidelberg: Springer Berlin Heidelberg, 2015, ch. The
EURO 2004 Best Poster Award: Choosing the Best Poster in a Scientific Conference, pp. 117–165.
[21] ——, “On measuring and testing the ordinal correlation between bipolar outranking relations,” inFrom Multiple Criteria Decision Aid to
Pref-erence Learning, NOV 2012, pp. 91–100.
[22] ——, “Ranking big performance tableaux with multiple incommen-surable criteria and missing data,” in 30th Annual Conference of the