Zhong, Zhuqiang (2013) Does Mergers and Acquisition
Improve Performance? [Dissertation (University of
Nottingham only)] (Unpublished)
Access from the University of Nottingham repository:
http://eprints.nottingham.ac.uk/26714/1/Does_Mergers_and_Acquisition_Improve_Performa nce.pdf
Copyright and reuse:
The Nottingham ePrints service makes this work by researchers of the University of Nottingham available open access under the following conditions.
· Copyright and all moral rights to the version of the paper presented here belong to the individual author(s) and/or other copyright owners.
· To the extent reasonable and practicable the material made available in Nottingham ePrints has been checked for eligibility before being made available.
· Copies of full items can be used for personal research or study, educational, or not-for-profit purposes without prior permission or charge provided that the authors, title and full bibliographic details are credited, a hyperlink and/or URL is given for the original metadata page and the content is not changed in any way.
· Quotations or similar reproductions must be sufficiently acknowledged. Please see our full end user licence at:
http://eprints.nottingham.ac.uk/end_user_agreement.pdf
A note on versions:
The version presented here may differ from the published version or from the version of record. If you wish to cite this item you are advised to consult the publisher’s version. Please see the repository url above for details on accessing the published version and note that access may require a subscription.
University of Nottingham
Does Mergers And Acquisition Improve Performance?
Zhuqiang ZHONG
A Dissertation presented in part consideration for the
degree of M.Sc. Finance and Investment
Does Mergers And Acquisition Improve Performance?
By
Zhuqiang ZHONG
Acknowledgement
I would like to express my gratitude to all the people who have helped me from the initial
research to the final compilation of this dissertation.
Special thanks to my supervisor Dr. Joel Stiebale who has the attitude and the substance of a
genius: he continually and convincingly conveyed a spirit of adventure in regard to research
and scholarship, and an excitement in regard to teaching. Without his guidance and persistent
help this dissertation would not have been possible. I would like to thank my friend Heng Lei,
Luxi Li, Yu Zheng and Jiannan Luo who have given me helpful suggestion when I was stuck
in data collection and analysis.
Finally, I would express my gratitude to my parents, the love of my life Yang Dai, whose
support have made my study in the United Kingdom a reality and constant encouragement
helped me through the hard times of this program. My deepest appreciation is expressed to
them for their love, understanding, and inspiration. Without their blessings and
encouragement, I would not have been able to finish this work.
This dissertation would have encountered many difficulties, had the support of these people
Abstract
Merger and acquisition is an important way for companies to expand market share, obtain
greater market power and set up new disciplines. Generally, people believe that merger and
acquisition would bring benefit from the acquirer as the managers of acquirers are assumed
make rational decisions. However, previous studies have shown that acquirers may not
benefit from merger. Researchers conduct studies on merger performance from various
prospective in order to explain the post merger performance of the target or acquirer. For
example, some of them focus on the relationship between the payment method and merger
performance. Some of them focus on the industry relevance while some may believe the
initial share in target may affect post merger performance. In this dissertation, we are going to
analysis the merger performance in a different way. We will use event study method to find
out the relationship between the merger performance and the way of merger, takeover and
Content
Chapter 1: Introduction... 7
1.1 Purpose of Study ... 7
1.2 Terminology and Concepts ... 8
1.3 Plan of Dissertation ... 10
Chapter 2: Literature review ... 10
2. 1 Why companies choose mergers and acquisitions? ... 10
2.1.1 Value creation. ... 11
2.1.2 Managerial Self-interest (Value Destruction) ... 13
2.1.3 Environment Factors ... 14
2.1.4 Firm Characteristic ... 16
2.2 Merger and Acquisition Performance ... 17
2.3 Research method Literature Review ... 23
2.3.1 Event study ... 23
2.3.2 Accounting Method ... 25
2.3.3 Clinical study ... 27
Chapter 3: Merger Wave Overview ... 28
3.1 The first wave (1983 to 1904) ... 29
3.2 The second wave (1919 to 1929) ... 29
3.3 The third wave (1955 to 1969-1973) ... 30
3.4 The Fourth wave (1974-1980 to 1989) ... 30
3.6 The sixth wave (2002 to 2010) ... 33
Chapter 4: Methodology and Data Collection ... 33
4.1 Methodology ... 33
4.2 Data Collection ... 37
Chapter 5: Data Analysis ... 39
5.1 Takeover Acquirer ... 39
5.2 Takeover Target ... 42
5.3 Tender offer Acquirer ... 46
5.4 Tender off Target ... 49
Chapter 6: Conclusion ... 54
Chapter 1: Introduction
Merger and acquisitions are popular and have important impacts due to the large amount and
size of deal. It has influence on the stakeholders such as acquirer, target, shareholder,
intermediary agencies and regulatory agencies. Researches in mergers and acquisitions have
been developed for over five decade in USA and Europe. One of the most important issues in
this area is that whether acquirer and target gain from M&A. Most of the findings on this
issue were based on the data from twenty years ago. Therefore, in this dissertation, we are
going to focus on the USA M&A performance.
1.1 Purpose of Study
Past studies has found positive return for target firm shareholder while the acquirer
shareholder’s return are remain unclear. Jarrell and Poulsen (1989) conducted a study on 526
companies involved in tender offer deal about between 1963-1986 and found out that there is
positive return for target companies in tender offer deal.
Bradley (1980) found that shareholders of acquirer have positive return on tender offer deal as
well. Asquith, Bruner and Mullins examined 170 companies, which are involved in takeover
deal, and found out that there is positive return for acquirers. Kaplan and Weisbach (1992)
examined 271 companies involved in takeover deal between 1971 and 1982 found out that
1.2 Terminology and Concepts
Mergers generally refers to two companies consolidate into one company. It is a combination
of business. The acquired firm no longer existed after the merger. Consolidation is similar to
merger, both of the target and the acquirer firm become a part of the new firm. Acquisition
means one company purchased and owned other company while there is no new company
founded. A tender offer is a public offering made by acquirer to all shareholders of target
company, which is normally a public company, about tender their stock for a specific price
over a specific period. In a tender offer, the acquirer contacts the target shareholder directly.
The management team may not have information or control about the deal. A takeover is the
transformation of control from one company’s shareholders to other company. It can be realized using proxy contest and privatization.
Brealey and Myers (2004) and Gaughan (2002) divide mergers and acquisition into three
categories:
1) Horizontal mergers and acquisitions
It is the combination between two companies, which are in the same industry. For
example, the combination of Bank of American and Merrill Lynch. The major reason
for M&A in similar business is to obtain synergy between two companies. Besides,
merger and acquisition is also a way to increase market power, diversify services,
achieve economic of scale. The competition degree of a industry is increased by the
horizontal M&A activities. Consumers will benefit from the increased competition
2) Vertical mergers and acquisitions
It is a combination of two companies, which are processing different stage of certain
products or services within the same industry. There are two ways of vertical mergers
and acquisitions: 1) Forward M&A. When a company buys it product distributor, in
the direction of target consumers, it is called forward M&A. Acquirer can benefit from
reduced marketing and delivering cost. 2) Backward M&A. When a manufacturer
acquires its material supplier in order to reduce the production cost, it is called
backward M&A.
3) Conglomerate mergers and acquisitions
It is the mergers and acquisitions between companies from unrelated industries. They
are neither competitor nor related business partner to each other. The main reason why
this type of mergers and acquisitions will happen is that it is an efficient way of
allocating capital and the management team is unwilling to distribute cash to
shareholders. Companies can enter a new emerging market using this type of
acquisition.(Marks and Mirvis, 1998)
4) Concentric
The area, where the target firm is in, is where the acquirer interested to expand to,
however unfamiliar with. The mergers and acquisitions between these companies are
called concentric. For example, Facebook. Inc acquires Instagram.
Other key terms in M&A literature are:
Target: A company being acquired by the bidder.
Announcement date: It is the day that the M&A information become public information in
event study.
1.3 Plan of Dissertation
The remaining part of this dissertation is showed as following.
The next chapter, Chapter 2, is the literature review. In this chapter, we are going to
summarize past studies of mergers and acquisition area in different aspects. Chapter 3 is
design the overview of mergers and acquisition waves in USA and Europe. The detail of data
collection and event study method will be explained in Chapter 4. The analysis of empirical
results of the effect of different type of M&A on shareholders’ wealth will be showed in Chapter 5. Chapter 6 concludes our research result and shortcoming of current study.
Chapter 2: Literature review
2. 1 Why companies choose mergers and acquisitions?
The reason for acquiring can be divided into four categories: Value creation, managerial
2.1.1 Value creation.
2.1.1.1 Market power.
It may be considered as an attempt to extract more value from customers. Financial literature
was the first to study the market power hypothesis.by examining rival firms’ stock price
reaction to horizontal mergers. Some scholar believes that there is no supporting evidence for
market power as an acquisition antecendent. (Eckbo, 1983; Stillman, 1983) Some economist
argued that, as the rivals studied were larger firms with multiproduct, only a small percentage
of their revenue were influenced by the market and that the sample period examined has
highly restricted antitrust regulation. Prager (1992) conducted a study on market power
hypothesis using the same methodology on a period with antitrust laws and diversified firms.
He found that the share price of the rivals of railroad industry increased in the announcement
week. This evidence supports for market power hypothesis.(Prager,1992) Kim and Singal’s (1993) study shows that in 1980s airline mergers, the merging firms increased their price on
their route while other companies that is not effected by the merger, remain the same.
Therefore, there is some evidence stands for market power as an acquisition motive.
2.1.1.2 Efficiency
Economists also conduct studies on whether acquisitions are motivated by the desire to reduce
cost. Banerjee and Eckard (1998) found that the market drive up horizontal mergers during
the first merger wave. Moreover, scholars found that mergers can improve long-term plant
Chang, & Cunningham, 2003). However, all evidence is not very straightforward. Klein (2001)
found that the if a conglomerate company is in a late period, the diversification is discounted.
However, contrary to prior work implying inefficiency in 1960s conglomeration (e.g., P.
Berger & Ofek, 1995; Jensen & Ruback, 1983; Kaplan & Weisbach, 1992), Klein reported a
premium for late-1960s acquisitions, supporting the efficiency motive for unrelated
acquisitions during early yet not later periods.
2.1.1.3 Resource reallocation
Horizontal acquisitions normally led to signify resource reallocation between acquirers and
target. (Capron, Dussauge, and Mitchell, 1998) King, Slotegraaf, and Kesner (2008)’s study
shows that the abnormal return of acquirer is influenced by the degree of acquirer and target
firm resource complementarity. Karim and Mitchell (2000) state that the resource of acquirers
has greater changes than those non-acquirers. Moreover, merger may be a way of innovation.
Puranam and Srikanth (2007) shows that the acquirers can absorb the target company’s innovation resource by either integrating those resources with them or leverage the innovative
ability of the firm as an independent unit. This result is in consistent with Lubatkin, Schulze,
Mainkar and Cotterill’s (2001) research that market position and resources of firm involved
M&A deal effect the future product market performance.
2.1.1.4 Market discipline
Research in finance indicates that the acquisitions can be used to discipline the ineffective
could protect shareholder from poor management. (Jensen, 1986; Jensen & Ruback, 1983).
Agrawal and Walking’s (1994) research shows that the compensation of the of target company manager who received overpaid compensation before the merger is reduced after the deal is
completed. Their research implies an market discipline hypothesis assumptions that
companies with poor corporate governance will lead to low market value and will be taken
over by higher value acquirers. However, Rhodes-Kropf and Robinson (2008) states that
firms with similar value will tend to merger with each other. Wang and Zajac (2007) found
that firms with similar resources prefer an acquisition rather than an alliance. ‘
2.1.2 Managerial Self-interest (value destruction)
2.1.2.1 Compensations
Researcher has prove that there is important linked between compensation, ownership and
acquisitive behavior. Agrawal and Walkling (1994) shows that industries with higher CEO
compensation normally more interested in active acquisition. The stock option of acquiring
CEO (Sanders, 2001) and director (Deutsch, Keil, & Laamanen, 2007) has a positive
relationship with mergers and acquisition activities. The compensation of the CEOs of
acquirers normally increased after the acquisition, Moreover, managing large firms can
increase CEO discretion and power, therefore it can protect manager and reduced the
employment risk. (e.g., Gomez-Mejia & Wiseman, 1997; Haleblian & Finkelstein, 1993;
Hambrick & Finkelstein, 1987). In general, acquisitions may be too attractive to CEOs than it
2.1.2.2 Managerial hubris
Past studies have shown that managerial confidence may also increase merger behavior. Roll
(1986) was the first to introduce the CEO hubris, over self-confidence, as acquisition motive.
Hayward and Hambrick’s (1997) research is in accordance with this study, they found out that CEO’s over confidence increases acquisition premiums, on the other hand deceased acquisition performance. Overconfident CEOs will overestimate their ability to generate
returns. (Malmendier and Tate, 2008)
2.1.2.3 Target defense tactics
Some argue that this tactic is used to protect managers’ benefit at the cost of shareholder wealth. Field and Karpoff (2002) found that the strategies used by IPO managers ahs negative
relationship with the possibility of subsequent acquisition. However, Bates and Lemmon
(2003) states that target payable fee led to higher deal completion rates and greater takeover
premiums. They indicate that homogeneous effect does not exist in defense tactics. The
illiquid stock owned by target CEOs has a positive relationship with the possibility of being
acquired. Cai and Vijh (2007)
2.1.3 Environment Factors
2.1.3.1 Environmental uncertainty and regulation
Researchers have being trying to find out the relationship between environment and strategy
of environment can increase the possibility of collaboration over acquisition, it also increase
the possibility of acquisition over licensing agreements. (Schilling & Steensma, 2002) Highly
diversified companies prefer to perform acquisition in stable environment while less
diversified companies do it the other way round. (Bergh and Lawsless, 1998) Some researcher
find out that external governance structure may also influence acquisition possibilities.
Matsusaka (1996) found that antitrust law did not seem to hinder acquisitions. Moreover,
M&A activities in countries with higher accounting standard and stricter shareholder
protecting regulations seems to be more active than those counterparts. (Rossi and Volpin,
2004) recent work shows that due to the regulation on sin industries, companies are trying to
gain political influence through domestic expansion in order to offset the cost of such
regulations. (Banish, Jansen, Lewis, & Stuart, 2008).
2.1.3.2 Imitation and resource dependence
Pfeffer (1972) shows that firms obtain resource dependencies by absorbing firms with need
resources. However, Finkelstein (1997) states that the strength of this connection was weaker
than originally found. In interindustry mergers, the power imbalance between two firms is the
obstacle to the merger although the interdependency between two firms is the key driver of
acquisition behavior.
2.1.3.3 Network ties
Granovetter (1973) originally developed the network ties research. Haunschild (1993) states
these firm would tend to imitate the merger activities of each other. The changes in the merger
activities of these firms had significant positive effects on changes in focal firm acquisition
activities. (Westphal, Seidel, and Stewart, 2001) Their research explains one of the important
reasons of merger is the managers’ desire to realize peer isomorphism.
2.1.4 Firm Characteristic
2.1.4.1. Acquisition experience
In general, recent acquisition experience is positively related to succeeding acquisition
possibilities, especially when there is signify performance improvement. (Haleblian, Kim, &
Rajagopalan, 2006) However, other studies found out that he acquisition experience would
increase the possibility of succeeding mergers of the same type (e.g. horizontal, vertical,)
(Amburgey and Miner, 1992) while the possibility of mergers of any different types will
decrease. (Yang and Hyland, 2006) Baum, Li and Usher (2000) companies acquired would
tend to acquire other firm with similar organization structure and geographic location as their
most recent mergers. Vanhavebeke, Duyster and Noorderhaven (2002) states that previous
alliance experience increased the likelihood of one partner acquiring the other, highlighting
the influence of experience, in general, on acquisition behavior.
2.1.4.2 Firm strategy and position
Firm strategy and position may have strong influence on merger activities. Companies with
with multidomestic strategy have a higher proportion of mergers. (Harzing, 2002) Moreover,
the targets are confront with difficult strategic hurdles are more likely to be acquired than
those without this kind of hurdles. (Graebner and Eisenhardt, 2004)
2.2 Merger and Acquisition Performance
The theoretical research mainly focuses on whether mergers and acquisition generate value,
whom benefits from mergers and acquisitions and how mergers and acquisitions generate
value when discussing whether mergers and acquisitions improves performance. Meeks
(1997), Mueller (1980), Ravenscraft and Schere (1987) etc., had different results about the
mergers and acquisition performance study.
Regarding whether mergers and acquisition improve performance, scholars had the following
findings. In the 1960’s, most of the scholars who are interested in this area are micro
economists. Their study shows that the financial income was close to zero or even negative.
In the 1970’s, micro-finance economists analysis this topic using even study method with efficient market hypothesis. Their study shows that shareholders’ overall welfare was positive. The shareholders of target firms have a significant positive and steady return while the
shareholders of acquirers has a insignificant small return. (Jarrell, Gregg, and Annette Poulsen,
1989) Salter and Weinhold (1979) classified mergers and acquisitions into relevant M&A ad
non-relevant M&A according to correlation of their strategies. They used event study to
mergers and acquisitions generates more value the non-relevant mergers and acquisition.
Ghosh (2001) and Linn & Switer (2001) found out that there is no significant difference
between relevant M&A and non-relevant M&A in generating value for shareholders and
realizing synergy. Agrawall, Jaffe and Mandelker (1992) found out that non-relevant mergers
and acquisition shows that the non-relevant M&As generates higher return than relevant
mergers and acquisition.
Generally, people may think that as the acquirers rationally start the merger and acquisition,
their shareholders should be the one who benefit from the merger and acquisition deal.
However, evidences show different results. Scholar used various methods such as event study,
accounting research method and so on to analysis the long term performance and short term
performance of mergers and acquisition. They generally agreed that mergers and acquisition
brings positive over all return and generates value, but target and acquirer individually has
different return on a M&A deal. M&A brings significant positive abnormal return and a high
price premium for the shareholders of target companies while the share value of the acquirer
barely change and in long term, M&A generally brings negative cumulative abnormal return
for shareholders of acquirer. (Gao, Y.S., 2004)
In the way of how M&A generates value, theorists and participations both agreed that mergers
and acquisition mainly generate value through restructuring and synergy effect. Restructuring
refers to the acquirer make profit from selling certain departments of target firm to better
buyers. That is the M&A value mainly generated by the target firm. Synergy refers to through
from both sides to generate value. Buono, Bowditch and Lewis (1985) states that the
management difference may be the reason why a merger deal can not achieve its target is that
there is different. Case studies conducted by Callahan (1986), Lipton(1982) and Rapport
(1982) also show that the difference in management style and working values can cause a lot
of problem during integration. Datta (1991)’s empirical study shows that the difference in
management style has negative effect on the post-M&A performance. Haspeslagh and
Farquhar (1987) analyzed the merger process from two divisions: the dependence of their
strategy and the demand of organization independence. From those successful cases, they
concluded that there are four typical process forms post-M&A integration: Absorb, symbiosis,
protection and control. Briginshaw, Bresman and Hakanson (2000) analyzed the integrating
process of the research and development department of three multinational Sweden
companies. They used two divisions: task integration and human resource integration and
found out that there are two stages of integrating process.
The payment way has influence on the control power and the post-M&A organization
structure. There are two major ways of payment: cash payment and stock payment. Different
payment method has different impact on the shareholders’ return. Eckbo (1983) believed that merger is a good way of tax avoidance and proposed the idea of tax synergy. In his theory,
using stock payment can be a good way of deferring tax for target company’s shareholder and substitute for some taxes, which will benefit the shareholders of target company. Acquirer can
increase its asset when using cash payment, it can increase the depreciation rate, and therefore
(1984), Travlos (1987) and Louis (2002) agreed that management team will tends issue new
stock to finance for new merger plan when they believe that the stock price is overvalued.
Thus, the stock price may not be a good indicator to reflect merger information and stock
price will decrease in long term. Rau and Vermaelen (1998) discovered that investors will
have an impression that the stock price of acquirer is overvalued when using stock payment
Therefore, when the deal is announced the stock price will decrease as investors has adjusted
their expectation.
The empirical result shows the cash payment can generate more abnormal return than stock
payment. (Gordon and Yagil, 1981) Linn & Switzer (2001) proved that the abnormal return of
cash payment is higher from the target company prospective. However, Louis(2002)
concluded that the long term abnormal return of acquirer is negative when using cash
payment.
Some scholars believe that the merger and acquisition performance is related to the industry
relevance of both sides. Kogut and Singh(1988) examined 203 M&A deals during 1970 and
1978. The result shows that as for acquirer, relevance M&A generate larger value than
non-relevant M&A. Shelton (1988) had the similar conclusion that horizontal M&A and
relevant M&A can generate high return. Industry relevance can be divided into four segments:
1) mixed and non-mixed 2) vertical, horizontal and mixed 3) level of overlap 4) change of
corporate focus. Healy, Palepu and Ruback (1992) used the level of overlapping as criteria
and found out that industries with higher level of overlapping have better performance than
discovered that long-term performance is significantly positive if companies improve
corporate focus through selling non-core assets. Ghosh (2001) and Linn & Switzer (2001)
found out that there is no significant positive relationship between corporate focus and long
term performance. Agrawal, Jaffe and Mandelker (1992) states that the long term stock price
level of a mixed M&A is higher than non-mixed M&As. Megginson, Morgan and Nail (2002)
shows that the difference of sample, time horizon reason, control variable and research
method is the why the above researches have different result. Therefore, they suggest that we
should use Herfindahl Index to measure the change in industry relevance. They empirically
examined 204 mergers and acquisition deals during 1997 and 1996. The result shows that
there is a signify positive relationship between long-term M&A performance and change in
corporate focus. In their theory, within three year after the merger and acquisition, every 10%
decease in corporate focus will lead to 9% decrease in shareholders’ wealth, 1% decrease in operating performance, 1.2% in operating cash flow and the market value will shrunk by 4%.
Companies can be divided into two types: growth stock and value stock. There is a classic
theory, which describes the relationship of between these two types of stock and merger
performance, called performance extrapolation hypothesis. This theory is supported by Franks,
Harris and Titman (1991), Fama and French (1992) ‘s research. It believed that the majority of investor and other stakeholders evaluate the merger performance according to the past
performance. People generally used price-to-book ratio as a measurement. Firms with high
price-to-book ratio are classified as value stock and those with low price-to-book ratio are
return than value company during the announcement period due to the excessive expectation.
2) In long term, as the market will adjust the market value of the overvalued companies,
therefore the abnormal return of value acquirer will be higher than growth acquirer. 3) The
growth acquirer will pay more for price premium. Therefore, it believes that there is a
negative relationship between price-to-book value and short-term performance and a positive
relationship between price-to-book value and long term performance. In Lang, Stulz and
Walkling (1991)’s test, they found that the return of the acquirer during the announcement
period is positive related to Tobin's Q ratio. Anderson and Mandelker (1993) came to the same
conclusion using price-to-book ratio to examined long term performance of 670 merger deals
during 1966 and 1987. Rau and Vermalen (1998) testified banking industry samples and prove
the second and the third statement of performance extrapolation hypothesis. They states that
the abnormal return of growth companies is -17.3% three year after the merger while the
abnormal return of value companies is 7.6%. However, Louis (2002)’s result shows that there is a positive relationship between price-to-book ratio and long term performance in banking
industry. Excluding the banking industry, there is a insignificant result that long abnormal
return of growth acquirer, -10.1%, is higher than value acquirer, -18.5%.
There is some theory focus on the relationship between the acquirer’s initial share and merger
performance. As before the announcement date, the acquirer is the only one that has internal
information about the merger deal. Therefore, acquirer can buy target company’s share from the market and set up a toehold percentage in order to push the target stock price to the deal
Vishny (1986) found that the possibility of successful M&A and the acquirer’s expected profit
will increase if the acquirer’s initial share in the target firm increases. However, Bradley (1988)’s research was against this result. His study believed that the profit generate from the initial share is no large enough to cover the merger cost and most of the acquirer do not own
target companies’ share when merging. There are two reasons: 1) As there is legal restriction, it is no possible to buy a large amount target firm’s share secretly in the stock market. 2)
When the transaction is not active in the market, buying a large amount of target companies’
stock will expose the merger information to those investors who are seeking for undervalued
stocks. The stock price will increase to the deal price and decreases the profit. Jenning (1991)
found that only 15% of acquirer have initial share in target firm and the average initial share
are very low, 3%. However, in deals with multiple bidder, the average initial share increased
to 18%. Hay, Warren and Drager (2001) states that at the beginning of bidder period, it is
easier for the acquirer to buy in target companies’ share secretly.
2.3 Research method Literature Review
2.3.1 Event study
Normally event study is a research method applied to predict the financial gains and losses
using financial market transaction data. (Sharma, 2010). “For instance, the announcement of a
merger or acquisition between two banks can be analyzed to make predictions about the
(Romans Tjurins, 2011) Using event study, we can know whether the return to shareholders
changes during the period surrounding the announcement date of a merger and acquisition
deal. It is an dominant financial research method in the area of mergers and acquisitions
performance research.
Event study measures stock reaction to events. Price reaction is reflected by abnormal returns.
Abnormal return is sometimes triggered by events, such as merger, dividend announcements,
interest rate increases etc. It is stock returns adjusted for normal stock price and market index
movements. Test statistics are used to identify whether to ascribe target abnormal returns to
the event. Using event study, we need to start presume how certain event effects the value of a
firm. The hypothesis that the value of the company has changed will be translated in the stock
showing an abnormal return. (Romans Tjurins, 2011) The assumption that price is embedded
with merger and acquisition information, the concept of abnormal return is the key of event
study method.
Andrade, Mitchell and Stafford (2001) conducted a study on the relationship between merger
reasons and long-term effect. This study includes relevant M&A data over 25 year and
measures the value creation or destruction after mergers. Their event windows are
surrounding the announcement date. They used three days for short period and 20 days for
longer period. They found out that companies try to use merger as a way to create synergies,
increase their market share and bargain power so that they can become a monopoly and set up
new market disciplines. Their result shows that the abnormal return in longer windows period
firm’s value increased about 2% compared with the beginning of the merger.
Loughran and Vijh (1997) conducted a study on the relationship between the post acquisition
returns and the payment method and acquisition type. Their samples are based on 947 M&A
deals during 1970 and 1989. Within five year after the merger, companies merged using stock
payment have a negative return of -25% while companies used cash payments obtained a
significant positive excess return of 61.7%. Not all the shareholders of target companies can
gain from mergers and acquisition.
Frank, Harris and Titman (1991) conduct a study on the share-price performance after the
takeover. They studied on 399 U.S. takeover cases from 1975-1984. They results shows that
there is a 28% average return for the target firm shareholder since announcement date, while
shareholders of acquirers have neither gains nor losses. Merger and acquisition deal using
cash payment generate more return to target than deals using a stocks or mixture of securities.
Their result is in consistence with Jensen and Ruback (1983)’s study that the poor post-merger performance for acquirers may due to the benchmark errors rather than the mispricing.
Equally weighted benchmark may cause poor post merger share-price performance, however
in their research, there is a positive post merger performance when using value weighted
benchmark.
2.3.2 Accounting Method
Accounting study uses financial data from financial statements of acquirer’s pre and post merger period to measure the change in financial performance. Tools like return on equity,
return on assets, leverage, liquidity and earnings per share are generally used in this method to
identify the difference in financial performance. The research purpose of these studies is to
find out whether mergers and acquisitions able to provide a competitive advantage to the
acquirer. (Bruner, 2002)
Ghosh (2001) attempt to find out whether the improvement of post merger operating
performance is influenced by the payment method and how does mergers improve operating
performance. His sample set includes all the M&A cases during 1981 and 1995. In order to
find out whether mergers and acquisitions can improve operating performance, he compares
merged company’s pre and post merger operating cash flow performance. He took superior
pre-acquisition performance, size and firm into account in order to have a surefire benchmark
and avoid bias in the regression analysis. In his study, there is no evidence supporting that
operating cash flow performance improves during the post acquisition period. However,
Healy, Palepu and Ruback (1992) have an opposite result that there is a better cash flow
performance after acquisition. In his study, he concludes that cash payment was better than
the stock payment as it utilized the asset and provide better gain on wealth for both sides. A
higher sale is the major reason for performance improvement. Dickerson, Gibson and
Tsakalotos (1997)’s study tried to find out the difference in performance of company after the
M&A and the changes in return. They examined 2491 firms, which took part in M&A in UK
between 1948-1997. Their result is in accordance with Ghosh (2001)’s result, implying that
acquisition did not improve the acquirer’s profitability. Moreover, it has negative impact on
performance driven by the internal growth rather than the growth brought by mergers and
acquisition. Berger and Ofek (1995) estimate the diversification effect on firm value. They
impute individual values for difference business segments. Their research shows that the
advantages, such as improved debt capacity, lower taxes, operating efficiency and synergy,
realized at cost of transforming resources from segments with better performance to poor
segments. Poor investment and negative net present value may be a result of diversification.
Their result indicates that diversification reduced firm value. There is a average of value loss,
13%~15% over the 1986~1991 period among firms with any sizes. The loss is mitigated if the
diversification is in related industries. Furthermore, they conclude that if the acquirer can
have proper strategy on overinvestment and cross-subsidization, diversification can generate a
small benefit in the form of increased debt capacity and tax shield. (Berger and Ofek, 1995)
Mueller (1980) examined merger and acquisition deals in USA and six European countries in
order to find out the difference in their performance and profitability against three
benchmarks, equity, asset and sales. The research shows that acquirers grow faster than their
competitors. The main finding of this research is that there is a slight difference in returns
between the acquirer and their competitors. Mergers generate a little improvement in
performance and mergers generate small gains.
2.3.3 Clinical study
Clinical study is a inductive research method. Clinical study refers to use field interview with
industry. It focuses on small samples in great depth. Scholars can have new insights by delve
into detail and the undisclosed facts about a deal. It is good for finding new patterns. However,
there are short shortcomings with this method. The results are not representative due to the
small amount of sample and we are not able to conduct hypothesis testing. (Bruner, 2002)
Kaplan, Mitchell and Wruck (1997) examined the relationship between acquisition and
company value. They try to find out if M&A generate or destroy value. They drilled into two
merger and acquisition deals Cooper industry and Premark was individually involved and
observed the market reaction to regarding to the deals. One of the deals has incremental effect
on share value, while the other one decreases share value. They concluded that neither of the
deals creates value, as there was not enough information about the target company and the
application of inappropriate organizational designs on the target.
Chapter 3: Merger Wave Overview
The phenomenon that the merger activities burst out in a certain period is called merger wave.
This description is not precise enough to describe a merger wave, but there is no widely
accepted accurate definition or exact measurement of wave. Some researchers are focusing on
the recognition and measurement of mergers and acquisition waves. In this dissertation, we
3.1 The first wave (1983 to 1904)
This wave happened in the period of economic expansion of United States, followed with ten
years of economic stagnation. The feature of this merger wave is that most of the mergers are
horizontal mergers performed by the giant companies. They are called horizontal
consolidation at that time. The majority of merger deals are happened in steel, telephone, oil,
mining, railway and other infrastructure and transportation giants. The merger purpose during
this period was for monopoly. The publishing of the antitrust law, which is against the
monopolies, and the outbreak of World War I ended this wave.
3.2 The second wave (1919 to 1929)
The second merger wave was a result of he significant economic growth and stock market
boom. This wave was occurred in the United States as well. There is significant increase of
vertical merger in this wave. The major automobile manufacturers are created during this
period. Take Ford as an example. Ford was integrated from steel mills, railroads companies
iron and coal companies. The main merger purpose of this wave is for oligopolistic performed
by the larger companies. The stock market crash in 1929 and the Great Depression terminate
3.3 The third wave (1955 to 1969-1973)
The idea of conglomeration hold by management team of US companies led to this wave. The
size of all mergers is relatively small. Those relatively large mergers are unrelated mergers
with the idea of achieving growth through diversification. But these companies failed to
benefit from diversification under the influence of crashed conglomerate stocks. IT&T, LTV,
Teledyne and Litton were created during this period.
As UK has similar company structure, feature and regulations as the United States, its
mergers and acquisition activity history is much longer than any other European countries.
The UK M&A history started from 1960s. In this wave, it is mainly horizontal mergers and
some conglomerate mergers in the latter year, which is different from USA mergers and
acquisitions movements in the same time. This starting of M&A activities have trigged
mergers and acquisition movements in Europe in someway.
3.4 The Fourth wave (1974-1980 to 1989)
This wave is known as takeover wave. In this wave, many financial tools and techniques,
such as junk bond, hostile takeover, leverage buyouts etc., were developed. Not only
acquisitions occur in this wave, but also the divestitures. US companies acquire companies,
which can expand their advantage in competition, and get rid of those companies that would
limit their advantages. This takeover wave stems from the first hostile bid made by Morgan
wave that major investment banks make bid on their clients’ behalf. During this period, it was
the time that corporate raiders, such as Boone Pickens, uses two-tier, front-end-loaded,
boot-strap, bust-up, junk bond, hostile tender offers to acquire companies until the poison pill
was introduced in the 1980s. However, the merger and acquisition activities were still
increasing in the latter 1980s and paused for only a few months due to the stock market crash
in October 1987. Between 1989 to 1990, due to the $25 billion RJR Nabisco leverage buyout
and the junk bond market crash, along with the collapse of saving and loan bank and serious
loan portfolio and capital problems of the commercial banks, this merger wave ended. (Martin
Lipton, 2006)
UK has the same characteristic as the United States and Europe was affected by the moves of
above two countries. Companies in Europe started to use cross-border horizontal mergers to
prepare for the Common market during the latter half of 1908s. Some finding shows that
since 1984 mergers and acquisitions activities have increased by small size and volume in
Europe.
3.5 The fifth wave (1993 to 2000)
This wave was originated from USA. With the assumption that size does matter, companies
with unprecedented size were created. The high stock price performance continuously pushes
companies to conduct deals in order to maintain their competition advantages. Another main
feature is that companies have global view of competition, which motivates them to create
to compete. This led to once-unthinkable combinations, such as such as the mergers of
Citibank and Travelers, Chrysler and Daimler Benz, Exxon and Mobil, Boeing and
McDonnell Douglas, AOL and Time Warner, and Vodafone and Mannesmann. (Martin Lipton,
2006) The worldwide volume of mergers increased steadily form $342 billions of deals in
1992 to $3.3 trillion in 2000. Nine of the ten largest deals in history all took place between
1998 and 2000. Most of the deals in 1990 were strategic mergers and used stock payment.
Most of the acquirers states that they want a equal deal with the target at the beginning,
however, in fact, it turn out unequal in the end. The first quarter of 2000 started with a
record-setting $165 billion merger deal between AOL and Time Warner. However, the TMT
sector started to slow down after a five-year rapid development. At the end of first quarter of
2000, the Internet and telecom stocks started to crash due to the earning and financing
problems. The bubble burst while the merger number and volume of 2000 exceed 1999 by a
small amount. The NASDAQ index had a dramatic drop by more than 50% compared with its
peak. Most of the TMT stocks decreased by more than 50%, some even as much as 98%. The
junk bond market barely exists. Banks are stricter when doing lending screening. The market
does not welcome merger announcements. As there are 50% less merger activities in 2001
than 2000, the fifth merger wave ended
The global competition vision not only affects US companies but also European companies.
Because of increasing number of deal completed between European countries and the stability
transatlantic deals, the number and the size of the deals has increased by a huge amount in
investment has reduced. Some scholars believed the fifth merger wave is the first international
merger wave due to the rapid growing of cross-border takeover.
3.6 The sixth wave (2002 to 2010)
Martin Lipton (2006) believes that there are new merger activities as the merger and
acquisition volume has increased from $1.2 billion in 2002 to $3.4 billion by the end of 2006.
He states that the government support (e.g. France, Italy and Russia), rise in commodity
prices, low-interest financing, hedge fund and the growth of private equity funds are the most
important characteristics of this wave. As the economic environment and management
strategy is stable over this period, the number of hostile takeover, which can have immediate
acquisitions other than changing capital market structure slowly, has increased rapidly.
Chapter 4: Methodology and Data Collection
4.1 Methodology
In this study, we are planning to use event study as research method.
MacKinley (1997), we can know that there are seven key steps for a typical event study.
Firstly, before starting an event study, we need to define the event of interest the to event and
identify the event period and estimate period. This step is called event definition. Event period
generally refers to the period surrounding the announcement date. Stock prices of within this
period will be collected, including the announcement date. It is common to define the event
window to be larger than the specified period of interest and the period of interest need to be
included with in the event period so that the effect on the stock price before and after the
announcement date is taken in to account. For instance, in a merger announcement case, there
might be rumor on the market about the merger before the announcement date and one can
figure out this probability by calculating the pre-event returns. In this study, we construct the
event window as 90 days before and 30 days after the announcement date, as Brown and
Warner (1985) and MacKinley (1997) suggested. Estimation period refers to a certain period
before the event period. It is used as a normal period that shows how the stock price should
have behave without certain event. Market indexes are used as a reference in general
circumstance.
The second step is called selection criteria. After setting the event period and defining the
event, we need to choose a certain criteria for choosing our targets or samples. The criteria
may include data availability, such as listing on the National Association of Securities Dealers
Automated Quotations (NASDAQ) or the New York Stock Exchange (NYSE) or may restrict
to specified company. Moreover, it is necessary to set up some sample characteristics, such as
bias may be embedded with the sample.
Thirdly, define the normal and abnormal returns. The measure of abnormal return should be
clearly defined so that we will be able to test for the impact of an event. Extract the normal
return of the firm over the estimate window from the actual ex-post return of the security over
the event window. The normal return is the return of stock during the estimation period. For
firm X and event date T the abnormal return is
Where
ARxt is the abnormal return
Rxt is the actual return of time period t
R’xt is the normal return for estimate period
Peterson (1989) suggests that there are three types of techniques used to estimate normal
return during the estimation period.
The fourth step is estimation procedure. Normally, the event itself should not be taken into
account as it may influence the parameters of normal performance model. In this study, we
use an estimation window of 30 days ending ninety trading days prior to the first event being
examined (usually the announcement date for mergers or reference date for market inquiries).
Thus, the estimation window is (-120, -90). Note that non-trading days must be removed from
the data to avoid distorting the results, especially around the event date itself. (Lucy Beverley,
The fifth step is testing procedure. We need to define a testing framework for any abnormal
return calculated. This framework should include the definition of the null hypothesis and
techniques for adding up the results over certain period. “For example, an equally weighted or
value-weighted portfolio may be constructed to test the effect of an event on several firms. We
define the cumulative abnormal return (CAR) as the sum of the abnormal returns for each day
in the event window,” (Lucy Beverley, 2007)
The null hypothesis of the certain event is that there is no impact on the mean or variance of
returns. Therefore, the expectation of abnormal return is zero. We can draw a t-test,
Where
is the standard error of the distribution
n is the number of days in the event window
Moreover, we need to find out the whether an event study test will correctly reject the null
hypothesis, so that we are able to draw a inferences from an event study. In order to do so, we
need to examine the ‘power’ of the statistical test in question. Therefore, the significant level can be set at 1%, 5% and 10%.
The sixth step is present result and analysis
The last step is interpret results and draw conclusions. At this stage, we might need to choose
between conflicting results.
Firstly, unlike other methods, which focus on financial ratios, manager strategies and
economic gains, event study measures the value generated for investor directly. Secondly, it is
a measure of predicting the value created in the future. Because, the stock price is the present
value of future dividend
However, it has two disadvantages as well. Firstly, it has unreasonable assumptions. It
assumed that the stock market is a efficient market, in which all the information even insider
information are reflected by the stock price instantly. The investors in this market are all
rational investors and there are unrestricted arbitrage chances. These assumptions are believed
to be unnecessary for on average and over time. Secondly, in reality, there might be more than
one event happened in one day or over a certain period. Therefore, the abnormal return of the
company of certain event might be a result of a mixture of events. This can skew the returns
for sample companies at certain events. The abnormal return may not be the best measure to
reflect influence of the event solely.
4.2 Data Collection
In the study, samples we are planning to use include 100 acquisitions made by NYSE-listed
companies during the period of 1st January 2002 and 31st December 2012. This sample
includes a comprehensive set of target firm and acquirer of takeover merger and target firm
and acquirer of tender offer merger, which fit in the following criteria:
2) The acquirer firm was listed on NYSE.
3) The share price information of the acquirer and target firm is available from Chicago
Research in Security Price (CRSP) data.
4) The announcement date of the merger deal can be found on Bloomberg terminal.
5) The payment methods should be cash, stock or a combination of cash and stock.
6) The market index we used is S&P index.
We used the criteria mentioned above on Bloomberg; we take the 100 largest takeover merger
Chapter 5: Data Analysis
5.1 Takeover Acquirer
Chart 1 describes the abnormal return, cumulative abnormal return, t-value and confidence
level of the acquirer sample in a takeover deal. The event window we used in this sample is
day -20 to day 20, 41 trading days in total. The confidence level is at 95% during the vent
period. We are going to divide the event window into three periods: pre-announcement period,
event date, and post announcement period. During the post-announcement period, day -10
(ARt=0.43%, |t|=1.98) and day-6 (ARt=-0.27%, |t|=1.97) has abnormal return. The
confidence level of these days is 95% and the absolute t-value is greater than 1.96, the
hypothesis that abnormal return=0 is rejected. Therefore, there is evidence that there is
abnormal return during these days. This shows that there could be information leakage before
takeover announcement.
For the announcement date, day 0, the abnormal return is -2.07% with a absolute t-value of
3.48, which is significantly rejected the hypothesis that abnormal return is zero. During the
post-announcement period, day 2 (ARt=-0.53%, |t|=2.54), day 10 (ARt=0.19%, |t|=1.98) and
day 10 (ARt=-0.46%, |t|=2.02), this shows the hypothesis is rejected.
Chart 1: Abnormal return, cumulative return, t-value and confidence level of
Acquirers in Takeover Event Window Abnormal Return Cumulative Abnormal Return t-value Confidence level
-20 0.24% 0.24% 1.41 - -19 0.17% 0.41% 1.17 - -18 -0.11% 0.31% -0.63 - -17 -0.01% 0.30% -0.06 - -16 0.18% 0.47% 1.06 - -15 0.16% 0.63% 1.05 - -14 -0.15% 0.48% -0.78 - -13 -0.11% 0.37% -0.61 - -12 0.04% 0.41% 0.24 - -11 -0.19% 0.22% -1.1 - -10 0.43% 0.65% 1.98 95% -9 -0.01% 0.64% -0.04 - -8 0.01% 0.65% 0.07 - -7 -0.06% 0.59% -0.34 - -6 -0.27% 0.32% -1.97 95% -5 -0.16% 0.16% -0.76 - -4 -0.18% -0.02% -1.07 - -3 0.10% 0.09% 0.61 - -2 -0.06% 0.03% -0.43 - -1 0.14% 0.17% 0.91 - 0 -2.07% -1.90% -3.48 95%
1 0.50% -2.60% 1.68 - 2 -0.53% -3.11% -2.54 95% 3 0.21% -2.58% 0.97 - 4 0.20% -2.79% 0.74 - 5 0.14% -2.99% 0.69 - 6 -0.06% -3.13% -0.28 - 7 0.26% -3.07% 1.23 - 8 0.00% -3.32% 0.01 - 9 -0.07% -3.33% -0.38 - 10 -0.19% -3.26% -1.99 95% 11 -0.07% -3.07% -0.36 - 12 0.24% -3.00% 1.03 - 13 -0.03% -3.24% -0.15 - 14 0.06% -3.21% 0.32 - 15 -0.05% -3.28% -0.27 - 16 -0.46% -3.23% -2.02 95% 17 -0.01% -2.77% -0.03 - 18 -0.12% -2.76% -0.74 - 19 -0.47% -2.64% -1.99 95% 20 -0.27% -2.17% -0.89 -
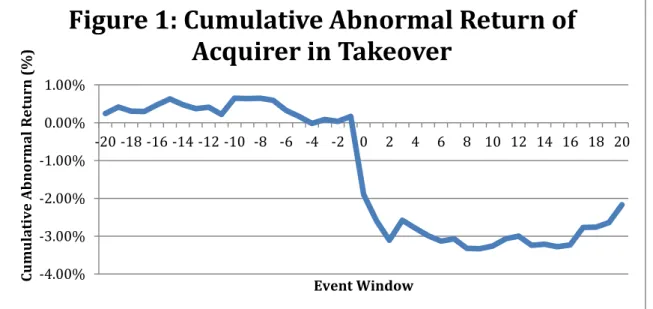
Figure 1 shows the overall trend for target firm cumulative abnormal return in a takeover deal
during the event window, day -20 to day 20. The overall trend can be divided into three
patterns. From day -20 to -1, the cumulative abnormal return is fluctuating above zero. It
started to decrease from day -7 to -1 and stays around zero. From day 0 to day 2, the
cumulative abnormal return drop dramatically to -3.11% and remained low after day 3. From
the fact that abnormal return remain above zero before announcement date and dropped below
zero after announcement we can know in a takeover deal can have a negative effect on
shareholders’ wealth of target firm.
5.2 Takeover Target
Chart 3 describes the event window, abnormal return, cumulative abnormal return, t-value and
confidence level of target firm in takeover deal. The event window is defined as day -20 to 20,
41 trading days. The confidence level is 95%. During the post-announcement period, day -19 -4.00% -3.00% -2.00% -1.00% 0.00% 1.00% -20 -18 -16 -14 -12 -10 -8 -6 -4 -2 0 2 4 6 8 10 12 14 16 18 20 C u m u la ti v e A b n o rm a l R e tu rn ( % ) Event Window
Figure 1: Cumulative Abnormal Return of
Acquirer in Takeover
(ARt=-1.22%, |t|=2.95), day -17 (ARt=-0.52%, |t|=3.55), day -16 (ARt=0.90%, |t|=3.07), day
-15 (ARt=-2.3%, |t|=3.75), day -13 (ARt=1.03%, |t|=5.39), day -11 (ARt=-0.99%, |t|=2.2), day
-10 (ARt=-1.44%, |t|=3.17) and day -4 (ARt=-1.07%, |t|=2.21) have abnormal return. And the
absolute t-value is greater than 1.96, the hypothesis is rejected, there it is significant abnormal
return before announcement date.
On the announcement date, the abnormal return is 0.06% and the t-value is 2.25, meaning that
the abnormal return is insignificant on announcement date. The hypothesis that there is no
abnormal return exists is rejected.
During the post announcement date, day 1 (ARt=-0.13%, |t|=2.92), day 4 (ARt=-0.79%,
|t|=2.95), day 16 (ARt=1.55%, |t|=2.18), day 17 (ARt=-1.5%, |t|=2.04) and day 19
(ARt=-2.34%, |t|=2.27) have abnormal return with absolute t-value greater than 1.96,
indicating that there are significant abnormal return on these days.
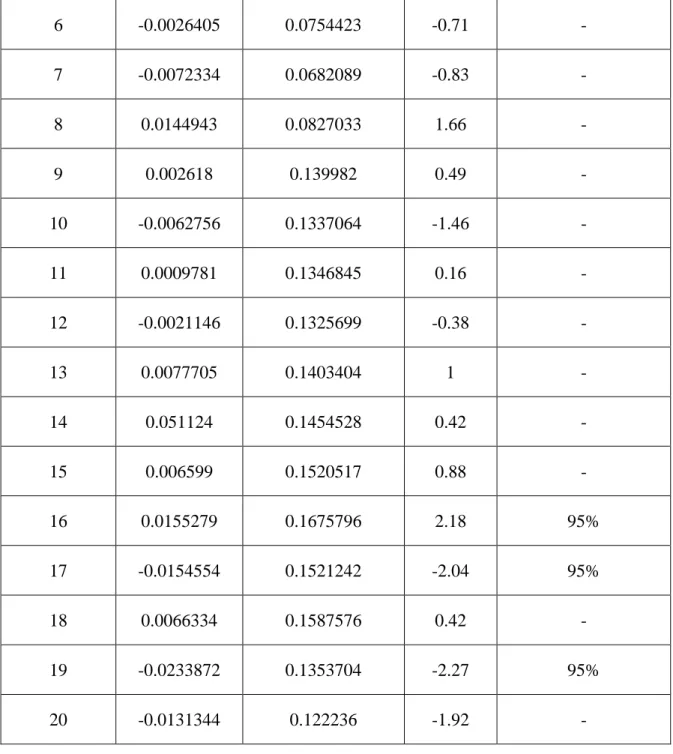
Chart 2: Abnormal return, cumulative return, t-value and confidence level of Targets
in Takeover Event Window Abnormal Return Cumulative
Abnormal Return t-Value Confidence Level
-20 -0.0050607 -0.0050607 -1.52 -
-19 -0.0121808 -0.0172415 -2.95 95%
-18 -0.0106674 -0.0279088 -1.22 -
-17 -0.0051977 -0.0331066 -3.55 95%
-15 -0.0230475 -0.0471907 -3.75 95% -14 0.0098026 -0.0373881 0.52 - -13 0.010293 -0.0270951 5.39 95% -12 0.0037666 -0.0233285 0.19 - -11 -0.0099475 -0.033276 -2.2 95% -10 -0.0144056 -0.0476816 -3.17 95% -9 0.0044587 -0.0432229 0.48 - -8 0.0089565 -0.0342664 0.54 - -7 -0.0050393 -0.0393057 -0.49 - -6 -0.0230084 -0.0623141 -1.58 - -5 0.042026 -0.0202881 1 - -4 -0.0106565 -0.0309446 -2.21 95% -3 -0.0011884 -0.032133 -0.65 - -2 -0.0095364 -0.0416694 -1.19 - -1 -0.001312 -0.0429814 -0.3 - 0 0.000587 -0.0423944 2.25 95% 1 -0.0092564 0.0808032 -2.92 - 2 -0.0008241 0.0799791 -0.26 - 3 -0.0006663 0.0793128 -0.1 - 4 -0.007867 0.0714458 -2.95 95% 5 0.0066371 0.0780829 0.73 -
6 -0.0026405 0.0754423 -0.71 - 7 -0.0072334 0.0682089 -0.83 - 8 0.0144943 0.0827033 1.66 - 9 0.002618 0.139982 0.49 - 10 -0.0062756 0.1337064 -1.46 - 11 0.0009781 0.1346845 0.16 - 12 -0.0021146 0.1325699 -0.38 - 13 0.0077705 0.1403404 1 - 14 0.051124 0.1454528 0.42 - 15 0.006599 0.1520517 0.88 - 16 0.0155279 0.1675796 2.18 95% 17 -0.0154554 0.1521242 -2.04 95% 18 0.0066334 0.1587576 0.42 - 19 -0.0233872 0.1353704 -2.27 95% 20 -0.0131344 0.122236 -1.92 -
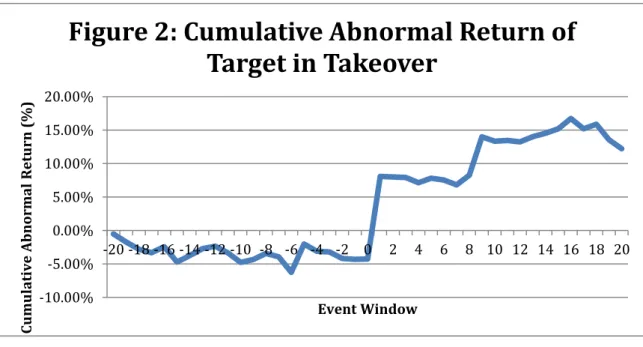
Figure 2 shows the overall trend of target’s cumulative abnormal return in takeover. The trend
can be divided into three parts. From day -20 to 0, the cumulative abnormal return is
fluctuating below zero. For the period between day 1 and day 8, the CAR increases
dramatically to 8.08% on day 1 and remain stable. From day 9 to day 20, the cumulative
obvious evidence that there is information leakage before announcement date. And the
increase in abnormal return shows that the market is in favor of the takeover.
5.3 Tender offer Acquirer
Chart 4 describes the acquirer’s daily abnormal return and cumulative average abnormal
return in a tender offer deal. The event window in the sample is -20 to 20, 41 trading days.
The confidence level of samples is mainly at 90% during the event period. During the
pre-announcement period, day -19 (ARt=0.55%, |t|=3.57), day-7 (ARt=-1.34%, |t|=2.97) and
day -5 (ARt=-0.94%, |t|=1.7) have absolute t-value greater than 1.64, therefore it is significant
that there are abnormal return on these days. Moreover, as there are abnormal returns on day
-5 and day -7 there could be information leakage before announcement date.
On the announcement date, the abnormal return is 0.6% with a critical value of 1.83,
indicating that there is abnormal return on this date. -10.00% -5.00% 0.00% 5.00% 10.00% 15.00% 20.00% -20 -18 -16 -14 -12 -10 -8 -6 -4 -2 0 2 4 6 8 10 12 14 16 18 20 C u m u la ti v e A b n o rm a l R e tu rn ( % ) Event Window
Figure 2: Cumulative Abnormal Return of
Target in Takeover
During the post announcement period, day 11 (ARt=-0.98%, |t|=1.74) and day 14 (ARt=-1.5%,
|t|=1.72), day 19 (ARt=-0.68%, |t|=1.67) and day 20 (ARt=-0.85%, |t|=2.01) has abnormal
return. As all these days have critical value greater than .164, meaning that the null hypothesis
is rejected, abnormal return exists.
Chart 3: Abnormal return, cumulative return, t-value and confidence level of Acquirers
in Tender offer
Event Window Abnormal Return
Cumulative
Abnormal
Return t-Value Confidence Level
-20 0.04% -8.79% 0.12 - -19 0.55% -7.94% 3.57 90% -18 -0.36% -7.26% -1.22 - -17 0.48% -6.85% 1.41 - -16 -0.30% -7.89% -0.83 - -15 0.08% -7.82% 0.72 - -14 -0.53% -7.05% -1.11 - -13 -0.03% -5.55% -0.07 - -12 0.00% -5.67% 0.01 - -11 -0.46% -5.42% -0.78 - -10 0.64% -4.44% 1.2 - -9 -0.16% -3.94% -0.53 -
-8 -0.35% -4.50% -0.6 - -7 -1.34% -4.19% -2.97 90% -6 -0.58% -3.85% -0.6 - -5 -0.94% -3.10% -1.7 90% -4 -0.07% -2.64% -0.19 - -3 0.15% -2.19% 0.51 - -2 0.35% -1.66% 0.89 - -1 -0.08% -1.66% -0.29 - 0 0.60% -2.33% 1.83 90% 1 -0.13% -2.93% -0.36 - 2 0.01% -2.85% 0 - 3 -0.52% -3.20% -0.87 - 4 -0.45% -3.34% -0.58 - 5 -0.46% -3.27% -1.11 - 6 -0.75% -2.33% -1.21 - 7 -0.34% -1.75% -0.77 - 8 -0.31% -0.41% -1.05 - 9 0.56% -0.05% 1.4 - 10 -0.50% 0.11% -1.33 - 11 -0.98% -0.53% -1.74 90% 12 -0.25% -0.07% -0.65 -
13 0.12% -0.08% 0.28 - 14 -1.50% -0.05% -1.72 90% 15 -0.77% 0.48% -0.71 - 16 -0.07% 0.40% -0.15 - 17 1.05% 0.71% 0.88 - 18 -0.41% 0.23% -0.7 - 19 -0.68% 0.58% -1.67 90% 20 -0.85% 0.04% -2.01 90%
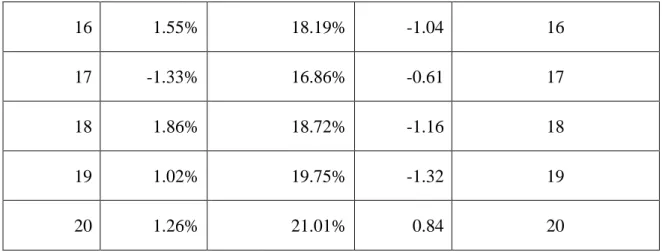
5.4 Tender off Target
Chart 4 describes the target daily abnormal return and cumulative average abnormal return in
a tender offer deal. The event window in the sample is -20 to 20, 41 trading days. The -10.00% -8.00% -6.00% -4.00% -2.00% 0.00% 2.00% -20 -18 -16 -14 -12 -10 -8 -6 -4 -2 0 2 4 6 8 10 12 14 16 18 20 C u m u la ti v e A b n o rm a l R e tu rn ( % ) Event Window