VAT notches
WP 15/06
May 2015
Working paper series | 2015
Li Liu
University of Oxford
Ben Lockwood
VAT Notches
Li Liu and Ben Lockwood
yFirst version: 22 August, 2014
This version: 11 May, 2015
Abstract
We develop a conceptual framework which captures the e¤ect of the VAT system on pro…t by two e¤ective taxes. This allows (i) predictions of the determinants of vol-untary registration and bunching at the registration threshold; (ii) develops a formula for estimating the elasticity of value-added with respect to the statutory tax. We show that the marginal excess burden of the tax on suppliers is measured by this elasticity, extending Feldstein’s analysis of the elasticity of taxable income to an indirect tax setting. We bring the theory to the data, using linked administrative VAT and corpor-ation tax records in the UK from 2004-2009. Consistently with the theory, voluntary registration is positively related to the intensity of input use and negatively related to the share of B2C transactions. There is bunching at the VAT threshold, and the amount of bunching is negatively related to the intensity of input use and positively re-lated to the share of B2C transactions, again consistently with the theory. We provide an estimate of the elasticity of the VAT tax base in the range of 0.09 and 0.18.
We thank the sta¤ at Her Majesty’s Revenue & Customs’(HMRC) Datalab for access to the data and their support of this project. This work contains statistical data from HMRC which is Crown Copyright. The research datasets used may not exactly reproduce HMRC aggregates. The use of HMRC statistical data in this work does not imply the endorsement of HMRC in relation to the interpretation or analysis of the information. All results have been screened by HMRC to ensure con…dentiality is not breached.
yLiu: Centre for Business Taxation, University of Oxford ([email protected]). Lockwood: CBT, CEPR
and Department of Economics, University of Warwick ([email protected]). We would like to thank Steve Bond, Michael Devereux, Judith Freedman, Chris Heady, James R. Hines, Louis Kaplow, Henrik Kleven, Tuomas Matikka, Joel Slemrod, and seminar participants at the 2014 International Institute of Public Finance (IIPF) Meeting, 2014 CEPR Public Economics Annual Symposium, Oxford-Michigan Tax Systems Conference, HM Treasury, Oxford University Centre for Business Taxation and University of Exeter
1
Introduction
Most countries around the world use the value-added tax (VAT) as their primary indirect tax, and most countries have thresholds, usually based on turnover, below which businesses
do not need to register for VAT.1 As VAT rates are often quite high (in excess of 20% in
many EU countries), this creates a large and salient tax notch for small businesses whose
turnover is around the threshold.2 So far, the e¤ect of these VAT notches has not been
analyzed in the literature.3
A recent literature on income tax notches (Kleven and Waseem (2013)), and transactions tax notches in the housing market (Best and Kleven (2013) and Kopczuk and Munroe (2014)) emphasize that if individuals behave fully rationally, notches give rise to bunching below the threshold, and “holes” above the threshold where maximizing agents will not locate. These papers use bunching at notches to estimate both the elasticity of labor supply, and the degree of optimization friction.
However, the conceptual framework developed in these papers is not directly applicable
to VAT, for several reasons. First, with VAT, unlike the personal income tax, the e¤ective
rate of VAT paid on the marginal unit of value-added is determined not just by the tax
code, but also by other …rm characteristics.4 First, even …rms not registered for VAT pay
a positive e¤ective VAT rate, because they cannot recover tax paid on intermediate inputs. Second, if a …rm registered for VAT sells to another registered …rm, it will automatically simply pass on any change in the VAT charged on its outputs, because the buyer can claim the output VAT back. So, …rms that have mostly business-to-business (B2B) sales have a
lower e¤ective tax.5
Both these characteristics clearly di¤er widely across small …rms that are close to the registration threshold. For example, a small tradesperson such as a plumber or electrician may typically have mostly “B2C” sales of his services to householders, and make relatively light use of intermediate inputs. So, they would face a low e¤ective VAT rate when not registered, but a high rate when registered. Conversely, a small specialist engineering …rm, such as a car component …rm, may make mostly “B2B”sales with heavy use of intermediate
1In the EU, all but two countries (Spain and Sweden) currently have positive thresholds, with the UK
threshold being the largest at £ 81,000. The thresholds in the EU are generally low compared with those in countries that have more recently introduced a VAT, such as Singapore, which currently has a threshold of about 540,000 Euro (retrieved from http://www.vatlive.com).
2A notch arises when the tax liability changes discontinuously.
3See Slemrod (2010) for a general discussion of tax notches; the VAT registration threshold is an example
of a quantity notch, in his terminology, which is relatively rare.
4In this respect, it is like the corporate tax, where it is well-known that the e¤ective marginal and average
rates of tax depend on the characteristics of the investments …rms make.
inputs, and so will be in the reverse position.
Second, these di¤erent characteristics give rise to the important feature of voluntary
registration, where a …rm registers for VAT even if it is below the turnover threshold, and
thus not required to do so. This occurs when a …rm has large purchases of intermediate inputs, and/or they can pass most of VAT on output onto the purchaser, as in the case of
the car component …rm; then, it may be pro…table tovoluntarily register for VAT so they can
claim back input tax. In our data-set, over 44% of companies in the UK with turnover below the threshold register voluntarily. Voluntary registration makes the VAT unique amongst all major taxes and thus is worthy of investigation.
In this paper, we …rst develop a conceptual framework for studying the two key aspects of behavioral response to VAT including voluntary registration and bunching. This framework is designed to be comparable to the framework …rst developed by Saez (2010) to study bunching at tax kinks, while capturing the distinctive features of VAT just mentioned. We consider a number of …rms producing a homogenous product from a purchased input and the labor or managerial input of the …rm’s owner. These …rms can vary in e¢ ciency (the basic source of heterogeneity that is the analog of labor productivity in Saez (2010)), and also in the intensity with which they use the input, and the proportion of sales to non-VAT registered consumers, i.e. so-called B2C sales.
We show …rst in this setting that the e¤ect of the VAT system on pro…t can be captured by a su¢ cient statistic, which we call the e¤ective VAT rate, which combines the e¤ects of both input and output VAT; this rate will be di¤erent for registered and non-registered …rms. We then show that voluntary registration is more likely when either (i) the cost of inputs
relative to sales is high, or (ii) when the proportion of B2C sales is low.6 The intuition for
(ii) is simply that if most customers are VAT-registered, the burden of an increase VAT can easily be passed on in the form of a higher price, because the customer himself can claim back the increase. The intuition for (i) is that when input costs are important, registration allows the …rm to claim back a considerable amount of input VAT.
Second, we show that the determinants of bunching at the registration threshold are the same as for voluntary registration, with the signs of the e¤ects reversed. Speci…cally, bunching is more likely when (i) the cost of inputs relative to sales is low, or (ii) when the proportion of B2C sales is high. We also show that the elasticity of value-added of registered …rms with respect to the e¤ective VAT rate can be recovered from an implicit function that relates the degree of bunching to the elasticity of value-added, a formula very similar to that of Kleven and Waseem (2013).
related in a simple way to the deadweight loss of a small increase in the statutory rate of VAT, thus extending the well-known results of Feldstein (1999) and Chetty (2009) to an indirect tax setting. To do this, we must assume that demand for the product is perfectly elastic, so that the deadweight loss is measuring the loss of producer surplus in excess of tax revenue raised. This assumption of perfectly elastic product demand is no stronger conceptually than the assumption of a …xed wage, i.e. perfectly elastic labor demand made implicitly by Feldstein and Chetty.
We then bring these predictions to an administrative data-set created by linking the population of corporation and VAT tax records in the UK. We …rst show that the pattern of voluntary registration in the data is consistent with the theory. In particular, voluntary registration is more likely with a low share of B2C sales or a high share of input costs. Quantitatively, the probability that a …rm voluntarily registers for VAT is increased by 0.05 for a one standard deviation increase in the share of B2C sales and by 0.02-0.05 for a one standard deviation increase in the input cost ratio. The results are robust to use of either a linear probability model or …xed-e¤ects logit model, and to the inclusion of additional …rm-level control variables.
We then look at bunching. In the aggregate, there is clear evidence of bunching at the VAT threshold. This is the …rst evidence, to our knowledge, that a VAT notch leads to bunching. Investigating further, we …nd that …rms are more likely to bunch at the threshold when either (i) the cost of inputs relative to sales is high, or (ii) when the proportion of B2C sales is low, consistently with the theory. So, there is a clear pattern of heterogeneity in bunching.
The next question is how it is that …rms bunch; that is, what are the mechanism(s) at
work? One possibility is that they genuinely restrict their sales to stay below the threshold. If so, the distribution of input-cost ratio should be smooth around the VAT notch. We provide some suggestive evidence that part of bunching is driven by under-reporting of sales. Speci…cally, we …nd that the salary-inclusive input cost ratio moves in the parallel direction between the registered and non-registered group outside the bunching region but starts to increase substantially for the non-registered companies just below the threshold. We interpret the large and sharp increase in the salary-inclusive input cost ratio to be partly driven by the fact that it is costly to underreport salary expenses due to third-party reporting.
Finally, we address the issue of the elasticity of value-added with respect to the tax. Our approach gives an elasticity estimate of between 0.09 and 0.18, depending on what is assumed about VAT registration costs. However, as further explained in Section 9, this estimate is subject to several biases that work on opposite directions, and should be regarded with some caution.
The rest of the paper proceeds as follows. In the next section, we review related literature. In section 3, we develop the conceptual framework to analyze VAT bunching and voluntary registration. Sections 4 and 5 present the main empirical predictions, and results on welfare, respectively. In section 6 we provide an overview of the VAT system in the UK and describe the data. Sections 7 and 8 present the empirical analysis for voluntary registration and VAT bunching, respectively. Section 9 estimates the elasticity of the tax base, and section 10 concludes.
2
Related Literature
Our work contributes to several strands of literature. First, our work relates to the literature on the e¤ect of tax and regulatory thresholds, and in particular, the e¤ect of VAT thresholds on small business behavior. The literature on VAT thresholds is small. In an important paper, Keen and Mintz (2004) were the …rst to set up a model of VAT including a threshold; they show that there will be bunching below the threshold, and a “hole”above, where …rms
do not locate. However, there are a number of di¤erences between their approach and ours.7
First, their model is set up in such a way that none of the burden of output VAT can be passed on to purchasers (all sales are to …nal consumers) so it is never optimal for the …rm to voluntarily register. Given the large amount of voluntary registration that we observe in the data, clearly, this is a limitation of their model.
Second, their main focus is on the optimal registration threshold, whereas our welfare analysis concerns the marginal deadweight loss of an increase in the statutory rate of VAT, following the literature on the elasticity of taxable income. Kanbur and Keen (2014) extend the Keen and Mintz (2004) framework to allow for evasion, as well as avoidance, of VAT. In our baseline model, we do not allow for evasion; the implications of doing so are discussed in Section 2.3. Brashares et al. (2014) use a calibrated formula from Keen and Mintz (2004) to infer that for a 10 percent VAT rate, the optimal level for the threshold in the United States is $200,000.
Onji (2009) documents the e¤ects of the VAT threshold in Japan, focusing on the incent-ives for a large …rm to split by separately incorporating. A comparison of the corporate size distributions before and after the VAT introduction of 1989 shows a clustering of corporations just below the threshold. More broadly, there is a small literature on …rm bunching below non-VAT thresholds to avoid burdensome taxes and regulation; for example, in Spain, …rms with turnover above a 6 million Euro threshold face increased tax enforcement; Almunia
and Lopez Rodriguez (2014) show that …rms bunch below this threshold to avoid increased scrutiny of their tax returns.
Our work also contributes to the literature on the elasticity of the VAT base. There are a small number of relevant contributions here. First, a number of studies (Carbonnier (2007) for France, Kosonen (2013) and Kosonen and Harju (2013) for Finland) exploit large cuts in the rate of VAT on speci…c categories of goods (e.g. restaurant meals and haircuts in Finland) to estimate the percentage of the VAT cut passed on to consumers in the form of lower prices. The general …nding is that there is less than full tax through, with pass-through ranging from 80% to as low as 20%. We do not have price data and do not study pass-through; rather, we look directly at the elasticity of the tax base. But, pass-through is generally less than 100% in our model, because we allow for an upward-sloping marginal cost curve for the …rm.
Second, there are a very few studies that estimate the e¤ects of VAT cuts on quantities as well as prices, and thus on the VAT base. The two studies for Finland estimate the quantity responses to be very small, but do not quantify the overall e¤ect of the VAT cuts on the VAT base. Blundell (2009) forecasts that the elasticity of tax base with respect to a temporary cut in the standard rate of VAT in the UK from 17.5% to 15% between 1
December 2008 and 1 January 2010 to be between 0.25 and 1.8 This is a forward-looking
estimate, i.e. a prediction of the elasticity by assuming cost pass-though of between 75 and 100% and an inter-temporal elasticity of substitution in consumption of 0.5 to 1, rather than being estimated from past observed behavior. Our estimates of the elasticity of the tax base are closer to the Finnish studies than the Blundell estimate; one possible reason for this is that the structural approach gives a long-run elasticity that should be interpreted as the response to a permanent VAT change, whereas the Blundell calculation is for a temporary change, where the elasticity will of course be higher, due to inter-temporal substitution in consumption.
3
Conceptual Framework
3.1
The Set-Up
We consider a single industry with a …xed, large number of small traders producing a
ho-mogenous good, indexed by productivity parameter a2 [a; a]: Small trader a combines his
8Blundell (2009) claims that in the UK, between 75-100% of the VAT cut would be passed on to the
consumer, and based on the elasticity of inter-temporal substitution, the elasticity of real consumption with respect to the VAT cut would be 0.5-1.0. This gives an overall elasticity of the tax base of between 0.25 and 1.
own labor input l with an intermediate input x to produce outputy via a …xed coe¢ cients technology y=aminnl; x a o ; (1)
wherea measures the productivity of the trader and the input requirement. In particular,
for all traders, one unit of output requires units of input: Let t be the rate of VAT. If the
trader is registered, he can claim back VAT on the input use x; so the price of the input is
r: If not registered, the price of the input is r(1 +t):
There are also two types of buyers, those who are not registered for VAT (consumers)
and those who are (businesses) in proportions and 1 respectively. It is assumed both
types of buyers have perfectly elastic demand for the good at pricep:This is analogous to the
assumption made in the taxable income literature that the wage is …xed, i.e. labor demand is perfectly elastic at a …xed wage.
So, the pro…t for the non-registered trader is
(p r(1 +t))y: (2)
For the registered trader, we reason as follows. The registered trader must charge VAT on his output. If he sells to a registered buyer, all the VAT can be passed on, as the buyer can
reclaim it. So, revenue per unit sold to a registered buyer is p: On the other hand, none of
the output VAT can be passed on to the non-registered buyer, as he has perfectly elastic
demand. So, revenue per unit sold to a non-registered buyer is p=(1 +t): So, overall, the
pro…t for the registered trader is
p
1 +t + 1 r y: (3)
Following Saez (2010) and Kleven and Waseem (2013), we assume that the trader has
an iso-elastic disutility of labor 1+11
e
l1+1=e. So, using (2) and (3), and recalling that l =y=a
from the production function (1), the utility for the registered and non-registered trader of
productivitya respectively can be written as
uR(y;a) = py 1 +t + 1 s) 1 1 + 1e y a 1+1=e ; uN(y;a) = py(1 (1 +t)s)) 1 1 + 1e y a 1+1=e ;
the value of sales.
The VAT has a registration threshold; a …rm must register if sales exceed y ; but a …rm
can register below this threshold if it wishes. If a …rm chooses to register while producing
y < y ; we say that it isvoluntarily registered.
Finally, we cannot ignore the fact that there are signi…cant compliance costs to VAT registration. It is well known that these costs, as a fraction of turnover, decline rapidly with turnover; for example, a recent literature review found that at the registration threshold, these costs were around 1.5% of turnover, declining to 0.1% or less for large companies
(Federation of Small Businesses, 2010). We model these as a …xed cost K >0; so that net
utility with registration is uR(y;a) K:
3.2
E¤ective VAT Rates
Note thatuR; uN can be written
uR(y;a) = y(1 s)(1 tR) 1 1 + 1e y a 1+1=e ; (4) uN(y;a) = y(1 s)(1 tN) 1 1 + 1e y a 1+1=e ; tR = t (1 +t)(1 s); tN = st 1 s: (5)
That is, revenue net of input costs, y(1 s); or value-added, is taxed at e¤ective rate tR if
registered, andtN if not. Note that tR is increasing in the B2C ratio, ;and increasing in s;
whereastN is increasing ins: Obviously, both e¤ective rates are increasing in the statutory
rate, t.
Whether we have voluntary registration or bunching, or neither, is driven by the
rela-tionship oftRtotN:It may seem implausible that we can havetN larger thantRin practice.
However, as we will show below, given the values of s and in our data, almost half the
sample face this con…guration of e¤ective taxes.
To interpret e, note …rst that from (4), the output that maximizes uR(y;a) is
yR(a) =a1+e((1 s)(1 tR))e; (6)
and also from (5), the output that maximizes uN(y;a)subject to the registration constraint
y y is minfyR(a); y g; where
Thus,emeasures the elasticity of output supply with respect to the e¤ective taxes. Note also
that the value-added of the trader is simply v = y(1 s); so e also measures the elasticity
of the individual trader’s value-added with respect to the e¤ective taxes.
3.3
Discussion
One possible objection is that our analytical framework might seem very special; …rms sell a homogenous product, and there is no substitution between inputs and the managerial labor input. We have two responses to this. First, both of these assumptions can be relaxed at the
cost of some more analytical complexity. In a not-for-publication Appendix, 9 we present a
version of our model with di¤erentiated products and a more general production function; then, it can be shown that the impact of the VAT system on the pro…t of the trader can no longer be measured just by an e¤ective tax rate, but by a parameter that we call the
discouragement index, which is itself a function of t; s;and as here, but also of the
…rm-level elasticity of demand, and the elasticity of substitution between labor and the produced inputs. Many of the qualitative results extend to this case.
Second, while our model has some special features, it can be argued that it is in fact more general than the Saez (2010) framework, also used by Kleven and Waseem (2013), used to study the personal income tax, where a worker with utility linear in consumption and iso-elastic labor supply faces a …xed pre-tax wage and a kinked or notched income tax schedule. In the Saez/Kleven-Waseem set-up, because the worker takes his pre-tax wage as given, he bears the full burden of the tax. In our setting, this corresponds to the assumption
that no customer can reclaim VAT ( = 1); then, the trader bears the full burden of VAT.
Moreover, in a labor supply setting, there is no input tax; in our setting, this corresponds
to the case where s = 0. Finally, we also have a compliance cost of registration, K; in the
Saez/Kleven-Waseem set-up, there are no compliance costs of moving over a tax notch, but
there is a “pure notch”or lump-sum change in the tax liability, T in their notation, which
plays the same role. So, under the assumptions that = 1 and s = 0, our model reduces
mathematically to the Kleven-Waseem model.10
A further point is that it has been argued that amount of output exported is a determinant of registration, because in practice, exports are exempt from VAT, and so …rms that export more of their output are more likely to register (Brashares et al., 2014). Note that our model covers this case, because exports can be thought of as “B2B” sales. This is because in the case of exports, the supplier does not bear any of the burden of the output VAT, and so from
the supplier’s point of view, domestic B2B sales and exports are equivalent in this respect.
A limitation of our model is that we do not allow for evasion.11 Estimated evasion of the
VAT in the UK is currently around 11% of potential revenues (HM Revenue and Customs, 2015). Following Chetty (2009), one way to incorporate an evasion option would be to say
that a …rm with real turnover y can hide an amount h of turnover at cost g(h); where g(:)
is increasing and convex. It is then easy to show that with an evasion option, there will be more bunching at the notch than without. This in turn implies that some of the observed bunching will be due to evasion, rather than the underlying elasticity of output supply, so
that using bunching to infere;as we do below, will tend to over-estimatee:However, without
knowing something about the cost of evasion function, we cannot correct our estimates of e
for this factor.12
4
The Registration Decision
4.1
The Cut-O¤
Recall that the VAT has a registration threshold at y ; but a …rm can register below this
threshold, and that there is also a compliance cost K of registering. The payo¤ from
regis-tration is thus uR(a); where uR(a) uR(yR(a);a) K; and the payo¤ from not registering
isuN(a) uN(minfyR(a); y g;a):Then, the net gain to registering is (a) = uR(a) uN(a);
so a …rm will register i¤ (a) 0:We …rst provide a basic characterization of the registration
decision.
Proposition 1. Given …xed values for the other parameters, there is a critical ~a such that all …rms witha a~ register for VAT and all a <a~do not.
The intuition is the following. First, the higher a, the higher is optimal output, and so
the …xed cost of registration is less important in overall revenue. Second, the cost of meeting
the registration turnover constraint y y is higher, the higher is a:
4.2
Voluntary Registration
The …rst aspect of the registration decision that we are interested in is voluntary registration.
Recall that a …rmachoosesvoluntary registration if it chooses to register, and has a turnover
11The e¤ects of an evasion or non-compliance option at tax notches are also discussed in Kanbur and
Keen (2014), and where two forms of evasion are studied, total avoidance (bounders), and avoidance of some fraction of the tax (cads).
below the threshold i.e. yR(a)< y . Our empirical predictions concern the share of the …rms
who produce below the threshold who register voluntarily.
Let aR be the …rm type which, if registered, just wants to produce at the registration
threshold i.e. from (6), aR = ((1 s)(1y tR))e
1=(1+e)
: From Proposition 1, ifa < a~ R; all …rms
between~a andaRregister voluntarily; otherwise, none do. So, recalling thata is distributed
uniformly, the share of …rms producing less thany which are registered voluntarily is
v = max aR ~a
aR
;0 (8)
Now we have:
Proposition 2. (i) There is a summary statistic of the parameters,
= (1 tR)
1+e (1 t
N)1+e
(1 tR)e
;
such that v >0 i¤ > K(1+y e) = 0;and v is strictly increasing in if > 0 i.e. tN must
be su¢ ciently larger than tR. (ii) The share of voluntary registrations v is decreasing in
the B2C ratio : (iii) There is a critical value 1dtN
1 tR <1 above which the share of voluntary registrations, v;is increasing in the share of input costs in turnover s:
The intuition for this is as follows. When tN is su¢ ciently above tR; even a …rm will
a relatively low productivity a will be willing to pay the …xed cost of registration to take
advantage of the lower tax rate with registration. But, when tN is just above above tR,
i.e. where 0 0 the critical cuto¤ is ~a = aR; all …rms with a < a~ will be
non-registered and produce below the threshold, and all …rms with a > a~ will produce at level
a1+e((1 s)(1 t
R))e strictly greater than y : So, for this parameter range, there is no
voluntary registration (but no bunching, either). This in fact implies that when tN is just
above abovetR; there will be a hole above the threshold.13
4.3
Bunching
Now consider that group of …rms for which ; s are such that voluntary registration is not
optimal i.e. for which tR > tN. Note that this group has the full range of productivity a.
In this case, it is easy to show that there is bunching at the cuto¤. In particular, let a be
…rms between a and ~a will produce at the threshold, with any …rm a < a <~a restricting
its output to avoid paying the registration cost and the higher e¤ective tax. So, now, a~ is
the …rm that is just indi¤erent between holding its output at y to avoid registration, and
incurring the costs of registration. So, ~a must be de…ned by the condition
max y y(1 s)(1 tR) 1 1 + 1e y ~ a 1+1=e K =y (1 s)(1 tN) 1 1 + 1e y ~ a 1+1=e : (9)
Now de…ne a ~a a ; so that ~a a + a . So, all …rms located between a and
a + a in the productivity distribution bunch at the threshold. However, we do not observe
a directly, only y, so we need to map the bunching interval into the space of turnover. To
do this, note that in the absence of bunching, the critical …rma + a would have turnover
y + y = (a + a )((1 s)(1 tR))e:So, the percentage turnover response to the notch
is measured by y =y : Then we can show:
Proposition 3. Givene; the level of bunching y is given by the implicit relationship
1 (1 + y =y ) 1 + K=y (1 s)(1 tN) 1 1 + 1=e 1 1 + y =y 1+1=e 1 tR 1 tN 1+e 1 1 +e= 0: (10) Note that (10) is very closely related to the Kleven-Waseem formula relating bunching at
a notch of the personal income tax schedule to the elasticity of the labor supplye;the latter
is given by equation (5) in their paper, which, in our notation, is
1 (1 + y =y ) 1 + T =y 1 1 1 + 1=e 1 1 + y =y 1+1=e 1 1 1+e 1 1 +e = 0; (11)
where is the initial rate of income tax, and T; are the notches i.e. when pre-tax income
goes abovey ;a …xed penalty T is paid, and thenall income is taxed at rate + :There
are two di¤erences between(10)and(11). First, with the VAT, the compliance cost,K takes
the place of T: Second, tN; tR replace ; + :
We can now use (10) to look at some of the determinants of bunching. It turns out that
the su¢ cient statistic helps determine bunching, as well as voluntary registrations. We
have:
Proposition 4. (i) If tR tN; there is strictly positive bunching, y =y > 0: (ii) If
tR < tN;there is positive bunching as long as 1 0
1 tN
1 tR
e
, and 0< 1 < 0;where
fraction of B2C sales increases, and (b) for K small, as the share of inputs in total cost, s,
falls.
The intuition for this is straightforward. if tR tN;any …rm contemplating registration
will face both (i) a higher e¤ective tax when registering, and (ii) a registration cost. So,
if it would prefer to produce just a bit more than y when facing tN; it will certainly wish
to bunch. This argument continues to apply even when tR < tN; until the tax advantage
outweighs the registration cost, at which point, bunching is eliminated.
4.4
Summary of Theoretical Results
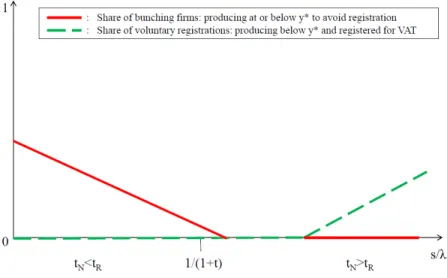
We can now summarize the theoretical results so far in …gure 1. To do this, we assume that
the su¢ cient statistic is increasing in the ratios= ;su¢ cient conditions for this to be the
case are identi…ed in Proposition 2. Figure 1 shows that there are three possible regimes, depending on parameter values.
Start in the …rst regime where tN < tR and there is bunching, but no voluntary
regis-tration. We see that as s increases, or decreases, the fraction of …rms who are bunching
decreases until we move to a second regime, where tN is close totR; but a bit larger, where
there is neither bunching nor voluntary registration. In this second regime, the critical cuto¤
is a~ = aR; all …rms with a < ~a will produce below the threshold, and all …rms with a > ~a
will produce at levela1+e((1 s)(1 tR))e strictly greater than y . This in fact implies that
there will be a hole above the threshold.14 Finally, whent
N is su¢ ciently larger than tR;we
move to the voluntary registration regime.
5
Welfare
In this section, we show how e–the elasticity of output supply with respect to the e¤ective
taxes tR; tN–can be related to the deadweight loss of the VAT. Assume that all …rms have
the same s; ; so that they only vary in a: Following Chetty (2009), our welfare criterion is
W =U+T; whereU is the average utility across all …rms i.e.
U = ~ a Z 0 uN(a)da+ a Z ~ a (uR(a) K)da
14The smallest output above the threshold isy = (a
R)1+e((1 s)(1 tR))e>(aR)1+e((1 s)(1 tN))e=
and whereT is tax revenue. The termU has the interpretation of aggregate producer surplus.
The term T has two components, the VAT charged on the sales of registered …rms, and the
VAT charged on the inputs of non-registered …rms. So, overall,
T = ts ~ a Z 0 yN(a)da+ t 1 +t a Z ~ a yR(a)da (12) = tNVN +tRVR; VN = ~ a Z 0 (1 s)yN(a)da; VR= a Z ~ a (1 s)yR(a)da
where, in the second line, we write tax revenue in a more standard way as the sum of e¤ective
ratestN; tR for non-registered and registered forms respectively, times the corresponding tax
bases i.e. value added of registered and non-registered …rms VR; VN:
As in Chetty (2009), we measure the deadweight loss of an increase in the VAT rate by
dW
dt : The …rst, and simplest, case is where there is voluntary registration, i.e. tR > tN: It is
then possible to show the following:
Proposition 5. If tR < tN; so that there is voluntary registration, then the deadweight
loss of a small tax increase is
dW dt = tN @VN @t +tR @VR @t j~aconst | {z } +@T @~a @~a @t | {z } intensive DWL extensive DWL : (13)
Moreover, the intensive DWL, as a fraction of the additional revenue raised mechanically,
@tN @t VN + @tR @t VR; can be written e N tN 1 tN + (1 N) tR 1 tR ; (14) where N = VN@tN@t @tN @t VN+ @tR @t VR
:Finally, the extensive DWL is proportional to K1=(1+e); and
van-ishes as K !0:
Formula (13) is a variant of the Feldstein-Chetty formula in for the deadweight loss of a
proportional income tax, dW
dt =t dT I
dt ; where T I is taxable income, and t is the proportional
rate of income tax. It di¤ers in two ways. First, there is also the e¤ect of the tax on welfare
via the change in registrations, measured by @T@~a@@t~a;which we call the deadweight loss at the
extensive margin, or extensive DWL:Second, in this case, there are two tax basesVN; VRand
can be written proportional to e is again analogous to the Feldstein-Chetty formula, which
can be written dWdt =T I = e1tt; where e is the elasticity of taxable income with respect to
t:
Now consider the case with tR> tN; where there is bunching. Now, the main di¤erences
are twofold. First, as all non-registered …rms between a and ~a bunch, we have:
yN(a) = ( a1+e(1 tN)e; a a (y ) 1=(1+e) (1 tN)e=(1+e) y a < a ~a : (15)
Second, the formula fora~is now rather di¤erent. As a consequence of(15),we have a di¤erent
formula for tax revenue i.e.
T =tN(VN +VB) +tRVR; VN = a Z 0 (1 s)yN(a)da; VB = ~ a Z a (1 s)y da; (16)
and VR is as before, so VB is the value-added of the bunchers. Note also (i) for a …xed a ;~a;
VB does not respond to t; (ii) from (16), and the fact that by de…nition, yN(a ) = y ; the
e¤ect of a change ina on tax revenue is zero; @a@T = 0: Then, we have:
Proposition 6. If tR > tN; so that there is bunching, formula (13) continues to hold.
But now, the intensive DWL, as a fraction of the additional revenue raised mechanically,
@tN @t (VN +VB) + @tR @t VR;can be written e N tN 1 tN + R tR 1 tR (17) where N = VN@tN@t @tN @t (VN+VB)+ @tR @t VR ; R= VR@tR@t @tN @t (VN+VB)+ @tR @t VR
So, now, there are two di¤erences to Proposition 5. First, in (17) the weights ontN; tRare
slightly di¤erent. Second, from the di¤erent de…nition of ~a in (9); the detailed formula for
the extensive DWL is di¤erent, and that term does not vanish as K !0:
Note …nally that these welfare results apply only to producer surplus, or to put it another way, they characterize the marginal deadweight loss of the VAT under the assumption that output demand is perfectly elastic. This may seem restrictive, but it is conceptually no more restrictive than the assumption implicitly made by Feldstein and Chetty that labor demand is perfectly elastic.
6
Context and Data
6.1
The Value-Added Tax System in the UK
The Value-Added tax in the UK is paid by approximately 2 million registered businesses in
each …scal year.15 It is the third largest source of government revenue following income tax
and national insurance contributions. In 2011/12, VAT raised £ 98.23 billion, accounting for
21.05% of total tax revenue and 6.54% of GDP in the UK.16
VAT is levied on most goods and services provided by registered businesses in the UK, goods and some services imported from countries outside the European Union, and brought
into the UK from other EU countries.17 All businesses must register for VAT if their taxable
turnover is above a given threshold.18 The current registration threshold is £ 81,000 in
2014/15. As permitted by the EU VAT law, increases in the registration threshold should be
in line with the rate of in‡ation.19 The UK currently set the highest registration threshold
in the EU, which is perceived as a way for the government to reduce the compliance costs
of small businesses not wishing to register for VAT.20
A business pays VAT on its purchases–known as input tax, and charges VAT on the full sale price of the taxable supplies–known as output tax. Businesses can also choose to register voluntarily with a turnover below the threshold in order to recover the input taxes. The default VAT rate is the standard rate, which was 17.5% between April 1, 2004 and December 1, 2008 and was temporarily reduced to 15% before January 1, 2010. The standard rate was then reverted to 17.5% until 4 January 2011 when it was increased to 20% and has been at that rate since. A small number of goods and services are charged at a reduced rate of 5% and there are also goods and services that are charged at a zero rate or
exempt from VAT altogether.21 Neither businesses that make zero-rate or exempt supplies
15Authors’estimates based on the universe of UK VAT records between 2004/05 and 2010/11.
16See http://www.hmrc.gov.uk/stats/tax receipts/tax-receipts-and-taxpayers.pdf.
17There are complex regulations for goods and services imported from within the EU.
18VAT taxable turnover includes the value of any goods or services a business supplies within the UK,
unless they are exempt from VAT. Any supplies that would be zero-rated for VAT are included as part of the taxable turnover.
19Speci…cally, under Article 24(2)(c) of the sixth EC VAT directive (77/388/EEC 17 May 1977). These
provisions are now consolidated in the principal VAT directive (2006/112/EC); article 287 allows for States to increase the registration threshold in line with in‡ation.
20See http://www.oecd.org/tax/tax-policy/tax-database.htm#vat. Among all OECD countries, Denmark
has the lowest threshold, which requires businesses with sales of more than DKK 50,000 (GBP£ 4,308) to register. There is no VAT threshold in Mexico, Sweden, and Spain so that all businesses in these countries are required to register unless exempt otherwise.
21A reduced rate of 5% is charged on a small number of supplies under schedule 7A of theValue Added
Tax Act (VATA) 1994. Principally, they include the supply of domestic fuel and power, the installation of energy saving materials, women’s sanitary products, children’s car seats and certain types of construction work.
charge output VAT to the customers, and the key di¤erence between them is that input tax cannot be claimed against output tax on exempted supplies.
Small …rms with annual taxable turnover of up to £ 150,000 can use a simpli…ed ‡at-rate VAT scheme, which was introduced in 2002 and allows …rms to pay VAT at a single rate
on their total sales.22 The ‡at rate, which varies between 4% and 14.5% depending on the
industry, is intended to re‡ect the average VAT rate in each industry and reduce the compli-ance cost associated with keeping detailed records and calculating VAT for each transaction separately. In practice, the extent of such administrative savings is rather unclear, since …rms must keep similar records to calculate and compare their VAT liability under both the standard scheme and the ‡at-rate scheme in order to decide whether to join or leave the ‡at-rate scheme. As discussed in a 2007 Public Accounts Committee report and in Vesal (2013), the take-up rate for the ‡at-rate scheme among eligible …rms are extremely low and
most eligible …rms are registered under the standard scheme.23
There are two rules governing registration, a forward-looking rule and a backward-looking one. First, a …rm must also register for VAT if either (i) the VAT taxable turnover of the …rm may go over the threshold in the next 30 days alone, or the …rm takes over a VAT-registered business as a going concern. Second, a …rm must register for VAT if its VAT-taxable turnover for the previous 12 months was more than the threshold. Strictly speaking, our theoretical model applies to the forward-looking decision, as the model is static; that is, the …rm must register if turnover in the current year is expected to exceed the threshold. In our sample, among …rms that register for the …rst time, around 68% of them have turnover in the previous year lower than the VAT notch. This suggests that the forward-looking decision is more important.
VAT compliance in the UK has been long susceptible to fraud and avoidance. According to HMRC estimates, the VAT tax gap, which is de…ned as the di¤erence between net theor-etical tax liabilities and total VAT receipts on a timely basis, is around 10.4% of theortheor-etical VAT liability since 2010. This is considerably higher than the tax gap estimates for many other taxes in the UK except for tobacco duties and self assessment. The most recent estim-ate of the £ 11.4 billion VAT gap in 2011-12, is composed of (1) £ 0.5 –1.0 billion of MTIC
22Under the ‡at-rate sheme, …rms surrender the right to reclaim VAT on inputs. The turnover ceiling for
FRS has been increased from £ 100,000 when it was introduced in 2002 to £ 150,000 since 2003.
23In October 2007, the Public Accounts Committee published a report on new business’ tax obligations
and found that out of 705,000 eligible businesses, only 16% of …rms were registered under the ‡at-rate scheme. A more recent study Vesal (2013) also …nds that twenty six percent of eligible VAT traders gain from the ‡at-rate scheme but very few join the scheme. Both studies attribute the low takeup rate to the lack of awareness of the ‡at-rate scheme scheme.
(Missing Trader Intra-Community) fraud,24 (2) £ 1.8 billion of VAT debt,25 (3) £ 0.2 billion
due to VAT avoidance (HM Revenue and Customs, 2015).
Table 1 summarizes the source of variation in the VAT tax system that we explore in empirical analysis. As shown in column 1, there is the discrete jump in the tax rate and the overall VAT liability at the registration threshold. The registration threshold was £ 58,000 in 2004/05, has been increased annually to £ 68,000 in 2009/10, and is currently £ 81,000 since 2014/15. We analyze the excess number of …rms bunching below the threshold to estimate the elasticity of the turnover with respect to the standard rate of VAT in a structural approach. In addition, there is a temporary reduction in the main rate of VAT between December 1, 2008 and January 1, 2010, which was the main lever of a …scal stimulus package to counter the recession. As shown in column 3, the standard rate of VAT was temporarily reduced to 15 percent on 1 December 2008 and returned to 17.5 percent on 1 January 2010.
6.2
Data
We construct our dataset by linking the universe of VAT returns to the universe of corpora-tion tax records in the UK. The …rst data set provides VAT tax informacorpora-tion for businesses in di¤erent legal forms including sole traders, partnerships, and companies but only for those who are registered. To obtain information on non-VAT registered businesses, we link the VAT records to the population of corporation tax records based on a common anonymised taxpayer reference number. The linked dataset allows us to identify VAT registers and
non-registers for the population of UK companies, and contains rich information on VAT and
corporation tax for each company and year.
We further merge the linked tax dataset with two additional data sources: (1) annual company accounts from the FAME (Financial Analysis Made Easy) database for additional
…rm characteristics and accounting information26 and (2) annual sector-level statistics on
the share of sales to …nal consumers, which are derived from the O¢ ce of National Statistics (ONS) Input-Output Tables and are available at 2-digit SIC industry level. The last data
source gives us an empirical proxy for ; the share of sales that are B2C.
We take the following steps to re…ne the sample to better study the VAT registration decisions of individual companies. First, we eliminate companies which are part of a larger
24MTIC VAT fraud is an organised criminal attack on the EU VAT system in which fraudulent traders
acquire goods and services VAT free from EU Member States by charging VAT on their onward sale and disappear to avoid paying the VAT charged to the relevant tax authorities.
25VAT debt is de…ned as the di¤erence between new debts arising in the …nancial year and debt payments
plus debt adjustments made in the …nancial year.
26FAME database is published by Bureau van Dijk and contains detailed …nancial information for more
VAT group and focus only on standard-alone independent companies. This is because com-panies under common control–for example subsidiaries of a parent company–can register as a VAT group and submit only one VAT return for all companies in a VAT group.
Second, because the registration decision can be based on turnover in the previous 12 months, we drop all observations with partial-year corporation tax records. In addition, we eliminate companies that mainly engage in overseas activities based on the HMRC trade classi…cation since the taxable VAT turnover is based on sales of goods and services within
the UK. Finally, we drop companies with an e¤ective rate of VAT that is less than 10%27,
which roughly corresponds to the bottom 10% of the e¤ective output rate for all …rms that are registered for VAT. This is the main sample we use for empirical analysis.
The …nal dataset contains 1,408,517 observations for 435,688 companies between April 1, 2004 and March 30, 2010. For each company-year observation, we have information on the VAT-exclusive turnover taken from the corporate tax records, and whether it is registered
for VAT.28 We also observe a few key factors that drive …rms’ decisions about voluntary
registration, including the share of input cost relative to total turnover (input-cost ratio), the share of sales to …nal consumers (B2C sales ratio), and …rm-speci…c history of registration status.
We use three di¤erent datasets from the main sample to test related hypotheses
de-veloped in Section 4. First, we use all the …rms with turnover below the current-year VAT
registration threshold to examine the choice of voluntary registration. We say that a …rm is voluntarily registered when it has a current-year turnover below the VAT notch and has never registered before, or has current-year turnover below the VAT deregistration threshold and was registered in the previous year. In the main sample, 62.49% of …rms have a turnover below the VAT threshold, and of these, 44.12% of them are registered for VAT. So, over-all, 27.56% of …rms in the main sample of companies with turnover between £ 10,000 and £ 200,000 are voluntarily registered for VAT.
To analyze the extent of bunching below the VAT notch hypothesized in Section 4.3, we
27The e¤ective rate is calculated as the output VAT paid relative to VAT-eligible sales for registered
companies.
28Our empirical analysis is based on turnover reported in the CT600 for two reasons. The …rst is
mechan-ical: we only observe turnover liable for VAT for …rms that are registered. The second is related to salience given that …rms that are not registered for VAT are more likely to base their registration decision on the overall amount of turnover, instead of computing a separate measure of turnover that is subject to VAT. To see whether this is true, we predict (out-of-sample) the amount of turnover liable for VAT for unregistered …rms, by regressing the amount of turnover liable for VAT on the amount of total turnover and a full set of industry and year dummies. We then plot a similar histogram of turnover as in Figure 2 Panel B based on actual/predicted turnover liable for VAT for registered/unregistered …rm. Bunching below the VAT notch is still present, but much more noisy and imprecise comparing to bunching based on total turnover reported
split companies in the main sample into those for which voluntary registration is not optimal (the predicted bunching sample) and those for which voluntary registration is optimal (the registration sample). The bunching sample comprises …rms which are predicted to bunch as
they face a higher e¤ective tax when registering, i.e. tR tN; and the remainder comprise
the registration sample. From equation (5,) we de…ne the predicted bunching sample to
be …rms in industries where the average B2C ratio ( ) and input cost ratio (s) satisfy the
condition that s= < 1=(1 +t); where t is the statutory VAT rate. The bunching sample
de…ned this way is roughly one third of the main sample, and we use just this sample to
examine bunching at the registration threshold. In this way, we minimize the “noise”around
the VAT notch from …rms who are voluntarily registering.
6.3
Summary Statistics
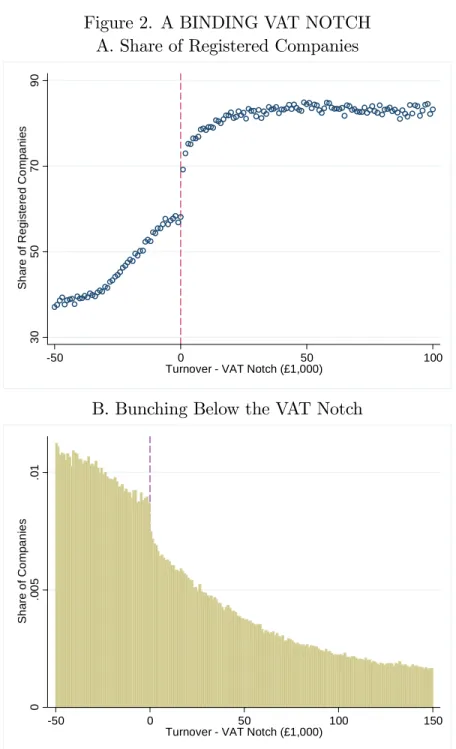
Figure 2 presents convincing evidence that the VAT registration threshold is binding in the UK. In Panel A, there is a discrete jump in the share of registered companies at the normalized VAT notch during 2004/05-2009/10, with a substantial number of voluntary registers below the threshold. On average, around 40.93% of companies with a turnover below the current-year VAT notch are registered for VAT, suggesting that for these companies the bene…ts of being registered to reclaim the input taxes may well outweigh the costs. The share of registers increases considerably to around 85% once reaching the threshold, with non-VAT registered companies above the threshold consisting of three types: (1) those providing exempt supplies, (2) those providing primarily zero-rated supplies, and (3) those with turnover temporarily exceeding the threshold. Panel B further shows a histogram of nominal turnover net of current-year VAT notch by pooling data between 2004/05 and 2009/10. That is, the VAT notch that is normalized to zero. There is an evident excess of mass just below the notch, and a small missing mass above, in the otherwise smooth distribution of turnover.
However, it is also worth noting that relative to some other studies, the excess mass below the threshold is not sharply bunched at the notch. A plausible explanation is that …rms have less control over their turnover than individuals do over their earnings for example.
Table 2 provides summary statistics for companies in the neighborhood of current-year VAT notch, which include all companies with a nominal turnover between £ 10,000 and £ 200,000 over the sample period. Column 1-3 shows the mean, standard deviation and the number of non-missing observations for the key variables used in empirical analysis. Companies in this turnover region account for around 52.94% of all companies in the linked dataset. Columns 4-6 focus on the registered companies while columns 7-9 focus on the non
registered. The last two columns test whether there is any signi…cant di¤erence between
the means of the two groups, by reporting the t statistic and the correspondingp-value in
column 9 and 10, respectively. There are a total of 745,714 observations for 267,764 unique companies in the sample, and around 62% of them are registered for VAT. On average, registered companies have a signi…cantly higher turnover and trading pro…t comparing to non-registered companies. Consistent with Propositions 2 and 4, registered companies on average have a signi…cantly higher input-cost ratio and B2C sales ratio.
7
Evidence on Voluntary Registration
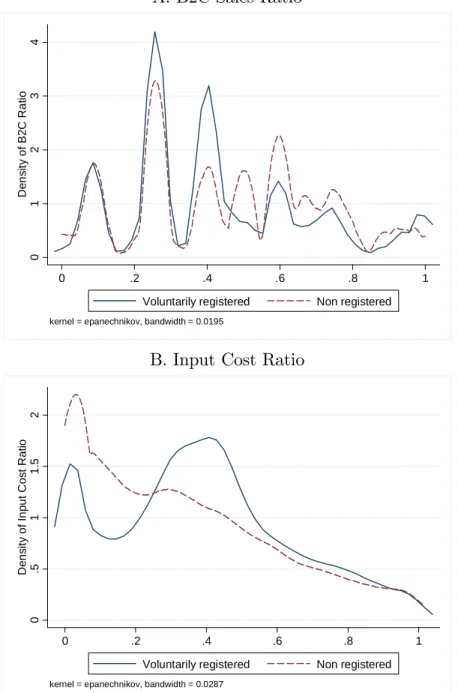
In this section, we examine whether the empirical pattern of voluntary registration is consist-ent with the theory in the two key aspects as predicted by proposition 1, i.e. whether a …rm is more likely to voluntarily register for VAT if it mainly sells to …nal consumers, and/or it has a large share of inputs in cost. We …rst note in Table 3 that voluntary registration varies with the share of B2C sales and with the share of inputs in cost in a way that is consistent with the theory. As the share of B2C sales falls, i.e. when moving from the fourth (Q4) to …rst quartile (Q1) of the distribution of B2C sales ratio, the share of voluntarily registered …rms tends to rise. Similarly, as the input cost ratio rises, the share of voluntarily registered …rms tends to increase. The empirical pattern is broadly consistent with Proposition 2. To investigate further, Figure 3 plots the distribution of the B2C sales ratio and the input cost ratio by registration status, for all …rms below the threshold. The empirical pattern is again broadly consistent with Proposition 2, as for all …rms with a turnover below the VAT notch, those who are voluntarily registered tend to have a lower B2C sales ratio and a higher input
cost ratio compared to their non-registered counterparts.29
Finally, we model the decision of voluntary registration as a function of the B2C sales ratio and the input cost ratio in a binary choice model of the following form:
Rit = 1+ 2B2Cj(i)+ 3ICRit+ 4Xit+ t+ i+ it; (18)
where Rit represents the binary voluntary registration variable which takes on the value 1
if a …rm is voluntarily registered for VAT and 0 otherwise. The key variables of interest
are B2Cj(i), the industry-level B2C ratio for …rm i (that is, …rm i in industry j(i)), and
ICRit, the input cost ratio for …rm i in year t. Also, Xit are other …rm-level controls, i
…rst estimate equation (18) in a linear probability framework based on the standard OLS assumptions. To check the robustness of the estimation results, we reestimate equation (18) in a …xed-e¤ect logit model which assumes that the error term follows a logistic distribution. The results are shown in Table 4. Columns (1)-(4) present estimation results from the linear probability model and columns (5)-(8) present estimation results from the …xed-e¤ects logit model. While the magnitude of the coe¢ cients are not directly comparable between
the two models, it is assuring that they have the same sign and similar signi…cance level.30
Column (1) and (5) do not include …rm …xed e¤ects and allow us to examine the e¤ect of industry-level B2C sales ratio on the probability of voluntary registration. The coe¢ cient estimates are negative and statistically signi…cant, indicating that the likelihood for a …rm to voluntarily register for VAT is reduced by around 0.04 given a one standard deviation increase in the B2C sales ratio.
The rest of the speci…cations add …rm …xed e¤ects and the coe¢ cient on the B2C sales ratio becomes often imprecisely estimated due to its limited variation at the industry level over time. For comparison, columns (2) and (6) do not include any additional …rm-level controls while column (3) and (7) include …rm-level trading pro…t and age as additional control variables. Columns (4) and (8) check the robustness of the results by replacing the salary-inclusive input cost ratio with the salary-exclusive input cost ratio calculated from FAME. Given that few …rms report the direct cost of sales, the sample size is dramatically decreased but nevertheless the coe¢ cient estimate for the input cost ratio remains positive and highly signi…cant. Moreover, the coe¢ cient estimate for the B2C sales ratio is negative and signi…cant at 10% level. Focusing on results in columns (3) and (4), the likelihood of voluntarily registering for VAT is increased by around 0.01-0.05 given a one standard deviation increase in the input cost ratio.
To further investigate the robustness of our results to the limited variation in the B2C
ratio roughly at the 2-digit SIC industry level, we compute the share of …rms that are
voluntarily registered in each year, and regress it against the industry-level B2C sales ratio and input cost ratio. The results are presented in Table 5 and are fairly consistent with …ndings from the …rm-level regression analysis. The coe¢ cient estimate for the B2C sales ratio is negative and highly signi…cant in the pooled regressions in columns (1)-(4) without inclusion of industry …xed e¤ects, and becomes positive and imprecisely estimated in columns (5)-(8) with inclusion of industry …xed e¤ects. Similar to results from …rm-level regressions
30Following the rule of thumb as suggested in (Wooldridge, 2001, p. 465-468), we divide the logit estimates
by four to make them roughly comparable to the LPM estimates. The scaled logit estimates are comparable to the liner probability model (LPM) estimates. We use the LPM estimates to infer the average partial e¤ects of our key variables of interest on the response probability since the …xed e¤ects logit estimator does not allow for estimation of partial e¤ects.
based on equation (18), the coe¢ cient estimate for the average input cost ratio is positive and highly signi…cant in the pooled regressions without inclusion of industry …xed e¤ects. The loss of signi…cance is due to limited variation over time in the two variables of interest at the industry level.
8
Evidence on Bunching
8.1
Estimation Methodology
As set out in the conceptual framework in Section 3, the VAT registration threshold at
the cuto¤ turnover value y will induce excess bunching at the threshold by companies for
which voluntary registration is not optimal. The bunching is driven by the productivity
parameter a, and will generate an excess mass by companies who would have reported a
turnover betweeny and y + y absent the notch of
B(y ) =
Z y + y y
g(y)d(y)'g(y) y ;
where B(y ) is the excess mass at the threshold and g(y) is the counterfactual density
distribution of turnover had there been no registration threshold. The approximation is
accurate to the extent that g(y)is uniform around the notch.
By grouping companies into small turnover bins of £ 100, we estimate the counterfactual
distribution around the VAT notch y in the following regression:
cj = q X l=0 i(yj) l + y+ X i=y iIfj =ig+"j; (19)
where cj is the number of companies in turnover bin j, yj is the distance between turnover
bin j and the VAT notch y , q is the order of the polynomial, and If g is an indicator
function. The range y ; y+ in the second term speci…es turnover bins around the notch
where bunching occurs and are therefore excluded from the regression. The lower bound of
the excluded turnover region,y , is set at the point where excess bunching starts. The upper
bound of the excluded region, y+, is estimated in an iteration procedure to ensure that the
area under the estimated counterfactual density is equal the area under the observed density. In other words, the estimation procedure ensures that the excess mass below the VAT notch
The estimated counterfactual distribution is de…ned as the predicted bin counts bcj from
(19) omitting the contribution of the dummies in the excluded region y ; y+ , and excess
bunching is estimated as the di¤erence between the observed and predicted bin counts over the excluded range that falls below the VAT notch:
b B = y X i=y (cj bcj):
We use the excess mass B(y ) and counterfactual distribution g(y) to recover the bunching
ratio b(y) = B(y ) =g(y), which denotes the fraction of companies that bunch at the notch
relative to the counterfactual density and approximates y under the assumption of no
optimization frictions. We follow this process year by year, because ultimately, we want to
calculate y as a fraction of the threshold, y ; and the threshold changes from year to
year.
In the empirical application, we observe that there is a very small hole in the observed distribution above the threshold, suggesting that many companies are not able to adjust their turnover due to optimization frictions. To examine the extent of non-response given frictions, we follow Kleven and Waseem (2013) in …rst de…ning a dominated turnover region
(y ; y + yD);where no optimizing …rm will locate, whatever the parameter values. Kleven
and Waseem (2013) show that the y solving (11) for any e2(0;1) is bounded below by
yD =
1 y : (20)
So, given the equivalencetN = ,tR= + , and (20), the dominated region in our case is
yD = tR tN 1 tR
y :
In the sample of …rms for whom registration is not optimal and are predicted to bunch
below the VAT notch, is approximately 0.824, and s= 0:548, which gives a value of yD
of 0:08y .
We then estimate the proportion of companies with large adjustment costs locating in
the strictly dominated region between y and yD relative to the counterfactual density g(y)
as:
=
Ry +4yD
y g(y)d(y)
g(y) :
Finally, we take account of the fact that some …rms who voluntarily register will be in the dominated region, even if they are fully rational. The corresponding excess bunching
accounting for optimization frictions is therefore estimated as
b
B = Bb
1 b :
We interpret estimates of Bb as an upper bound of the …rms’response to the VAT notch,
which represents the amount of bunching had all companies overcome adjustment costs. We
use this adjusted bunching estimate to evaluate the structural elasticity.31
8.2
Bunching Evidence
8.2.1 Baseline Estimates
This section presents evidence of bunching below the VAT notch using the bunching sample de…ned in section 6.2. Figure 4 presents bunching around the threshold in each …nancial year between 2004/05 and 2009/10. Panel A shows the empirical distribution of turnover (blue dots) as a histogram in £ 1,000 bins and the estimated counterfactual distribution (red line) in 2004-05. Each dot denotes the upper bound of a given bin and represents the number of companies in each turnover bin of £ 1,000. Similar to Chetty et al. (2011) and Kleven and Waseem (2013), we estimate the counterfactual distribution by …tting a ‡exible polynomial of order 3 to the empirical distribution, excluding …rms in the excluded range close to the VAT notch. The excluded turnover range is demarcated by the vertical dashed lines and the VAT
notch demarcated by the vertical solid line.32 The next …ve panels focus on subsequent years
during which the VAT notch was increased annually to track in‡ation. Each panel shows estimates of excess bunching below the VAT notch scaled by the counterfactual frequency
at the notch (b) and the share of companies in the dominated range who are unresponsive
( ) to the VAT notch.
Three main …ndings are worth noting in Figure 4. First, the VAT notch creates evident bunching below the threshold. Excess bunching ranges from 1.82 to 2.82 times the height of the counterfactual distribution, and is strongly signi…cant in each year during the sample period. Second, excess bunching tracks precisely the annual change in the nominal VAT notch due to adjustment to in‡ation. In each year the excess bunching is concentrated within £ 2,000 below the VAT. Third, in contrast with the large and sharp bunching below the threshold, the VAT notch is associated with a small hole in the distribution above the
cuto¤. The range of the hole spans from £ 8,500 to £ 15,000 above the VAT notch and b is
consistently above 0.8 during the sample period.
To examine whether bunching is primarily driven by …xed compliance cost, we separ-ately examine bunching behavior of growing and shrinking companies. Figure 5 pools all data over the sample period and presents a histogram of turnover (net of current-year VAT notch) for growing and shrinking companies in panel A and B, respectively. While there is bunching below the VAT notch in both panels, it is evident that the excess mass that we observe in Figure 2 is mainly due to behavioral responses of growing companies in panel A, with shrinking …rms responding in a much smaller extent to the VAT notch in panel B. These patterns suggest that as small …rms grow and approach the threshold, a non-trivial proportion of them slow down their growth to avoid crossing the threshold for registration, for which the saving in tax and compliance costs exceeds the reduction in sales volume.
8.2.2 Heterogeneity in Bunching
We have shown a stable distribution of turnover for …rms in the predicted sample throughout the entire period 2004/05-2009/10, with an evident and persistent bunching of companies below the VAT notch in each year. We now explore potential heterogeneity in bunching to see whether the empirical pattern is consistent with the predictions set out in Proposition 4, that …rms are more likely to bunch below the VAT notch if (1) the share of B2C sales is high, and (2) the share of input costs is low.
We explore how companies with di¤erent B2C sales ratio respond to the same VAT notch by dividing companies in each of the predicted bunching and voluntary registration samples by their medium B2C sales ratio, respectively. We then estimate annual bunching ratios separately for each subgroup.
Figure 6 plots the point estimate of the bunching ratio with the corresponding 95% con…dence intervals in each year and suggests two interesting …ndings. First, all the bunching estimates are positive and highly signi…cant, even in the lowest B2C quartile where on average between 0.3% and 25.4% of sales are B2C. Second, there is a clear pattern that the estimated bunching ratio increases with quartiles of the B2C sales ratio. In particular, the estimated bunching ratio for …rms in the top quartile is signi…cantly larger than for …rms in the bottom quartile. The observed strong aggregate bunching is mainly driven by the behavioral responses of companies in the 3rd and 4th quartile of the B2C sales ratio.
To explore how companies with di¤erent shares of direct input cost respond to the same VAT notch, we construct a …rm-speci…c measure of average input-cost ratio during the sample period and divide all companies into four groups according to the quartiles of
input-cost ratio. We obtain information on direct input-cost of sales excluding salary from company
this information, only 12.52% of companies in the estimation sample report a non-missing direct cost of sales. To increase e¢ ciency of the empirical test, we pool observations with non-missing input cost in all years and present bunching evidence with respect to the normalized VAT notch in Figure 7.
Panel A compares the empirical distributions of companies around the normalized VAT notch at four di¤erent quartiles of input-cost ratio. It presents clear evidence that the degree of bunching decreases with the share of input costs relative to output. The distribution of companies in the top quartile is quite smooth around the normalized VAT notch, while distributions of companies in the lower quartiles all exhibit some degree of bunching just below the VAT notch. Panel B further quanti…es the di¤erence in the extent of bunching by plotting the estimated bunching ratio with the corresponding 95% con…dence interval for each input-cost ratio quartile. Quantitatively, the bunching estimate is very small and insigni…cant for companies in the top quartile of the input-cost ratio distribution. For companies in the lower quartiles of the distribution, the bunching estimates are positive and highly signi…cant, with some suggestive evidence that the largest bunching occurs for companies in the second and third quartiles of the distribution.
8.2.3 Bunching via Turnover Misreporting
In this section, we provide some suggestive evidence on the extent of bunching due to turnover misreporting. When bunching is due to a decrease in real output, we expect companies to reduce their input costs in proportion, so that the distribution of input-cost ratio for non-registered companies should be smooth around the VAT notch. When bunching is due to turnover misreporting, we conjecture that the non-registered companies are less likely to under-report their input costs and wage expenses. Both costs are deductible for corporation taxes and the latter is subject to third-party reporting. In other words, the gain from under-reporting the deductible costs is considerably smaller than the gain from under under-reporting the turnover to avoid VAT registration. If the majority of companies bunch via turnover misreporting, we would expect to see a higher average input-cost ratio for the non-registered group just below the VAT notch, relative to that for the registered group.
Figure 8 pools all observations in the sample period and plots the distribution of av-erage input-cost ratio for registered and non-registered companies in £ 1,000 turnover bins, respectively. In Panel A, the input-cost ratio is salary exclusive and represents the share of direct cost of sales relative to total turnover. The solid blue line shows the average input cost relative to sales for registered companies within each turnover bin of £ 1,000 normalized
much larger input cost as indicated by their average input-cost ratio which is consistently larger than that for the non-registered companies below the VAT notch. On the other hand, there is no evident increase in the average input-cost ratio just below the VAT notch for the non-registered group. The distribution is relatively smooth and continues to increase with turnover above the VAT notch.
In comparison, Panel B plots the distribution of average input-cost ratio inclusive of
salary, for registered and non-registered companies, respectively. There is striking di¤erence between the two input-cost ratio series just below the VAT notch. The two series move in parallel directions until the average input-cost ratio for the non-registered companies starts to increase drastically just below the VAT notch. The sharp increase in the salary-inclusive cost ratio can be partly attributed to the …xed nature of salary cost which takes longer to adjust than variable costs of input. On the other hand, the sharp increase is also consistent with the fact that salary is subject to third-party reporting and thus it is more costly/di¢ cult for small businesses to underreport salary expenses. Overall, Panel A and B in …gure 8 provide suggestive yet not conclusive evidence that part of bunching is due to turnover misreporting.
9
Estimating The Elasticity
e
We have seen from section 5 that e is related to the marginal deadweight loss of the VAT
system on producers. It can also tell us something about the elasticity of the VAT base. As
remarked in section 3.2, in our framework,emeasures the response of the value-added of the
individual …rm to the e¤ective rate of VAT. Another way to see this is via (12) above. In
fact, it is helpful to think of there being two separate tax bases,VN andVR:Then, from (31)
in the Appendix, it is clear that, holding ~a …xed, the elasticity of each separate component
of the tax base VN; VR with respect to the e¤ective rate is equal to e. In particular,
1 tN VN @VN @tN = e; 1 tR VR @VR @t = e
A caveat is that e is a misestimate of the overall elasticity of the tax base for two reasons.
First, the extensive response via a change in~awill further erode the tax base whentrises, as
some …rms previously registered will choose not to register. This makes e an underestimate
of the elasticity of the tax base. Second, we have assumed a competitive market for the good with perfectly elastic demand. If demand for the good is less than perfectly elastic, so an upward shift in the supply curve will increase the equilibrium tax-inclusive price for the