The Research Committee of the Banco de España is pleased to announce the Spring 2017 issue of our Research Update. The Update aims to inform both academic and policy-oriented economists and financial specialists about publications, conferences, and other research activities at the Banco de España.
This issue includes five feature articles summarizing notable recent Banco de España projects in diverse areas of research. First, an article by Galo Nuño and Carlos Thomas outlines a new methodology for solving optimal policy problems in dynamic models with heterogeneous agents, and applies it to an example that studies the redistributive effects of monetary policy. The remaining features are empirical, documenting how the efficiency of the judicial system affects economic outcomes in Spain (Mora-Sanguinetti), which factors explain governments’ failure to follow fiscal rules (Delgado, Lledó, and Pérez), how the effects of recent unconventional monetary policies differed across European countries (Burriel and Galesi), and to what extent work experience is a substitute for formal education in helping workers accumulate skills (Jimeno, Lacuesta, Martínez-Matute, and Villanueva). In addition, this Research Update interviews Carlos Thomas, who was recently appointed to head the Monetary Policy Unit, regarding his work on labor markets, monetary policy, and banking.
This year the Banco de España will host an unusual number of conferences, reflecting several new and continuing initiatives. Starting in 2017, it will regularly organize two conferences featuring top academics from around the world: an Annual Research Conference, and a biennial Conference on Financial Stability. This year it will also host two workshops for the newly-established Research Clusters of the European System of Central Banks (ESCB). It will also collaborate on conferences with other academic and policy institutions such as the CEPR, the ADEMU network, and the World Bank.
We highlight these and other research developments at the Banco de España in hopes that they will interest the broader research community, in Spain and internationally, and thereby contribute to an improved understanding of economic policy.
Óscar Arce Ángel Estrada Juan Francisco Jimeno Jesús Saurina Research Committee, Banco de España
CONTENTS:
Features / Publications / News and Events / People / Announcements
FEATURES
OPTIMAL MONETARY POLICY WITH HETEROGENEOUS AGENTS GALO NUÑO AND CARLOS THOMAS
WORKING PAPER Nº 1624
Economic models with heterogeneous agents are increasingly used for policy analysis. We propose a novel methodology for solving dynamic optimal policy problems in models of this kind, both under discretion and commitment. We illustrate our methodology by studying optimal monetary policy in an incomplete-markets model. Under discretion, an inflationary bias arises from the central bank’s attempt to redistribute wealth towards debtor households, which have higher marginal utility of net wealth. Under commitment, this inflationary force is counteracted over time by the incentive to prevent expectations of future inflation from being priced into new bond issuances; under certain conditions, long run inflation is zero as these two effects cancel out asymptotically.
Introduction
A recent literature addresses the importance of household heterogeneity in the transmission of monetary policy.1 These Heterogeneous Agent New Keynesian (HANK) models are providing new insights about how relevant the redistributions associated with monetary policy are for understanding business cycle dynamics. A major shortcoming of this literature is that it provides few policy prescriptions, as the optimal monetary policy can only be studied under very restrictive assumptions. The difficulty of analyzing the
optimal monetary policy arises from the fact that in these models the state of the economy is described by the income-wealth distribution, a very high-dimensional object, making the traditional approaches to the optimal policy problem too complex.
In a recent working paper, Nuño and Thomas (2016), we propose a novel methodology for solving fully dynamic optimal policy problems in models with heterogeneous agents, both under discretion and commitment, in the absence of aggregate shocks. To this end we use recent continuous-time mathematical techniques related to what is now known as “mean field game theory”.2
Model
We illustrate our methods by analyzing optimal monetary policy in an incomplete-markets economy. Our framework is close to Huggett’s (1993) model: households trade non-contingent claims, subject to an exogenous borrowing limit, to smooth consumption in the face of idiosyncratic income shocks. We depart from Huggett’s framework by considering nominally non-contingent bonds with an arbitrarily long maturity. This allows monetary policy to have an effect on equilibrium allocations. In particular, as in Fisher (1933), unanticipated inflation redistributes wealth from lenders to borrowers.3 In order to have a meaningful trade-off in the choice of the inflation path, we also assume that inflation is costly. In addition, expected future inflation raises the nominal cost of new debt issuances through inflation premia. Also, we consider a small open economy, which may sell some of its (domestic currency-denominated) bonds to risk-neutral foreign investors. As a result, the redistributive channel operates not only between domestic lenders and borrowers, but also between the latter and foreign bond holders.
1 See, for instance, Auclert (2016), Doepke and Schneider
(2006b), Kaplan, Moll and Violante (2016), Gornemann, Kuester and Nakajima (2012), McKay, Nakamura and Steinsson (2015), Luetticke (2015), Meh, Ríos-Rull and Terajima (2010), Sheedy (2014), Challe et al. (2015) or Sterk and Tenreyro (2015).
2 See Lasry and Lions (2006) or Nuño and Moll (2016). 3 See Doepke and Schneider (2006a) for a study of net
nominal asset positions across US household groups which estimates the potential for inflation-led redistribution. See Auclert (2016) for a recent analysis of the Fisherian channel in a more general model that allows for additional redistributive mechanisms.
assets drift away from their current level a, s i f i
represents a flow of mass away from the neighborhood of the point (a, y i ). But (when s i > 0 ), this is offset by a flow into the neighborhood of (a, y i ) from a lower asset level a-da. Therefore, if s i f i is unchanging with a, the mass around (a, y i ) is neither increased nor decreased by savings. But if ∂a∂ (s i f i ) > 0, then savings behavior causes the mass around (a, y i ) to decrease over time (the flow away from (a, y i ) exceeds the flow into that neighborhood).
Methodology
We assume that the central bank is utilitarian, i.e. it gives the same Pareto weight to each household. Thus, it maximizes the following welfare criterion:
U CB =
∫
ϕ∞∑
v i (0,a) f i (0, a) da.We now consider both the case in which the central bank can credibly commit to a future inflation path (the Ramsey problem), and the time-consistent case in which the central bank decides optimal current inflation given the current state of the economy (the Markov Perfect equilibrium).
Discretion. In the case of discretion, the central bank cannot commit to any future policy. The inflation rate π then depends only on the current aggregate state variable, the net wealth distribution: π (t) ≡ π [ f (t, a,y)].
Notice that the inflation policy is not an ordinary function, but a functional, as it maps the infinite-dimensional state variable f (t, a, y) into ℝ. The appropriate solution concept is a Markov Perfect
Equilibrium (MPE) in a space of distributions. The
central bank maximizes aggregate welfare subject to the law of motion of the distribution, taking bond prices and individual consumption policies as given. We frame this decision as a dynamic programming problem on a suitable space of functions, and solve it using variational arguments. In particular, we employ Gateaux derivatives,
which generalize the concept of derivatives to functional spaces.
In the case of separable preferences u (c,π ) = u c(c) - u π(π), the inflation under discretion satisfies:
u π π =
∫
ϕ∞
∑
(-a) u cc f i(t,a) da.That is, at all times, optimal discretionary inflation increases with the average cross-household net liability position weightedby each household’s marginal utility
We now describe of the main model elements.
Individual states. Over a brief interval dt, a household´s real wealth a evolves as da t = s t dt , where
st = ( rt - πt ) at + yt - c t
is the drift, π is inflation, y is an exogenous output endowment (assumed to follow a 2-state Markov chain with transition probabilities λ 1 and λ 2 ), c is consumption, Q is the nominal bond price, and
r = δ / Q - δ is the nominal bond yield, where δ is the amortization rate. Domestic bonds are in positive net supply, and are priced by risk-neutral foreign investors.
Household problem. The value function of a household is defined by v ( t, a, y ) = max { c s } s = t∞ E t
∫
t ∞ e -ρ(s-t) u (c s ,π s )ds,subject to the law of motion of a. Notice that instantaneous utility depends both on consumption and inflation.4 The dynamic programming or Hamilton-Jacobi-Bellman (HJB) equation for this problem is ρv i = ∂vi + max
c
{
u ( c, π ) + s i∂v i}
+λ i[ v j - v i],for i ≠ j = 1,2, where v i ( t, a ) = v ( t, a, y i ). This HJB equation closely resembles the analogous discrete-time Bellman equation for a household that chooses between consumption and saving while facing Markovian income shocks.
Wealth distribution. The law of motion of the household wealth distribution f i (t, a) = f (t, a, y i ) is given by the so-called Kolmogorov forward (KF) equation,
∂f i
= - ∂ (s i f i ) -λ i f i + λ j f j ,
which describes how the density of households f varies over time at all points (a, y i ). The last two terms in this equation show the loss of mass around a given point
(a, y i ) as some households’ income changes from y ito
y j , offset by the gain in mass around (a, y i ) as others’ income changes from y j to y i .
The first term in the KF equation deserves more explanation. Since si is the rate at which a household’s 4 This can be micro-founded by assuming firms face sticky
by an opposing force: the central bank internalizes how investors’ expectations of future inflation affect their pricing of the long-term nominal bonds from the time the optimal commitment plan is formulated (“time zero”) onwards. At time zero, inflation is close to that under discretion, as no prior commitments exist. But from then on, the fact that the price of newly issued bonds incorporates promises about the future inflation path gives the central bank an incentive to commit to reducing inflation over time. Importantly, we show that under certain conditions on preferences the steady state inflation rate under the optimal commitment is zero; that is, in the long run the redistributive motive to inflate exactly cancels out with the incentive to reduce inflation expectations and nominal yields for an economy that is a net debtor.
Numerical analysis
We then solve numerically for the full transition path under commitment and discretion. We calibrate our model to match a number of features of a prototypical European small open economy, such as the size of gross household debt and their net international position. We find that optimal time-zero inflation, which as mentioned before is very similar under commitment and discretion, is quite high. We also show that both the cross-border and the domestic redistributive motives are quantitatively relevant for initial inflation. Under discretion, inflation remains high due to the inflationary bias discussed before (see the figure). Under commitment, by contrast, inflation falls gradually towards its long-run level (essentially zero, under our calibration), reflecting the central bank”s efforts to prevent expectations of future inflation from being priced into new bond issuances. In summary, under commitment the central bank front-loads inflation so as to transitorily redistribute existing wealth from lenders to borrowing households, but commits to gradually undo such initial inflation.
In welfare terms, the discretionary policy implies sizable losses relative to the optimal commitment. These losses are suffered by creditor households, but also by debtor ones. The reason is that, under discretion, expectations of permanent future positive inflation are fully priced into current nominal yields. This impairs the very redistributive effects of inflation that the central bank is trying to bring about, and leaves only the direct welfare costs of permanent inflation, which are borne by creditor and debtor households alike.
of net wealth. This reflects an “inflation bias”, whereby the central bank tries to use inflation so as to redistribute wealth, and hence consumption, in two ways. On one hand, inflation redistributes from foreign investors to domestic borrowers (cross-border redistribution). On the other hand, and somewhat more subtly, under market incompleteness and standard concave preferences for consumption, borrowing households have a higher marginal utility of net wealth than lenders. Hence, they receive a higher effective weight in the optimal inflation decision, giving the central bank an incentive to redistribute wealth from creditors to debtors (domestic redistribution).
Commitment. Assume now that the central bank can credibly commit at time zero to the complete future inflation path. The optimal inflation path is thus a function of the initial distribution f0(a) and of time: π (t) ≡ π [ t, f0(a)]. Under commitment, the central bank maximizes welfare taking into account not only the dynamics of wealth (the KF equation), but also the HJB equation and the bond pricing condition. That is, the central bank understands how it can steer households’ and foreign investors’ expectations by committing to an inflation path, unlike the discretionary case, where the central bank takes expectations as given. The appropriate solution concept under commitment is that of a Ramsey problem. Here, the Ramsey problem is an optimal control problem in a function space; calculating the first-order conditions again requires Gateaux derivatives.
For separable preferences, the optimal inflation under commitment satisfies u π π =
∫ϕ
∞∑
(-a) u c c f i (t,a)da + μ (t)Q(t),where the costate μ(t) captures the value to the central bank of promises about time t inflation made to foreign investors at time 0. The value is zero at the time the Ramsey plan is announced (t = 0), when the central bank is not bound by previous commitments, but it will generally be different from zero at any time t > 0. By contrast, in the MPE case no promises are made at any time, hence the absence of this costate. Therefore, the static trade-off between the welfare cost of inflation and the welfare gains from inflating away net liabilities, explained above in the MPE context, is now modified by the central bank’s need to respect past promises to investors about current inflation.
Under commitment, the same redistributive motives to inflate exist as under discretion, but they are counteracted
LUETTICKE, R. (2015). “Transmission of Monetary Policy and Heterogeneity in Household Portfolios,” mimeo.
MCKAY, A., E. NAKAMURA and J. STEINSSON (2015). “The Power of Forward Guidance Revisited”. Forthcoming in American Economic Review.
MEH, C. A., J. V. RÍOS-RULL and Y. TERAJIMA (2010). “Aggregate and welfare effects of redistribution of wealth under inflation and price-level targeting”,
Journal of Monetary Economics, 57, 637-652.
NUÑO, G. and B. MOLL (2015). “Controlling a Distribution of Heterogeneous Agents,” Banco de España Working Paper 1518.
NUÑO, G. and C. THOMAS (2016). “ Optimal Monetary Policy with Heterogeneous Agents,” Banco de España Working Paper 1624.
ROTEMBERG, J. J. (1982). “Monopolistic Price Adjustment and Aggregate Output”. Review of Economic Studies, 49(4), 517-531.
SHEEDY, K. D. (2014). “Debt and Incomplete Financial Markets: A Case for Nominal GDP Targeting,” Brookings Papers on Economic Activity, 301-373.
STERK, V., and S. TENREYRO (2015). “The Transmission of Monetary Policy through Redistributions and Durable Purchases.” mimeo.
REFERENCES
AUCLERT, A. (2016). “Monetary Policy and the Redistribution Channel”, mimeo.
CHALLE E., J. MATHERON, X. RAGOT and J. RUBIO-RAMÍREZ (2015). “Precautionary Saving and Aggregate Demand,” Working papers 535, Banque de France. DOEPKE, M. and M. SCHNEIDER (2006a). “Inflation and the Redistribution of Nominal Wealth,” Journal of Political Economy, 114(6), 1069-1097.
DOEPKE, M. and M. SCHNEIDER (2006b). “Aggregate Implications of Wealth Redistribution: The Case of Inflation”, Journal of the European Economic Association, 4(2-3), 493-502.
FISHER, I. (1933). “The Debt-Deflation Theory of Great Depressions,” Econometrica, 1(4), 337-357.
GORNEMANN, N., K. KUESTER and M. NAKAJIMA (2012). “Monetary Policy with Heterogeneous Agents”, mimeo.
HUGGETT, M. (1993). “The risk-free rate in heterogeneous-agent incomplete-insurance economies,”
Journal of Economic Dynamics and Control, 17 (5-6), 953-969.
KAPLAN, G., B. MOLL and G. VIOLANTE (2016). “Monetary Policy According to HANK,” NBER Working Paper 21897.
LASRY, J. M. and P. L. LIONS (2006). “Jeux à champ moyen I - Le cas stationnaire.” Comptes Rendus de l’Académie des Sciences,Series I, 343, 619-625.
-1 0 1 2 3 4 5 0 2 0 years years years years 1 0 INFLATION % -1 0 1 2 3 4 5 0 2 0 1 0
REAL INTEREST RATE % 59 61 63 65 67 69 0 2 0 1 0
GROSS ASSETS (CREDITORS) % 80 81 82 83 84 85 86 87 88 89 90 0 2 0 1 0 COMMITMENT DISCRETION %
ASSESSING THE IMPACT OF THE INSTITUTIONAL FRAMEWORK ON THE EFFICIENCY OF THE SPANISH ECONOMY
JUAN S. MORA-SANGUINETTI
Introduction
The economic literature has stressed the critical role played by institutions to explain differences in economic performance across nations [Hall and Jones (1999) and Helpman (2008)]. North (1990) concludes that less effective enforcement mechanisms (rather than regulation per se) were the key institutional difference between the Third World and developed countries. He argued that both contracting, and verifying compliance with contracts, is crucial for economic efficiency [Coase (1960), North (1990)]. Similarly, regarding the law, if enforcement institutions fail to function efficiently, or operate in an extortionate fashion, legal uncertainty may inhibit transactions. Indeed, there is ample empirical evidence that protection of property rights and private contracts promotes economic development (Acemoglu et al., 2001, Rodrik et al., 2004, Acemoglu and Johnson, 2005).
Likewise, many studies have shown how the efficiency of judicial systems affects specific aspects of economic performance for very different countries (Palumbo et al., 2013). For instance, Djankov et al. (2008), Bae and Goyal (2009), Qian and Strahan (2007), Jappelli et al.
(2005) and Shvets (2013) have addressed the impact of justice on the development of credit markets. Due in part to their effect on credit markets, firm size, firm growth, and even firm specialization also appear to be positively related to the efficiency of judicial systems [Laeven and Woodruff (2007), Giacomelli and Menon (2016)]. In addition, the literature highlights that judicial performance also affects the use of resources and technology (Ferguson and Formai, 2013), the structure of housing markets (Casas-Arce and Saiz, 2010), and the functioning of labour market relationships (Berger and Neugart, 2011, Ichino et al., 2003).
The quality of enforcement institutions in Spain
The efficiency of the judicial system is also an important issue for the Spanish economy. Compared with other high-income countries, the Spanish judicial system shows a relatively low level of efficacy. Evidence for this can be found either by looking directly at data sources on the performance of judicial systems such as those of the OECD (Palumbo et al., 2013) or the CEPEJ
(2014), or by analyzing estimates based on survey data (World Bank, 2015).
Moreover, the performance of the system has not shown improvements since the beginning of the 2000s, in contrast to recent advances in other areas of the Spanish economy and society. More specifically, the efficiency of the system worsened during the economic expansion, then improved in the recession (returning to initial values), largely due to a reduction in the demand for litigation (Mora-Sanguinetti, 2016).
Finally, there is substantial regional diversity in the efficacy of the judicial system. This raises the question of potential different impacts on economic efficiency in Spain at a disaggregated level. Figure 1 illustrates the geographical variation of the clearance rate (as a proxy of judicial efficacy) for a standard civil procedure for the period of expansion between 2001 and 2007, and since 2008, for the Spanish recession. From the data, we could expect that the impacts of justice on economic efficiency will vary according to the province or region. Indeed, these impacts can be measured, as Spain is one of the few countries that has quality databases to properly study how enforcement institutions affect the economy at a disaggregated level.
Judicial efficiency and economic outcomes in Spain
Several recently published studies by Banco de España economists analyze the impacts of local differences in judicial efficacy on diverse aspects of the Spanish economy, including the average size of companies, firm entry and exit rates, entrepreneurship rates, credit availability, distortions in rental and home ownership shares in the real estate market, and the behavior of Spanish local labour markets.García-Posada and Mora-Sanguinetti (2015) found that greater efficacy of the judicial system at the local level increases the growth and size of Spanish companies and also favors entry of new firms. They found no significant effect on the exit rate, however. The implied effects on firm size and growth are economically significant. If the province with the lowest judicial
efficacy (when solving a declaratory trial) improved to align with the best practice, the relative increase in the average firm size would range from 0.6 to 2.8% while annual firm growth would rise between 1.1 and 2.8 percentage points. Attributing to the province with the worst judicial efficacy the best law enforcement in the sample, the relative increase in its entry rate would range between 8.8 and 9.5%1.
If we analyze the firm entry rate by type (that is, if we differentiate across legal company types, such as limited liability –sociedades anónimas and limitadas-,
unlimited liability, and entrepreneurs), a decrease in the efficacy of justice (when solving a declaratory procedure) is only found to reduce the entry of new entrepreneurs, without a significant impact on larger firms with limited liability structures (García-Posada and Mora-Sanguinetti, 2014). If the province with the lowest judicial efficacy improved to match the efficacy of the least congested one, the increase in the rate of entry of entrepreneurs would be between 5 and 7%. This result is consistent with the idea that the lack of judicial efficacy can be considered a fixed cost to be paid by the companies that litigate and, like any fixed cost, is a proportionally larger burden for a (small) entrepreneur than for a large company.
The previous examples refer to the impacts of judicial efficacy in “declaratory” procedures. The “declaratory” stage refers to the time at which the existence of a debt or an obligation is declared and acknowledged by a judge. If the debtor decides, after all, not to fulfill the
obligation declared by the judge (for instance, choosing not to repay a loan even after the judgment), a second procedure, an “execution”, may take place. In the execution stage, the civil judge forcibly compels the debtor to pay (for example, the judge may take the money from the bank accounts of the debtor). Thus, “execution” is not always needed and therefore the importance of the different procedures varies between different studies. Judicial performance also has some specific impacts on real estate markets (Mora-Sanguinetti, 2012). Indeed, legal certainty seems relevant for the relationship between the rental and the property market, affecting the prevalence of each type of tenure. If a landlord perceives insecurity in expelling a tenant who does not pay the rent or does not comply with the conditions of the lease, he or she may decide to remove the dwelling from the rental market, increasing the share of property in the local economy. More specifically, an increase in judicial efficacy at the execution stage (in which an expulsion –lanzamiento- of the delinquent tenant takes place) is estimated to have a positive impact on the rental market (a reduction in one point of judicial congestion 2 would increase the tenancy rate by 0.15 percentage points). In other words, taking Madrid as an example, the estimates suggest that a 1 point decrease in the rate of judicial congestion would attract
1 These ranges refer to the results of the different econometric
specifications studied.
0.47 - 0.52 0.52 - 0.58 0.58 - 0.63 0.63 - 0.70 0.43 - 0.55 0.55 - 0.59 0.59 - 0.65 0.65 - 0.73
JUDICAL CLEARANCE RATES FOR ORDINARY CIVIL TRIALS, BY PROVINCE
SOURCE: Own elaboration using CGPJ data.
FIGURE 1
PANEL A: 2001-2007 PANEL B: 2008-2012
2 The judicial congestion rate (which is the inverse of the
clearance rate mentioned above) is the number of cases pending resolution plus the new cases entering the judicial system at a given point in time, divided by the number of cases that the system is able to resolve at that time. The higher the congestion rate, the lower the efficacy of the judicial system.
In addition to these analyses of judicial enforcement of private contracts (which are resolved in the civil jurisdiction), there is also research on the role of the Spanish court system in resolving conflicts in labour markets (dismissals specifically). Jimeno et al. (2015) point out that judges are “active” decision makers when interpreting the Law in a dismissal conflict in Spain, and therefore their behavior affects the ratio between legal and de facto dismissal costs (i.e. the compensation actually paid in Spain to the dismissed employee). The results indicate that judges seem to be sensitive to local market conditions (such as the unemployment rate) and not only to legal provisions. The labor market reforms of 2010 and 2012 have slightly reduced the association between the unemployment rate and the likelihood that a dismissal is declared inadmissible by a judge.
Finally, as used here, the “efficacy” of the judicial system means its ability to complete decisions on cases brought before the courts. But it is also relevant to study how the number of court cases is determined. Mora-Sanguinetti and Garoupa (2015) analysed, using instrumental variables, whether the number of lawyers in the market in Spain (which displays substantial geographical variation, as shown in Figure 2) was related to the amount of litigation, over the period 2001–2010. Their results showed that the number of lawyers had a positive effect on litigation. More specifically, a one percent increase in the number of lawyers per capita entailed an increase in litigation of around 1.4%.
Table 2 summarises the results found in some of the studies discussed above.
about 3400 dwellings to the rental market; in Barcelona, the estimated increase would be 3100 homes; and in Valencia, 1400.
Judicial performance also affects the size of credit markets. In a recent study, Mora-Sanguinetti et al.
(2016, forthcoming 2017) analyze how local differences in the availability of credit and the evolution of non-performing loans (NPL) ratios may be partially explained by regional variations in the quality of loan contract enforcement. This analysis is performed both for periods of sustained growth (2001-2007) and recession (since 2008) in the Spanish economy. The research concludes that a rise in the clearance rate of executions increases the ratio of total credit to GDP at the local level. However, the declaratory stage of the procedure does not seem to be statistically significant.
A possible explanation for this finding is that, throughout the economic cycle, a relevant proportion of the defaults that take place are strategic (i.e., defaults by a solvent debtor). Furthermore, it is observed that, in provinces where declaratory procedures are more efficient, less credit is declared as non-performing. The latter effect, however, is only observed after the onset of the “Great Recession” in 2008. A plausible explanation is that non-strategic defaults (i.e., defaults caused by the debtor’s inability to honor his debts) are much more frequent during recessions than strategic defaults, because borrowers’ cash flows and collateral values are very low. In that case, what matters is the judicial efficacy at the declaration stage, as debtors do not voluntarily default on their obligations, making the execution stage less relevant. A summary of all these results can be found in Table 1.
Expansion Recession Expansion Recession
Declaratory No significant effect No significant effect No significant effect Decrease t c e ff e t n a c i f i n g i s o N t c e ff e t n a c i f i n g i s o N e s a e r c n I e s a e r c n I n o it u c e x E s o it a r L P N y ti li b a li a v a t i d e r C TABLE 1
SOURCE: Mora-Sanguinetti et al. (2016, forthcoming 2017).
Source Estimated effect Procedure Experiment Outcome Housing rentals congestion rate Execution by 0.15 percentage points Mora-Sanguinetti (2012) Entrepreneurship practice
entrepreneurs between 5 and 7%.
Garcia-Posada and Mora-Sanguinetti (2014) Firm size Align with the best judicial
practice practice
Declaration Increase in the average
firm size would range from
0.6 to 2.8%
Garcia-Posada and Mora-Sanguinetti (2015) Firm growth Align with the best judicial
practice
Declaration Annual firm growth would rise
between 1.1 and 2.8 percentage points
Garcia-Posada and Mora-Sanguinetti (2015) Firm entry Align with the best judicial
practice
Declaration Increase in entry rate would range between 8.8 and 9.5%.
Garcia-Posada and Mora-Sanguinetti (2015) Litigiousness Increase of 1% in the number
of lawyers per capita
NA Litigation would Increase
by 1.4%
Mora-Sanguinetti and Garoupa (2015) Credit availability Increase of 1% in the judicial
clearance rate
Execution Increase by 0.32% the ratio of total credit to GDP
Mora-Sanguinetti et al. (2017)
SUMMARY OF RECENT FINDINGS TABLE 2
SOURCE: Author’s elaboration. The estimated effect ranges refer to the results of the different econometric specifications studied.
1 point reduction in the judicial
Align with the best judicial Declaration Increase in the rate of entry of Increase in the tenancy rate LESS THAN 1.59 1.59 - 1.90 1.90 - 2.34 MORE THAN 2.34
NUMBER OF LAWYERS PER THOUSAND INHABITANTS, BY PROVINCE (AVERAGE 2000-2015)
SOURCE: Author’s elaboration, using data from the census of the Consejo General de la Abogacía Española (2016).
FIGURE 2
REFERENCES
ACEMOGLU, D., S. JOHNSON and J. A. ROBINSON (2001). “The colonial origins of comparative development: an empirical investigation”, American Economic Review, 91, 1369-1401.
ACEMOGLU, D., and S. JOHNSON (2005). “Unbundling institutions”, Journal of Political Economy, 113 (5), 949-995.
BAE, K. H., and V. K. GOYAL (2009). “Creditor Rights, Enforcement, and Bank Loans”, Journal of Finance, 64 (2), 823-860.
WORLD BANK (2015). Doing Business 2016. Measuring Regulatory Quality and Efficiency, Washington, DC. BERGER, H., and M. NEUGART (2011). “Labor courts, nomination bias, and unemployment in Germany”,
European Journal of Political Economy, 27 (4),
659-673.
CASAS-ARCE, P., and A. SAIZ (2010). “Owning versus Renting: Do Courts Matter?”, Journal of Law and Economics, 53 (1), 137-165.
MORA-SANGUINETTI, J. S. (2016). “Evidencia reciente sobre los efectos económicos del funcionamiento de la justicia en España”. Boletín Económico-Banco de España 1, 33-41.
MORA-SANGUINETTI, J. S., and N. GAROUPA (2015). “Do lawyers induce litigation? Evidence from Spain, 2001-2010”, International Review of Law and Economics, 44, 29-41.
MORA-SANGUINETTI, J. S., M. MARTÍNEZ-MATUTE and M. GARCÍA-POSADA (2016). “Credit, crisis and contract enforcement: evidence from the Spanish loan market.” Working Paper 1630, Banco de España. Forthcoming (2017), European Journal of Law and Economics.
NORTH, D. C. (1990). Institutions, Institutional Change
and Economic Performance, Cambridge University
Press, Cambridge.
PALUMBO, G., G. GIUPPONI, L. NUNZIATA and J. S. MORA-SANGUINETTI (2013). “The Economics of Civil Justice: New Cross-Country Data and Empirics,” OECD Economics Department Working Papers, n.º 1060.
QIAN, J., and P. STRAHAN (2007). “How Law and Institutions Shape Financial Contracts: The Case of Bank Loans”, Journal of Finance, 62 (6), 2803-2834. RODRIK, D., A. SUBRAMANIAN and F. TREBBI (2004). “Institutions rule: the primacy of institutions over geography and integration in economic development”,
Journal of Economic Growth, 9, 131-165.
SHVETS, J. (2013). “Judicial Institutions and Firms’ External Finance: Evidence from Russia”, Journal of Law, Economics, and Organization 29 (4), 735-764. COASE, R. H. (1960). “The problem of social cost”,
Journal of Law and Economics, 3, 1-44.
DJANKOV, S., O. HART, C. MCLIESH and A. SHLEIFER (2008). “Debt enforcement around the world”, Journal of Political Economy, 116 (6), 1105-1149.
EUROPEAN COMMISSION FOR THE EFFICIENCY OF JUSTICE (CEPEJ) (2014). Report on “European judicial systems - Edition 2014 (2012 data): efficiency and quality of justice”.
FERGUSON, S., and S. FORMAI (2013). “Institution-driven comparative advantage and organizational choice”, Journal of International Economics, 90 (1), 193-200.
GARCÍA-POSADA, M., and J. S. MORA-SANGUINETTI (2015). “Does (average) size matter? Court enforcement, business demography and firm growth”, Small Business Economics, 44 (3), 639-669.
GARCÍA-POSADA, M., and J. S. MORA-SANGUINETTI (2014). “Entrepreneurship and Enforcement Institutions: Disaggregated Evidence for Spain”, European Journal of Law and Economics, 40 (1), 49-74.
GIACOMELLI, S., and C. MENON (2016). “Does weak contract enforcement affect firm size? Evidence from the neighbour’s court.” Journal of Economic Geography.
HALL R. E., and C. I. JONES (1999). “Why do some countries produce so much more output per worker than others?”, Quarterly Journal of Economics, 114, 83-116.
HELPMAN, E. (Ed.) (2008). Institutions and Economic
Performance, Harvard University Press, Cambridge,
Massachusetts.
ICHINO, A., M. POLO AND E. RETTORE (2003). “Are judges biased by labor market conditions?”, European Economic Review, 47 (5), 913-944.
JAPPELLI, T., M. PAGANO and M. BIANCO (2005). “Courts and Banks: Effects of Judicial Enforcement on Credit Markets”, Journal of Money Credit and Banking,
37 (2), 223-244.
JIMENO, J. F., MARTINEZ-MATUTE, M. and J.S. MORA-SANGUINETTI (2015). “Employment Protection Legislation and Labor Courts’ Activity in Spain”. Working Paper 1507, Banco de España.
LAEVEN, L., and C. WOODRUFF (2007). “The Quality of the Legal System, Firm Ownership and Firm Size”,
Review of Economics and Statistics, 89, 601-614. MORA-SANGUINETTI, J. S. (2012). “Is judicial inefficacy increasing the weight of the house property market in Spain? Evidence at the local level”, SERIEs, Journal of the Spanish Economic Association, 3 (3), 339-365.
of the euro area. In this paper we tackle these issues by estimating a global vector autoregressive model (GVAR), a multi-country model which exploits panel variation across all current members of the monetary union. Two features of this framework are particularly attractive. First, being a multi-country model, the GVAR deals with country heterogeneity and allows for an assessment of asymmetries in the transmission of UMP measures. And second, the model allows monetary policy to affect a given economy not just directly, but also indirectly via cross-country interactions. By taking into account spillovers across members of the euro area, the GVAR allows for a more precise identification of the impact of UMP shocks.
Methodology
We explicitly model each member economy of the euro area in the spirit of the mixed cross section GVAR developed in Georgiadis (2015). The model consists of two blocks: a system of 19 national VAR models in which cross-country interactions are explicitly modeled; and a VAR model for common factors which affect all euro area countries, for instance the ECB’s monetary policy. Figure 1 depicts a stylized graph of the structure of the model. Monetary policy shocks affect a given economy not just directly, but also indirectly via cross-country interactions. Moreover, the common monetary policy depends on economic developments at the euro area level, hence the model accounts for the endogenous two-way feedback loops between countries and the common monetary policy of the ECB. Specifically, each national economy consists of a VAR model which includes three sets of variables: (i) national variables, which represent the domestic macroeconomic and financial conditions of the economy, namely GDP, consumer prices, real exchange rate, a measure of credit risk (developed in Gilchrist and Mojon, 2014) and new lending, as well as a measure of asset prices; (ii)
foreign-specific variables, which represent the influence of the main economic partners of a given economy and capture the relative spillovers, and are calculated as weighted averages of the corresponding domestic variables of other countries, with weights based on bilateral trade flows; (iii) common variables, such as monetary policy indicators, which affect all countries simultaneously.
UNCOVERING THE HETEROGENEOUS EFFECTS OF ECB UNCONVENTIONAL MONETARY POLICIES ACROSS EURO AREA COUNTRIES
PABLO BURRIEL AND ALESSANDRO GALESI
WORKING PAPER Nº 1631
We assess the effects of recent ECB unconventional monetary policy measures by estimating a global VAR that exploits panel variation across euro area economies and allows for cross-country interdependencies. Unconventional monetary policy measures have beneficial effects on activity, credit, inflation, and equity prices, and lead to a depreciation of the exchange rate. Most euro area members benefit from these measures, but with a substantial degree of heterogeneity. Cross-country spillovers account for a sizable fraction of this dispersion, and substantially amplify effects. Countries with less fragile banking systems benefit the most from unconventional monetary policy measures. Compared to a conventional monetary expansion, unconventional measures are particularly effective in reducing firms’ financing costs and boosting credit.
The events since the collapse of Lehman Brothers in September 2008 led central banks around the world to employ unconventional monetary policy (UMP) measures to fulfill their mandate of price stability. In the case of the ECB, the monetary policy response to the crisis has been shaped by the particularly large degree of heterogeneity across euro area member states, and spillovers between those states. In this vein, ECB President Mario Draghi stated:
“We faced severe impairments to the transmission of monetary policy across the euro area, with marked heterogeneity from country to country. This called for unconventional measures tailored to the specific frictions at hand.” Draghi (2014)
“Today’s economic and monetary union is larger and more diverse than a single country, such as Germany. It is highly integrated but still at times fragmented. And it comprises a very large number of policy-makers on fiscal, structural and other economic matters. All policy-makers have to recognise that we belong to EMU together and that policies as well as policy inaction create spillovers for other members. This is an enormous responsibility for governments and other economic policymakers.” Draghi (2013)
These remarks suggest that assessing the effectiveness of recent ECB UMP measures requires dealing with heterogeneity and interdependence across members
the face of stress situations. This is especially relevant in a setting in which the monetary authority has kept to its liquidity-providing policy with full allotment of the demand for liquidity. The second condition identifies measures that actually increase the level of banks’ excess reserves, which should bring very short-term money market rates (Eonia) closer to the ECB’s deposit facility rate1.
For comparison purposes, standard conventional monetary policy shocks are also identified, by requiring that lowering the official policy rate increases output and inflation of the euro area. At the same time, changes in the policy rate are required not to move the ECB’s balance sheet, so as to disentangle conventional policies from UMP shocks.
Results
We estimate the model using monthly data over the period January 2007 - September 2015, and we examine the effects of UMP shocks both for the whole euro area and for all member countries individually. From the euro area perspective, exogenous UMP shocks have beneficial effects on activity, credit, inflation, and equity prices, and lead to a depreciation of the exchange rate.
At the disaggregated level, most euro area members benefit from these measures: the UMP shock leads to significant increases in output growth and inflation in most of the countries, with effects that on average fade out after roughly six months. However, the effects are substantially heterogeneous across countries. Figure 2 The VAR model of the common factors includes five
aggregate euro area indicators: growth in Eurosystem balance sheet assets, the interest rate on the main refinancing operations, the spread between that rate and the overnight interest rate (Eonia), a financial stress indicator (the CISS index of Holló et al. 2012), and long-term inflation expectations. In addition, the model includes a set of feedback variables that capture the effects of macroeconomic developments at the euro area level on the common factors, constructed as weighted averages of all countries’ domestic variables, with weights are based on GDP shares.
Estimating the macroeconomic effects of the ECB’s unconventional monetary policies is a complex exercise. There is no precedent for the extent to which central banks have used non-standard instruments since the onset of the financial crisis in 2007, which means that the empirical analysis must be concentrated on a relatively short period. An added difficulty is the wide range of non-standard measures that the ECB has used in the various phases of the crisis. We use a combination of sign restrictions and zero restrictions on the impulse responses to identify UMP shocks. In line with the most recent literature, the model uses the change in the Eurosystem balance sheet as a variable to capture the interventions of the monetary authority. Concretely, following the approach of Boeckx
et al. (2017), non-standard monetary policy decisions are identified by two restrictions. First, they should represent exogenous balance sheet expansions: that is, expansions that are not responses to heightened financial stress. Second, they should reduce the spread between short-term interbank rates and the interest rate on the main refinancing operations. The first condition excludes changes in the ECB’s balance sheet that arise from banking system liquidity requirements in
STRUCTURE OF THE GVAR FIGURE 1
SYSTEM OF 19 INTER-LINKED NATIONAL VARs VAR MODEL FOR COMMON FACTORS
Spanish GDP & HICP
euro area GDP & HICP Italian GDP & HICP
French GDP & HICP
ECB balance sheet
MRO rate EONIA-MRO spread
CISS index German
GDP & HICP
We then turn to investigate which structural features of the economy may be good predictors of this heterogeneity in effects. To this end, we regress the estimated effects over a set of country-specific variables: real GDP per capita, as a proxy for the level of economic development of a country; an index of soundness of the banking sector, which is proxied by the share of capital in total assets held by banks; the unemployment rate, as a proxy for various factors such as aggregate demand conditions and labor market frictions; and an index of ease of doing business developed by the World Bank, to account for all those frictions and barriers which may impede the creation of new firms.
A preliminary inspection of the data shows that there is substantial correlation between the effects of UMP shocks and the soundness of each national banking system. Figure 4 plots for each country the peak responses of inflation and output growth against its banks’ capital ratio. Countries with less fragile banking systems benefit the most from unconventional monetary policy measures, and this correlation holds when controlling for alternative country-specific characteristics in the regressions. This result suggests the existence of a potential bottleneck in the effectiveness of unconventional monetary policies which works via the bank lending channel, as already shown in Boeckx et al. (2017). Indeed, expansionary policies should benefit from the soundness of the banking system, but these stimuli may not necessarily translate into additional lending and economic activity if banks need to re-establish the solidity of their balance sheets.
Finally, Figure 5 compares the effects of unconventional monetary policy measures with those arising from standard conventional monetary policy shocks, and plots the peak responses of inflation and output growth,
grouped by interquartile ranges, to a UMP shock which increases the annual rate of growth of the ECB’s total assets by one percent.2 Regarding the effects on inflation, Estonia features the highest increase (about 0.10%), followed by Latvia, Luxembourg, and Spain (about 0.06%), while the smallest effects are observed in France, Germany, and Italy (about 0.03%). With respect to the effects on output growth, Baltic countries feature the highest increases, while interestingly, effects are negligible in Spain, or not statistically significant in Portugal and Greece.
In order to assess the role of cross-country spillovers in the transmission of unconventional monetary policies, the previous results are compared with those obtained in a model in which cross-country linkages are not taken into account. Figure 3 plots the peak responses of output growth and inflation, decomposed into direct effects and spillovers. We point out two results. First, spillover effects dramatically amplify the effects: once accounting for spillovers, the average peak effects on output growth and inflation roughly double (from 0.03% to 0.06% for output, from 0.03% to 0.05% for inflation). Second, a substantial part of the heterogeneity in effects is due to cross-country interactions: when spillover effects are taken into account, the range of responses of output growth increases (from [0.02% - 0.12%] to [0.03% - 0.31%]), as does the range of responses of inflation (from [0% - 0.07%] to [0.01% - 0.11%]).
2 Note that sign restrictions identify a portion of the parameter
space, rather than a unique parameter estimate. Therefore, when we report the effect of a UMP shock we are referring to the median estimate from a distribution of effects associated with many different parameterizations consistent with our sign restrictions.
GEOGRAPHIC VARIATION OF RESPONSES TO UMP SHOCKS FIGURE 2
INFLATION OUTPUT GROWTH
( .035, .045]
0.0 0.1 0.2 0.3
LTU EST LVA LUX FIN SVK DEU AUT ITA IRL FRA SVN MLT NLD CYP BEL PRT ESP GRC OUTPUT GROWTH
DIRECT EFFECT SPILLOVERS
DIRECT AND SPILLOVER EFFECTS OF UNCONVENTIONAL MONETARY POLICY SHOCKS
P ea k re sp onse 0.00 0.02 0.04 0.06 0.08 0.10 0.12
EST LVA LUX ESP SVK BEL SVN PRT LTU IRL GRC AUT MLT FIN NLD FRA DEU ITA CYP INFLATION P ea k re sp onse FIGURE 3
EFFECTS OF UNCONVENTIONAL MONETARY POLICY SHOCKS AND BANKS' CAPITAL RATIO
0.00 0.02 0.04 0.06 0.08 0.10 0.12 10 12 14 16 18 20 INFLATION FIGURE 4 P ea k res ponse, HI P C inflation Correlation: 0.55
Bank capital and reserves tototal assets (in %)
0.00 0.05 0.10 0.15 0.20 0.25 0.30 0.35 10 12 14 16 18 20 OUTPUT GROWTH Correlation: 0.56 P ea k response, output growth
Bank capital and reserves tototal assets (in %)
EFFECTS OF UNCONVENTIONAL AND CONVENTIONAL MONETARY POLICY SHOCKS
0 5 10 15
0 5 10 15
NEW CREDIT OPERATIONS
FIGURE 5 P ea k response, ba lance sheet shock
Peak response, interest rate shock
0.00 0.05 0.10 0.15 0.20 0.25 0.30 0.35 0 0.05 0.1 0.15 0.2 0.25 0.3 0.35 COST OF CREDIT M ax im um fa ll, ba lance sheet shoc k
Maximum fall, interest rate shock
NOTES TO FIGURE 5: the x-scale measures the country-specific effects of a reduction in the official interest rate (conventional monetary policy shock), while the y-scale measures the effects of an expansion of central bank’s balance sheet (unconventional monetary policy shock). Both shocks are scaled to give a 1% peak effect on output growth of the euro area. For new credit operations we report the peak response, while for cost of credit we report the maximum fall, which equals the trough response with reversed sign. 45 degrees line in solid black. In our sample, data on new credit operations and cost of credit are available for ten and four countries, respectively.
REFERENCES
BANCO DE ESPAÑA (2015), “An Empirical Assessment of the Macroeconomic Impact of the Quantitative Easing Programme”, in Annual Report, Chapter 3, Box 3.2. BOECKX, J., M. DOSSCHE, and G. PEERSMAN (2017), “Effectiveness and transmission of the ECB’s balance sheet policies”. International Journal of Central Banking,
13(1), 297-333.
DRAGHI, M. (2013), “Stable Euro, Strong Europe”. Speech at the Wirtschaftstag, Berlin, 25 June.
DRAGHI, M. (2014), “Monetary Policy Communication in Turbulent Times”. Speech at the Conference De Nederlandsche Bank, Amsterdam, 24 April.
GEORGIADIS, G. (2015), “Examining asymmetries in the transmission of monetary policy in the euro area: Evidence from a mixed cross-section global VAR model”. European Economic Review, 75, 195-215. GILCHRIST, S., and B. MOJON (2014), “Credit Risk in the Euro Area”. NBER Working Papers 20041.
HOLLÓ, D., M. KREMER, and M. LO DUCA (2012), “CISS – A Composite Indicator of Systemic Stress in the Financial System”. ECB Working Paper Series 1426, European Central Bank.
shows that unconventional measures have been particularly effective in reducing firms’ financing costs and boosting credit.
Conclusions
We provide an assessment of the macroeconomic and financial effects of the ECB´s recent unconventional monetary policies by estimating a global VAR which includes all the current members of the monetary union. The multi-country structure of the GVAR explicitly takes into account national macro-financial dynamics as well as cross-country interdependencies. This allows us to better capture the relevant transmission channels of monetary policy, as well as to properly assess the size and dispersion of the effects of UMP shocks across euro area countries.
Unconventional monetary policies have beneficial effects on aggregate output and inflation, confirming their role as a stabilization tool. Most euro area members benefit from UMP shocks, but with a substantial degree of heterogeneity. Part of this dispersion is attributable to spillover effects, which substantially amplify the effects of UMP shocks. Interestingly, countries with less fragile banking systems benefit the most from unconventional monetary policies. This result suggests the existence of a potential bottleneck in the effectiveness of unconventional monetary policies which works via the bank lending channel. When comparing the effects of UMP shocks with those arising from conventional reductions in the official rate, we find that unconventional measures are particularly effective in reducing firms’ financing costs and boosting credit. We read this evidence as suggesting that the ECB’s unconventional monetary policies, thanks to their more targeted nature, have helped reduce financial fragmentation and thus to expand credit.
ON THE DETERMINANTS OF FISCAL NON-COMPLIANCE
MAR DELGADO, VICTOR LLEDÓ AND JAVIER PÉREZ
WORKING PAPER Nº 1632
1 Motivation
1The process of fiscal consolidation that has taken place in Europe in the aftermath of the global and euro sovereign debt crisis has brought the challenges posed by enforcement of fiscal discipline in federal or decentralized countries to the forefront of policy discussions. A number of papers have looked at this issue from a cross-country perspective, but some lessons can also be extracted by looking at regions within a country. Typically, extant studies focus on understanding the determinants of cross-country or regional fiscal non-compliance, defined as the difference between fiscal targets and outcomes.
There are two strands of the literature that analyses determinants of non-compliance. One focuses on “soft government budget constraints”, while the other looks at factors determining fiscal forecast errors. The former is rooted in the fiscal federalism theory: non-compliance with fiscal targets is due to the presence of soft budget constraints at the subnational level, which arise from the inability of the Central Government (CG) to credibly commit to not bailing out Subnational Governments (SNGs). As a result, SNGs do not restrain fiscal outcomes as firmly as economic fundamentals would require. Soft budget constraints have been shown to be driven by political motives. They are aggravated by flawed intergovernmental fiscal institutions, including large vertical fiscal imbalances (VFIs), weak fiscal rules, and limited market discipline2. The second strand of the literature is a smaller, but growing, body of empirical work dealing with the implementation of fiscal consolidations. Rather than asking why fiscal outcomes cannot be constrained ex ante, and targets enforced, it investigates whether fiscal targets, and the forecasts on which they are based, are set appropriately.
This paper considers a new framework that unifies aspects of both these approaches. Our framework distinguishes between voluntary and involuntary non-compliance, taking into account both the capacity and the willingness to comply. The study analyses Spain’s regions, which make for a relevant case study, given the high degree of fiscal decentralization of the country, which has evolved steadily over the past decades. In spite of its strict framework of national and supranational fiscal rules, Spain’s regions have displayed persistent fiscal non-compliance over the past twelve years, as shown in the following chart. Moreover, this non-compliance led to the implementation of bail-out funds by the CG, which provided market-based funding to SNGs in exchange for heightened control over the conduct of regional fiscal policies. In many Spanish regions, the VFI is very large.3 In fact, the average VFI in 2014 was near 65%, with a minimum of 30% and a maximum near 100%.
3 This study measures a region’s VFI as 1-r⁄ s, where own
revenue r corresponds to a region’s total revenue minus transfers received by the SNG from the central government and other public entities, while own spending s is a region’s total spending minus transfers paid by the SNG to the central government and other public entities.
1 This entry is based on the paper “On the determinants of fiscal
non-compliance: an empirical analysis of Spain’s regions”, by Mar Delgado-Tellez, Victor Lledó, and Javier J.Pérez, Banco de España Working Paper 1632. Forthcoming in Fiscal
Politics (2017), edited by Victor Gaspar, Sanjeev Gupta, and
Carlos Mulas-Granados (Washington: IMF).
2 See, e.g., Rodden, J., G. Eskelund, and J. Litvack, 2003,
“Introduction and Overview” in Rodden, J., G. Eskelund. G., and J. Litvack, eds, Fiscal Decentralization and the Challenge
of Hard Budget Constraints, pp. 1–31, (Cambridge: MIT
Press), and Ter Minassian, T., 2015, “Promoting Responsible and Sustainable Fiscal Decentralization”, in Ahmad, E. and G. Brosio, eds., Handbook of Multilevel Finance, (Cheltenham: Edward Elgar Publishing).
0 10 20 30 40 50 60 70 80 90 100 2003 2005 2007 2009 2011 2013 2015 FRACTION OF NON-COMPLIANT REGIONS
OFFICIAL ASSESSMENT
EVOLUTION OF REGIONS' NON-COMPLIANCE WITH FISCAL DEFICIT TARGETS
Percent non -comp lia nt FIGURE 1 -2.5 -2.0 -1.5 -1.0 -0.5 0.0 0.5 1.0 1.5 2003 2005 2007 2009 2011 2013 2015 MEDIAN REGIONAL NON-COMPLIANCE
HOMOGENOUS ASSESSMENT Outcome - target (percent of reg iona l GDP)
where INVOL and VOL are vectors including the involuntary and voluntary determinants, respectively; η and ρ are, respectively, country and time fixed effects, α measures the persistence of the non-compliance behaviour, and γ and δ measure the relative impact of involuntary and voluntary factors on fiscal compliance.
2.3 Main Hypotheses
In decentralised countries, fiscal compliance of all tiers of government is crucial to ensure fiscal stability. The distinction between voluntary and involuntary determinants of SNG fiscal non-compliance enables a better understanding of regional fiscal behaviour. Involuntary non-compliance should depend negatively on favourable economic shocks such as unexpectedly high economic growth, and favourable conditions such as growth or inflation above the average of other regions. Hence, the growth forecast error and the deviations of growth and inflation from the mean are expected to have a positive impact on the fiscal compliance margin (see table below). Another variable that may explain involuntary non-compliance is the required fiscal adjustment, which is defined as the difference between the fiscal target and the fiscal outcome in the previous year. Therefore, greater required adjustment implies a stricter target that is more difficult to comply with.
Meanwhile, voluntary non-compliance could depend on multiple factors: region size, fiscal autonomy, market discipline, fiscal rules, political representation, electoral years and political autonomy. First, a SNG may avoid compliance because the region is relatively big (measured by GDP or by population), giving it stronger negotiating power to convince the Central Government to rescue it. But on the other hand, in the case of a small region, the SNG may avoid compliance because of the small cost of its bailout. Given these offsetting effects on the bargaining situation, the impact of regional size is expected to be ambiguous.
The degree of fiscal autonomy would be expected to have a positive impact on the compliance margin, since regions with larger fiscal autonomy would have more capacity to adapt their income and spending. Likewise, the degree of market discipline, and the strength of fiscal rules, would also be expected to have a positive impact, as they are directly related with the negative consequences of non-compliance.
On the other hand, upcoming electoral dates are expected to have a negative impact on compliance behaviour, since compliance could entail a politically
2 Framework and main results
2.1 Game specification
The model differentiates voluntary from involuntary non-compliance, considering it as voluntary when the SNG has the capacity but not the incentives to comply, and involuntary when despite the willingness to comply, the SNG is not capable of doing so.
The classification can be interpreted in terms of a dynamic game. SNG non-compliance occurs in two situations: whenever the target chosen by the CG is feasible but the Regional Government chooses not to comply (voluntary non-compliance), and when the target chosen is not feasible (involuntary non-compliance).
A possible cause of involuntary non-compliance is that in periods of fiscal stress, CGs face increasing (domestic or supranational) political pressures to ensure that fiscal consolidation targets at the general government level are met. To minimize the political costs such pressures entail, CGs may “pass the buck” of the adjustment down to SNGs. This leads to ambitious, but (initially) feasible centre-imposed SNG fiscal targets that may become infeasible once fiscal and macro shocks materialize.
2.2 Empirical Analysis
The empirical analysis will therefore focus on the determinants of the fiscal compliance margin, defined as the difference between the fiscal outcome and the target: f e = f - f *, a positive margin meaning compliance.
The analysis is based on a dynamic panel regression following the Arellano-Bond first-difference generalized method of moments approach. The regression model is based on the following equation:
f i t = α f it - 1 + γ INVOL it + δ VOL it + η i + ρ t + ϵ it , CG chooses target RG chooses not to comply Target ex-post feasible Target ex-post infeasible RG chooses to comply VOLUNTARY INVOLUNTARY
In relation with voluntary non-compliance, VFIs have a negative impact on compliance, as expected, since a large disequilibrium between own income and expenditure implies less incentives to comply. That is, large VFIs imply a lack of co-responsibility, which allows SNGs to blame non-compliance on the design of the financing system. We also hypothesized that a larger share of investment and basic social services over total spending would have a positive impact on compliance, because it would entail greater expenditure autonomy. Nevertheless, the estimated impact is negative, probably showing that these particular expenditures tend to be more rigid, and difficult to adjust to economic shocks. In relation with market discipline, only the implicit interest rate seems to have a direct and significant impact on the compliance margin. Interest rates rose during the first years of the crisis, while falling in later years, due to the implementation of Central Government funds to finance SNG debt.
Finally, while fiscal rules do not seem to have had a significant impact, electoral dates do. The compliance margin seems to fall whenever there are regional or national elections, suggesting that SNGs prefer not to costly social spending cut or tax increase. Similarly,
other political factors may also affect compliance behaviour, because if the region is politically strong, it may expect to avoid sanctions for fiscal non-compliance.
2.4 Empirical results
The empirical results bore out some of the key hypotheses. All the variables expected to affect involuntary non-compliance seem to have a significant impact. Growth forecast errors and required adjustment work in the expected direction, while regional GDP growth and CPI differentials over national growth have a significant effect of unexpected sign. The impact of the required adjustment is arguably attributable to ambitious and rigid fiscal targets set by the CG as a result of national and supranational pressures for General Government consolidation, as discussed above. Overall, these variables are related with the difficulty of meeting the target, because if GDP grows less than expected or the required adjustment is too large, the target could be infeasible. In addition, the compliance margin appears to have a strong inertial behaviour.
s tl u s e r l a c ir i p m E t c e ff e d e t c e p x E e l b a ir a V l e n n a h C I) Voluntary
Spillovers Region size: Region weight in National Population,
GDP, and GDP per capita positive/negative —
— e v it i s o p y m o n o t u a x a T y m o n o t u A l a c s i F e v it a g e n e v it i s o p e r u ti d n e p x e l a t o t n i t n e m t s e v n i f o e r a h S e v it a g e n e v it i s o p e r u ti d n e p x e l a t o t n i s e i c i v r e s c i s a b f o e r a h S e v it a g e n e v it a g e n s e c n a l a b m I l a c s i F l a c it r e V e v it i s o p e v it i s o p t s e r e t n i ti c il p m i n i e g n a h c l a u n n a d e g g a L e n il p i c s i d t e k r a M — e v it a g e n g n it a r n i e g n a h c l a u n n a d e g g a L
Ratio securities over loans positive/negative —
— e v it i s o p h t g n e r t s s e l u r l a c s i F s e l u R l a c s i F — e v it a g e n n o it a t n e s e r p e r y r a t n e m a il r a p f o e z i S n o it a t n e s e r p e R l a c it il o P e v it a g e n e v it a g e n s n o it il a o c l a n o it a n d n a l a n o i g e r f o e c n e u r g n o C e v it a g e n e v it a g e n r a e y n o it c e l e l a n o i g e R s n o it c e l E e v it a g e n e v it a g e n r a e y n o it c e l e l a n o it a N — e v it a g e n s e it r a p y m o n o t u a -o r p f o n o it a t n e s e r p e r l a n o i g e R y m o n o t u A l a c it il o P II) Involuntary e v it i s o p e v it i s o p r o r r e t s a c e r o f h t w o r G s k c o h S e v it a g e n e v it i s o p l a it n e r e ff i d h t w o r g P D G l a e r l a n o it a n /l a n o i g e R e v it a g e n e v it i s o p l a it n e r e ff i d h t w o r g I P C l a n o it a n /l a n o i g e R e v it a g e n e v it a g e n r a e y s u o i v e r p ’sifsca loutcome s u n i m t e g r a t l a c s i F t n e m t s u j d a d e ri u q e R III) Others e v it i s o p e v it i s o p s r a e y s u o i v e r p f o e c n a il p m o C a it r e n I TABLE 1
each region’s initial situation may be crucial for a credible target policy, as unachievable targets tend not to be binding. Nevertheless, individualized targets may lead to moral hazard, reducing the incentives for sound fiscal policy in good times, as SNGs come to expect additional room for manoeuver if they enter a crisis in a weak fiscal position. The strict implementation of fiscal rules is crucial for promoting ex ante fiscal margins against adverse shocks, and to guarantee that the heterogeneity of structural fiscal positions among regions in normal times is minimized. Second, our results for Spain show that the occurrence of subnational fiscal crises cannot be ruled out even when national fiscal rules are fairly credible and intergovern-mental fiscal responsibilities are appropriately assigned. From this point of view, the recent Spanish experience suggests that granting regions additional instruments to prevent liquidity crises could be useful, so that pressure on the CG to support or bail out SNGs is reduced. In particular, the development of tools to support regions’ continued access to financial markets even in periods of fiscal stress is crucial.6
cut expenditure or raise taxes when they face the polls, because of the unpopularity of these measures. Also, when the ruling political party of the CG coincides with the one in power at the regional level, the compliance margin falls, perhaps because of the expectation of an easier bailout.
3 Policy discussion
The main policy lesson of our analysis is that enhancing fiscal compliance in multi-level governance systems requires a comprehensive assessment of inter-governmental fiscal arrangements that goes beyond strengthening formal rule-monitoring and enforcement procedures. Key issues to consider include: (i) the assignment of revenue-raising and spending mandates (to deal with VFIs); and (ii) how the burden of fiscal consolidations should be shared, and how this affects the setting of fiscal deficit targets. The assessment should be accompanied by a focus on making CG enforcement politically credible. From the latter perspective, our findings are mainly tailored to the fiscally decentralized setting of Spain, but also bear some lessons for multi-country arrangements.
More specifically, as regards the rules-based framework, our analysis suggests that there is still scope to further strengthen existing fiscal control procedures by making their activation more automatic and by tightening the legal requirements to publicly explain deviations from fiscal targets.4 Such measures may prove particularly important during election years, when the political costs for the CG in enforcing targets are more salient and our results show that non-compliance is more pervasive. Concerning inter-governmental fiscal responsibilities, our analysis highlights the need to revisit, and possibly reduce, existing VFIs by ensuring SNGs’ revenue-raising and borrowing mandates are consistent with their spending mandates.5 This would help strengthen SNG fiscal autonomy and policy accountability, and could make the enforcement of SNG fiscal deficit targets politically less costly and more credible. Finally, as to burden sharing in consolidations, our results suggest that the credibility of fiscal targets is linked to their feasibility. These policy conclusion need some qualifications, though. First, reasonable fiscal targets that consider 4 Lledó, V., 2015, “Coordinating Fiscal Consolidation in Spain:
Progress, Challenges, and Prospects”, in IMF (ed), “Spain: Selected Issues”, IMF Country Report No. 15/233, (Washington: IMF).
5 This is in line with previous work looking at the effectiveness
of subnational fiscal rules (Kotia and Lledó, 2015).
6 Delgado Tellez, M., C. I. González and J. J. Pérez, 2016,
“Regional government access to market funding: international experience and recent developments”, Banco de España Economic Bulletin, February 2016.
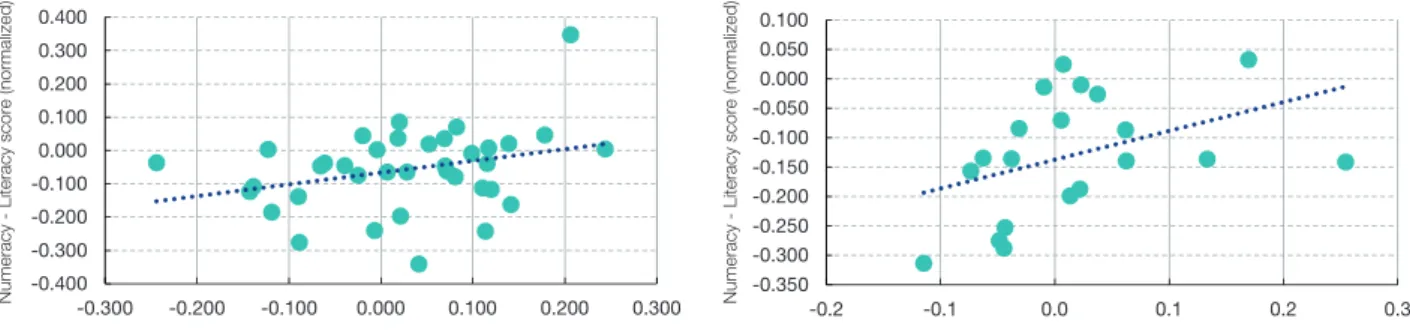
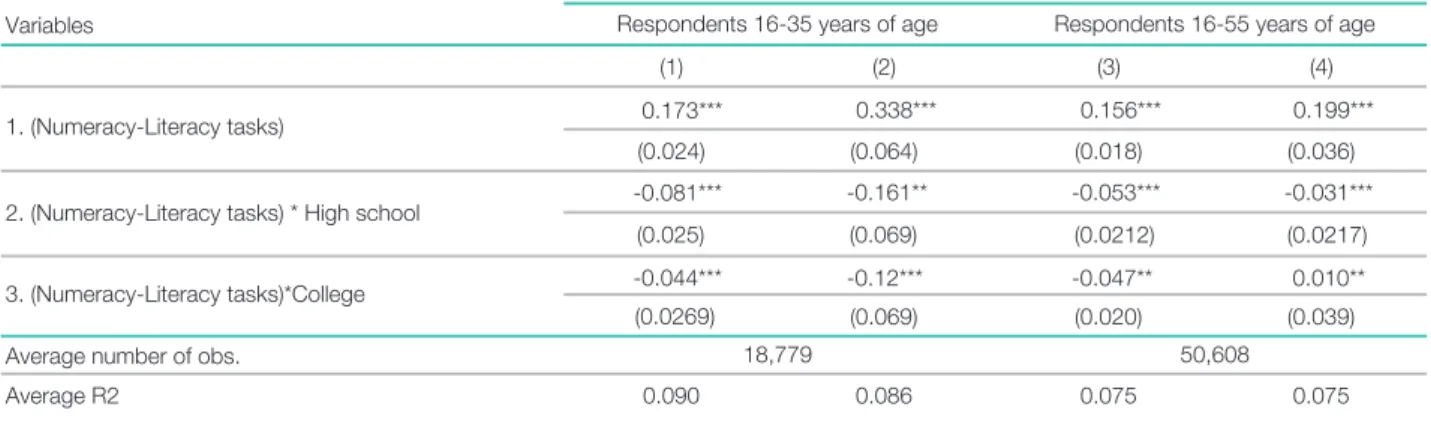
the tasks performed at work, for adults aged 16-65 in 24 countries or sub-national entities. Our sample is restricted to the thirteen countries (the Czech Republic, Spain, Estonia, Finland, France, Ireland, Italy, Korea, the UK (excluding Scotland and Wales), the Netherlands, Norway, the Slovak Republic and Sweden) with the largest sample sizes and more detailed information about the number of years of working experience and age. We pool employed and unemployed individuals as well as females and males between 16 and 55 years of age but exclude those workers who have not had any labour market experience.
With this information, we construct the following variables:
• Formal education. We group individuals in three schooling levels (primary education or less, baccalaureate studies or forms of non-university vocational training, and university education). The fraction of prime workers with basic schooling only is 19% in the full sample, being highest in Italy (47%) and lowest in the Czech Republic (6%).
• Tasks. We classify tasks as either numeracy-related (elaborating a budget, using a calculator, reading bills, using fractions or percentages, reading diagrams, elaborating graphs or using algebra) or literacy-related (reading email, reading guides, reading manuals, writing emails, writing reports, reading articles, reading academic journals, reading books and writing articles). We use the number of tasks performed within each class, and the frequency with which they are performed at w