October 1996 IMF Staff Country Report No. 96/105
Marshall Islands—Recent Economic Developments
This report on recent economic developments in the Marshall Islands was prepared by a staff team of the International Monetary Fund as background documentation for the periodic consultation with this member country. As such, the views expressed in this document are those of the staff team and do not necessarily reflect the views of the Government of the Marshall Islands or the Executive Board of the IMF.
Copies of this report are available to the public from International Monetary Fund • Publication Services 700 19th Street, N.W. • Washington, D.C. 20431 Telephone: (202) 623-7430 • Telefax: (202) 623-7201
Telex (RCA): 248331 IMF UR Internet: [email protected]
Price: $15.00 a copy
International Monetary Fund Washington, D.C.
Recent Economic Developments
Prepared by C. Browne, G. Oestreicher, and E. Sidgwick (all SEA) Approved by the Southeast Asia and Pacific Department
July 16, 1996
Contents Page
I. Introduction 1 n. Output and Prices 1 A. Output 1 B. Prices, Employment, and Wages 3 C. Environmental Issues 3 HI. Public Finance 4 A. Budgetary Developments in 1993/94 4 B. Budgetary Developments in 1994/95 5 C. Budget for 1995/96 5 D. Nonfinancial Public Enterprises 6 IV. Financial Sector 7 A. Background 7 B. Commercial Banking Developments 7 C. Development Bank 8 V. External Sector 8 A. Merchandise Trade 9
Tables
1. Gross Domestic Product, 1991-95 11 2. Copra Production, Producer Prices, and Export Unit Values, 1991-95 12 3. Majuro Consumer Price Index, 1991-95 13 4. Central Government Finances, 1990/91-1995/96 14 5. U.S. Grant Assistance, 1990/91-/1995/96 15 6. Central Government Current Expenditure, 1990/91-1995/96 16 7. Subsidies and Transfers to Public Enterprises, 1990/91-1994/95 17 8. Assets and Liabilities of Deposit Money Banks, 1992-95 18 9. Interest Rates of Deposit Money Banks, 1992-95 19 10. Assets and Liabilities of the Marshall Islands Development Bank, 1991-95 20 11. Balance of Payments 1990/91-1994/95 21 12. Exports by Product Category, 1991-95 22 13. Imports by Product Category, 1991-95 23 14. Imports by Supplier, 1991-95 24 15. External Assistance by Donor, 1990/91-1994/95 25 16. External Debt and Debt-Service Obligations, 1990/91-1994/95 26
abcmt 30 atolls and 1,200 snuiU islands, with a total land area of 70 square miles. The population is 5 5, 000 of which 45 percent Mve cm Majuro atoll, the government and business center of the country, and 20 percent five onKwajalein atoll where aU.S. missile tatting facility is located; migration from the outer islands to these centers has been substantial in the population is under 15 years of age. The nanow pitxkictive base COM fishing coconut harvesting and processing, and subsistence fiir
The Marshall Islands was part of the United Nations Trust Territory of the
Pacific Tfiynfff^ under U.S. ftdMTiiftratiofi during 194746. A Compact of Free Association between the United States and the Maohall Islands came into effert in
15-year period to 2000/2001,1 under which the U.S. ret^
provides financial assistance, presently equivalent to 50 percent of GDP. This support includes annual cash block granU of $26 rnillk* next five years* and $19 miffioo for the ted five yo^ thete amountt are subject to a partial annual inflation adjustment. Ifce U.S. also pro vides grantt for ^>ecified puiposes supervise by different federal agencies, ^specialty for health, education The terms of the Compact alkwed the ManhaU Islands to bon^ prospective block grant receipts through bond issues on commercial terms.
EL Output and Prices A* Output
Real GDP grew by 3.7 percent in 1995 (Table 1). Copra production increased, owing mainly to more frequent interisland transport services by government-owned ships.
Construction activity was boosted by the availability of external concessional aid finppcjpg for a high school and a garment factory, foreign direct iovwtment on a dry dock, and a
government-sponsored 150-room hotel. Value-added from the transport, communications and energy sectors rose, owing in part to an improvement in the financial performance of government-owned enterprises.
Chilled fish exports, mainly high-quality tuna for the Japanese market, increased in 1994-95, mainly due to the increased catch of the Chinese k>ng-4ine fishing boats which operate out of the privately owned and operated Majuro fish base. These boats pay a set fee per vessel, in contrast to the fees charged to the offshore Japanese fishing fleet, which are calculated according to the tfapfr of the boat, type of fistung, and volume offish caught. Frozen fish exports ceased in 1995 when the two purse seiners purchased during 1988-90 to
operate as joint ventures with local fishermen were sold by the Government because of their poor rate of return on capital. There are 11 Marshall Islands long-line boats that continue to operate, but their profitability is unclear. Japan and the Asian Development Bank (AsDB) are actively involved in providing assistance to strengthen the role of local boats. The AsDB helped establish the Fisheries Training School in Ebeye which trains local crews and is formulating a fisheries master plan.
Copra production, the main cash crop, rose by 5 percent in 1994 and 60 percent in 1995 (Table 2). However, productivity remains tow because of the aging tree stock (two thirds of the trees were planted prior to 1946) and a lack of investment in modem harvesting techniques. In 1992, procurement prices cm delivery in Majuro were doubled to $0.25 per pound in a largely unsuccessful attempt to encourage migration back to the outer islands. The price was reduced to $0.20 per pound in 1994 and to $0.16 per pound in March 1996, but remained above the world pike. The TobolarQ>praPn>cessing Authority, a government enterprise that is the sole commercial purchaser of copra, has the capacity to crush up to 22,000 tons per year, but receives substantially less tlian this amount. A recent trial purchase from Kiribati was successful and the possibility of expanding this source is being explored. The enterprise fifty finished construction of a coconut oil refinery.
Output of food crops and livestock has increased in recent yean, although growth is limhed by the easy availabi% of imported food as well as undeveloped marketing channels. The Go vernmem is encouraging food pi^ Locally grown fruit and vegetables and eggs from a poultry project, initiated with external assistance, supply about 30 percent of the Majuro narkft and an externally assisted
horticultural project also supplies produce to the local market. The Government has provided an open-air market in Majuro for about 50 formers'cooperatives. In the outer islands, it is distributing seeds and providing technical asfisttincf to promote production, as well as experimenting with giant clam and pearl fanning.
In addition to the copra plant, there is a small-scale manufacturing sector that consists mainly of processing of taro, breadfruit chips, and coconut products. The
construction of a 120 employee garment factory to operate as a joint venture with China, has recently been completed but its opening has been delayed while it is determined if the output has duty-free entry to the United States. The project was funded by a zero-interest loan of $2 million from China.
The tourism sector continues to be hampered by the distance from major markets, competition from other lower-cost destinations, limited infrastructure, and infrequent air services. The complex land tenure system has hindered the development of tourist resorts, but the government-owned ISO-room hotel in Majuro is scheduled for completion in July 1996. The main attractions are diving and snorkeling, which has the potential for increasing
are taking place with the Governments of Kiribati, Maura, and Tuvalu with a view to assessing the feasibility of joint air services to exploit regional tourist attractions.
There is considerable infrastrncture investment in transportation facilities in the Marshall Islands, particularly the main ports of Majuro and Ebeye, Majuro airport, the Majuro andH>eyero^systeiBS>aadteriecetth/co]q^^^dc<icfiui^. Investment in the outer
atolls is mainly confined to airstrips and jetties, including some designed for fisheries projects. The mam problcnM fern the iMim»naireaiKlnM^
required to operate domestic airline aad interialand shaping services. The AsDB is preparing a ten-year transportation infrastructure o^vdopnientinajterpian assigned to ensure that new investment in air, sea, aad road frcimies is prkirhia^ appropriately aiid that the operational efuGteiicv o* luC sector is strcoflitiicncfl.
The Government welcomes foreign investment with a view to expanding and diversifying the productive base. Various tax incentives are available, although foreign
investment projects are often subject to delays as cabinet approval is required fin- each project. The land tenure system also acts as a constraint because foreign ownership of land is not permitted under the Constitution.
Gossamer prices increased by 6 percent oi 1994 and 7 percent in 1995, much h than in the United States, the main trading partner (Table 3). The rapid rise in prices of household goods, personal supplies, and dothing U puzzling, but may h by reduced competition in the retail sector, including the closure of one large store.
Employment in the public sector hu contimied to rise, in part because s^^ personnel, including teachers and hospital workers, were exempt from recent taring freezes. High wages in the governmert sector have en^ Salary increments tew historically averaged 6-10 percent amtally for public sector employees, based on seniority and merit increases. However, following the March 1996 supplementary budget, most public sector wages were reduced by 5 percent.
Foil-time private sector employment is mainly limited to Majuro and Ebeye and the U.S. military installation in Kw^alebt A lai^e percentage of the economically active
population is engaged in semi-subsistence activities, especialty m the outer islands. There are no reliable data on unemployment or wage earnings. However, the national minimum wage of Sl.SO per hour was increased to $2.00 per hour in 1995.
C Environmental Issues
The Marshall Islands has a solid legal and institutional environmental framework. The Environmental Protection Authority has legislative powers to monitor water quality, waste
disposal, and sewage, and powers to promulgate and enforce regulations. Legislation also exists for the control of coastal zone development, although enforcement remains hampered by a shortage of manpower. Environmental problems in the main urban areas pertain mainly to water supply, sanitation, and degradation of the near-shore environment. Population pressures resulting from Ugh birth rates and migration from the outer atolls are compounding these problems. The near-shore environment has become vulnerable to flooding, erosion, and silting due to poorly designed causeways. The planned AsDB water and transportation projects should help to alleviate these problems. The long-term effects of the nuclear testing program in the 1950s on the atolls of Bikini and Enewetok are being addressed through various joint programs funded by the U.S. Government. In order to limit pollution of the lagoon and destruction of coral reefs, as well as potential overfishing in the economic zone, the Government decided to limh the size of the Chinese fishing fleet in Ma|uro. To preserve the environmental heritage, all new tourist projects are carefully scrutinized.
ILL Public Finance
The central government overall budget deficit averaged over 13 percent of GDP during 1992/93-1994/95 (Table 4). Current expenditure fell by 20 percentage points of GDP over this period, but a combination of lower U.S. grants and rising capital expenditure limited the decline in the overall deficit. These deficits were financed by borrowing against firture Compact revenues, which caused outstanding external debt and debt service to rise to unsustainable levels, and by exhausting the cash holdings of the Government.
A. Budgetary Developments in 1993/94
The budget envisaged a reduction in the overall deficit to 9 percent of GDP in 1993/94. The actual outturn was 4 percentage points of GDP worse than budgeted, mainly because of higher-than-antitipated current expenditure and a marked expansion of capital expenditure. External commercial borrowing of $30 million was undertaken in August 1994 to finance the deficit and replenish cash reserves which, as a result, increased during the year.
Domestic revenue was equivalent to 30 percent of GDP, 3 percentage points lower than in the previous year although in line with the budget. Tax revenue declined mainly because of lower import duties but this was offset by higher nontax revenue as negotiations with the Chinese fleet led to a doubling of the fishing rights fee to of Marshall Islands passports grew strongly. External grants amounted to 46 percent of GDP, 6 percentage points less than in the preceding year (Table 5).
Current expenditure was equivalent to 64 percentage points of GDP, 14 percentage points lower than in the previous year but higher than budgeted (Table 6). The wage and salary bill rose sharply primarily because controls on recruitment were not strictly enforced. Subsidies remained high despite the withdrawal of support for the energy company. Payments to the copra sector were needed because procurement prices were well above world prices
and the airline received large transfers to rover operating losses on domestic routes and meet the initial payments on a new aira^(^^ However, purchases of goods and services were reduced and interest payments declined as a result of the earlier restructuring of
commercial debt. Capital expenditure increased to 26 percent of GDP, 5 percentage points more than in the previous year, because of spending OB the state-owned hotel project, infra-structure development on Kwajaldn atoll, and education projects.
B. Budgetary Developments in 1994/95
The budget envisaged a small decrease in the overall deficit to 12 percent of GDP in 1994/95. This outcome was achieved, although the composition of revenue and expenditure was considerably different from the budget. Domestic revenue was projected to fell by 3 percentage points of GDP, m the absence of new revenue measures apart from the
imposition of a W. 10 per gaUon import tax On dieasl fool, while external grants were budgete. to decline 7 percentage points of GDP. In these circumstances, the authorities budgeted large fills in current and capital expenditure.
Domestic revenue was 30 percentage points of (IMP, w?frft^p«f from the previous year and wdl above the budget. Inron^ tax receipts rose due to higher than e>q>ected
economic growth, but import duties were below expectation, as administrative and collection problems led to a reduction in the cflGectivei^te of duty from 10 percent to 81/2 percent. Nontax revenue increased sttghtty because interest rewiirts rone as returns were earned on the fiindsboirowed in the prcvk>us fiscal year ai^ However, fishing rights fees declined with a feU in the mimber of foreign vesseU fishi^ waters. External grants were 45 percent of GDP, wefl above the budget, partly because of higher U.S. project disbursements.
Current expenditure decreased to 59 percent of GDP, S percentage points less than in the previous year, but above the budget Wages and salaries declined by much test than planned because the shortening in the length of the working week to 4^ days was not implemented. Purchases of goods and services increaaed, as there was some slippage compared with the budget. Subsidies were reduced substantially, mainly by cutting the transfer to the airline. However, capital expenditure increased to 28 percent of GDP, a rise of 3 percentage points, as the remaining payment due on the new aircraft was made, and other projects continued, notably the construction of the hotel, a school financed by Japanese funds, and the U.S.-financed dry dock facility
C Budget for 1995/96
The budget for 1995/96, recognizing that the limits of commercial borrowing had been reached and that cash reserves were nearly exhausted, was designed to eliminate the overall deficit through a sharp compression of expenditure. These included a hiring freeze, closure and amalgamation of departments, reduced cost-of-living allowances for legislators,
and smaller subsidies to public enterprises. With respect to Mpftal expenditure, the completion of projects which had been initiated in earlier years was envisaged but no new projects were to be undertaken.
When it became dear in early 1996 that the budget projections were overly optimistic, parliament passed a supplemental budget calling for more expenditure cuts and enhanced revenue generation. Revenue measures were designed to yield 2 percentage points of GDP and included an extension of the gross revenue tax to more businesses; the inclusion of housing allowances in personal taxable income; an across-the-board increase in import duties from 1 0 percent to 12 percent, except for a few food items; and increases in duties on motor vehicles, petrocum, alcohol, cigrettes, and hixury items, some as high as 150 percent.
Expenditure measures were expected to yield 3 percentage points of GDP through a 5 percent cut in wages of dvil servants earning an annual salary in excess of $10,400; the cancellation of all job vacancies; the closure of the Ministry of Social Services and the associated redundancy of about 200 dvil servants; and a 3 percent cut across departments in other administrative expenditures. Subsidies to the copra sector and the airline were further reduced.
D. Nonfinancial Public Enterprises
Public utilities inMajuro are generally operated efficiently and meet consumer demand. Outside of the capital, however, the provision of dectricity, tdecoms, water, and sewerage is less efficient or nonexistent due to poorer management and geographical concerns that raise unit costs, sometimes to prohibitive levels. The ManhmDs Energy Company, which provides dectrical power inMajuro, ended reliance cm subsidies in 1993 and has since posted a profit because of higher sales of diesd fiid to the fishing fleet and the Federated States of Micronesia, an increase in tariffs of 1 U.S. cent per kilowatt hour, and enhanced collection efforts. The corporation was asked in July 1994 to manage the Mjyuro Water and Sewage Services on a commercial tons. The water company received a small subsidy in
1994/95 but the installation of meters and aggressive pursuit of fees increased profitability and no subsidy was budgeted for 1995/96. The AsDB is currently considering a project loan for the upgrading of the water supply system and the promotion of conservation.
The National Telecommunications Authority was privatized in 1991, with the Government retaining majority ownership of the outstanding shares, and is the sole provider of long distance and local services in Marshall Islands. Despite low domestic tariffs, long distance calls have enabled the authority to remain profitable. Capital expansion has been funded with the S20 million loan from the U.S. Rural Electrification Administration.
Tobolar Copra Processing Plant finances were weak in 1993/94 and 1994/95, primarily as a result of maintaining domestic procurement prices well above world market levels and large budgetary subsidies were received. Procurement prices were reduced in March 1996 and the subsidy is projected to be much smaller in 1995/96.
Air MarshallIslands received Urgea mMmm9mi9m/94mdl994f9S9\M^Kvmt
reduc^ in 1995/96, as the airline embarked OT^ New management is in place, service to Hawaii has been eliminated, and aircraft have been taken out of service. The fleet now consists of one aircraft for international routes, which was purchased for US$15 million in June 1995, and two aircraft for domestic travel.
IV. Financial Sector A. Background
The financial sector consists of two U.S. CTfnmffT*^ banks, the Bank of Guam and the Bank of Hawaii, ami odomestkincally incorpcred commercial berad the bank of the Marshall Islands. Each oftht Ant banks has brandies mM^uro; the Bank of Guam and the Bank of the MarthaU Islands operate in Ebeye. The lector also iiuiudes the Man Development Bank. Ite Government increased its shareholding in the Bank of the Marshall Islands by 40 percent to 60 percem in 19M^ Marshall Islands Development Bank of 15 pra^niWidte^nc€U.S.faiwM»intiie bank to 25 percent; the Government has an option to purchate the remaining foreign interest during the next two years. The deposits of the U.S. banks are protected by the Federal Deposit Insurance Corporation.
The Belong Art of 1987 sett forth the te^ IMF technical assistance and the estahtistaieitt of the Of the banking commissinoner have led to monthly reporting of comment The duties of the Banking <^mmissioiCTin<^detheestablishn^ of regulations and policy directives on bank supervisor the codification ^ of accounting and reporting; pronKrtion of understanding in refustion to credit risk apprasi authority to lk*nse banks analysis of the funnical of bankinstitions: and the preparation of proposals for inspection of banks and enforcement actions.
Consumer loans account for the dominant share of loans and we primarily for construction, travel, and education. Mutt Ions are made to public servants and repayments are made directly through payroll deductions. Loans for commercial purposes to public enterprises and the private sector are mainly for working capital and equipment. Longer term lending is limited by the land tenure system, which prevents banks from obtaining land as collateral, as well as by the lack of viable projects.
B. Commercial Banking Developments
Aggregate lending by banks declined by 19 percent in 1995 (Table 8). Total claims on the private sector dropped by 17 percent, with lending to commercial enterprises Ming by 24 percent and claims on individuals Ming by 11 percent. Claims on government ami public enterprises, which are quite small, fell by half The contraction in lending activity was
accompanied by an increase to 10 percent in the amount of noncurrent private sector loans for all three banks, with one third of those over 90 days delinquent.
The loan-to-deposit ratio declined from 76 percent at 1994 to 69 percent at end-1995 and banks continued to transfer excess fimds abroad. The Bank of the Marshall Islands further increased its lending, in contrast to the two foreign-owned banks, raising its loan-to-deposit ratio to 85 percent The Bank of Guam continues to operate well below the statutory requirement to lend domestically at least 75 percent of deposits. The Bank of Hawaii
obtained an exemption from this requirement when it was enacted in 1993.
Total deposits fell by 11 percent in 1995. The stock of demand and savings deposits declined by 21 percent and 24 percent, while time deposits increased by 30 percent The average rate of interest on time deposits rose from 4 percert to 5H percent in 1995,
prompting a shift away from other types of deposits, the returns on which were unchanged. The average maximum lending rate fi>r consumer loans rose to maximum commercial loan gate remained unchanged at 12 percent (Table 9). All of the banks reduced the maturities of their consumer loans because of concerns about the likelihood of cutbacks in public employment and wife fates in the future.
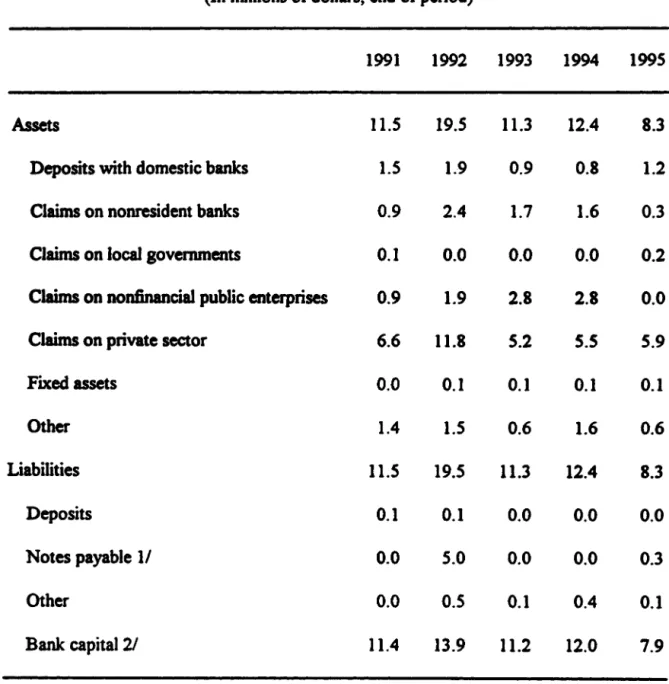
C Development Bank
The ManhaD Islands Developement banks was finaced intilially by $10 Million provided under Contact fiinds (Table 10). The Bank received an additional loan of $5 miffion from the Governmem in 1992 which was was converted in to a grant in 1993 These amounts are fiiDy lent and the small amount of new loan, mainly for housing, can only be made cxrt of funds the repayment of precious loans. The Bank is saddled with
substantial nonperfbrming bans; in 1993, it wrote off $7 million fa loan losses to the private sector. An interest rate ceiling of 6.5 percent on loans to both public and private enterprises was introduced in 1993 and this policy was extended to aB outstanding loans; prior to this, interest rates had ranged from 8 percent to 12 percent The AsDB is providing technical a ssi stance to strengthen the institutional structure and develop a corporate strategy for the Bank; it is envisaged that any new lending will be strictly on market-related loans.
V. External Sector
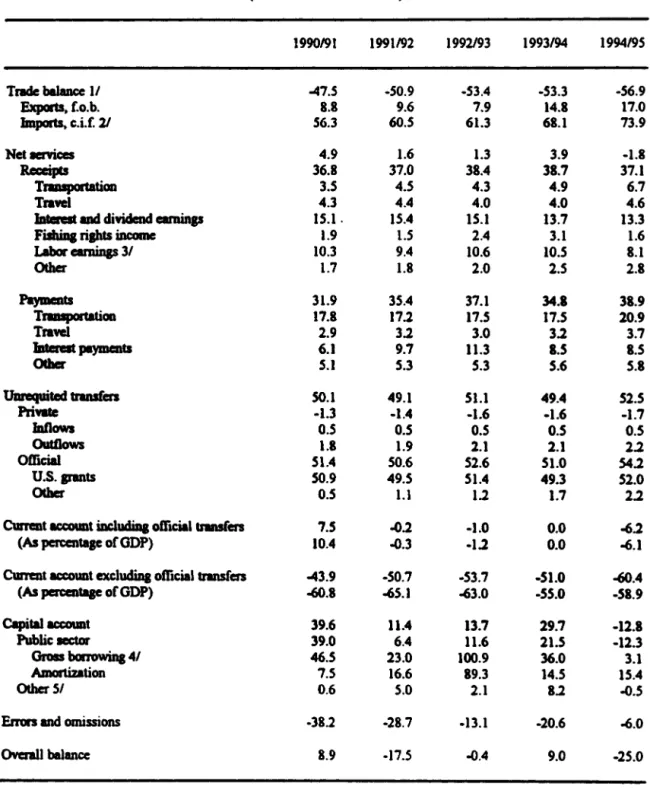
The external position remains structurally weak whh the current account deficit excluding official transfers averaging 60 percent of GDP over the past three years (Table 11). There is a large trade deficit, the service account is in approximate balance, and there are large external grant receipts, mainly from the United States. It is difficult to gauge capital account trends because no official balance of payments data are compiled, the U.S. dollar is the domestic currency, and there are no restrictions on capital flows. Substantial net inflows occurred during 1990/91-1993/94 when the Government issued bonds against the collateral of future Compact funds to finance fiscal imbalances. This turned into a net outflow in 1994/95,
as the Government exhausted its ability to borrow and concentrated on repaying existing loans. Changes in the financialholdings of the OpvwsMert, mamly liquid assets held in commercial banks abroad, indicate the overaD balance of payments position.
A. Merchandise Trade
The export surtor remains ftm^, owing to thf limited resource base, ron tilting almost entiidy of coconut oil and fi*(T«We 12). Exports Aowed high growth in 1994, in the wake of the basing of a Chiiiesefisfi^ fleet kMajuro. Buoyant sales of chilled fish and frozen fish by the two pure seiner jomtveaiufes combined to more ^^ There ^VCTC JUvO VDGFG9MQG* CKPOfCS OaTCteCftBi filC* *O^B9AwBflfVvOw SttttCS O* Jj^lCfOOCSJJi 4U1CI tftC Chinetefieet In 1995, frozen fish exports ceased with the sate of the purse seiners, but there were higher exports of chilled fish and coconut oil.
Import dependence is over 70 percent of GDP, reflecting high private consumption and halted domestic production. Food aad bjv»gaajM comprise about 30 percent of total imports. Marhiniiy aad f rinapnrtBtinn aquipmaBt have been equivalent to less than 20 percent of the total owing to smaH industrial Amtni (Table 13). Imports grew by
15Den^ml994aolby7o«rc«*inl995,sltao«ghgrowth
d^stmed for re<3q)ort was much slower. Ilie U.S. rssoains the donimaitt source of unports, supplying almost SO percent of the total in recent yiara (abittaco^ from the auicnft purchase in 1994/95), followed by Japan at about 9 percent (Table 14).
B. Services aad Tnuufers
Service receipts include interest earnings from the tnm funds established under the Nuclear Claims Fund fix the four atofls afitcted by •aelMrtcils in the 1950s, ftef under fishing agreements with foreig« countries to permk their vesseb to operate in Marshail Islands waters, international receipts from inhii imimiiiiii slium and aMne services, fees collected by the international shipping registry, aad narainsji of oMnaas emplojreU at the U.S. base on Kwajatem atofl. Service pagwMrts indude freight and msurance, {Myments to foreign contractors, and interest payments on external government debt Interest payments on bond issues were reduced in 1993/94 in the wake of the refinancing of $80 mifltcfl m government debt. Private rrmitfanres received PTM re«kientss«pioytidabrc^ are namor. other than at the base on Kwajaletn atoll The majority of official traasftrs are U.S. grants under the Compact of Free Association aad through various U.S. federal agencies. Non-U.S. grants include Japanese sfftiftancc for education and fisheries. Australian support for marine surveillance, and projects of muhUateral agencies, primarily the AsDB (Table 15).
C Capital Account aad External Debt
The capital account is dominated by government borrowing and amortization. Other public capital inflow in recent years has included concessional loans from China mainly to
finance a garment factory, and AaDB disbursements to support fisheries and education projects, and typhoon rehabilitation. Private capital inflows in 1993/94 and 1994/95 mainly originated with dig National Ttlfcomrmmicntionfp Artho*fy **&& mntinn^H to draw on a concessional loan to finance the telecommunications program. Capital outflows were driven by large-scale amortization payments of public sector debt
Outstanding external debt stood at S1S3 million (162 percent of GDP) at the end of 1993/94, before declining to $141 million (134 percent of GDP) in 1994/95 (Table 16). All the debt is on commercial terms except for small amounts owed to U.S. agencies, China, and the AsDB. External debt service was about 42 percent of exports of goods and nonfactor services in both years, mainly principal and interest payments on the bond issues, all of which have to be repaid by 2000/2001.
D. Exchange and Trade System
The currency of the Miuih^ Under the terms of the Compact, thf MurfMlf Tfflftnrtt must consult with the United Stttftf if it decides to issue its
own currency . There is no central monetatyinstituti foreign exchange. Foreign exchange transactions are handled by the three commercial banks which ate authorized foreign exchange dealers. The commercial banks buy and sell foreign exchange at the rates quoted in the international markets. Forward transactions may be conducted through these cx>mmerdal banks without restriction. There are no taxes or
subsidies on purchases or sales of foreign exchange and no exchange control regulations. The Marshall Islands accepted the obligations of Article VIII, Sections 2, 3, and 4, in May 1992.
Imports are not subject to import-Uc*nsing requirement business license. Imports of certain productt are prohfcited fw or social reasons. There are no suir^er requirements for export proceeds. Exports are not subject to licensing requirements* and there are no taxes or quantitative restrictions on
exports. The purchasing, processing, and exporting of copra and copra by-products are solely
conducted by the goveramemK>wnedTobolar Copra Pnx^esstng Plant. There are no restrictions cm payments for or receipts from invisibles.
Foreign investors are required to submit applications to the Cabinet and obtain a license in order to engage in business or acquire an interest in a business in the Marshall Tflamfs The Cabinet has the authority to formulate policies regarding incentives and priorities for foreign direct investment. All other inward and outward capital transfers are unrestricted with the exception that the Banking Act was amended in October 1993 to restrict commercial banks from transferring abroad more than 25 percent of deposits received from Marshallese, including domestic corporations and the authorities. However, this regulation is not strictly enforced and does not prevent a depositor from transferring deposits abroad.
(In millions of U.S. dollars)
Sector Agriculture and fishing
Agriculture Copra Food crops Livestock Agricultural services Fishing
Mining and quanying
lufagmfimf«|fiti<y
Processed copra
Of fi£r fiMifiufacturcd goods Handicrafts
Construction Electricity and water
Electricity Water
Tiunowtftlirtn aiuf Mwtimi nS^l'/v
Communications Trade
Wholesale and retail track Restaurants and hotels Financial services Financial institutions Insurance Real estate Business services Community services Public administration Education Health
Other social services Recreation/cultural services Personal services
Public utility services
Less imputed bank service charges Plus import duties
GDP at current market prices
1991 10.0 2.5 0.8 1.7 1.4 0.1 6.0 0.2 OO.7 -0.5 1.0 0.4 8.9 -0.6 •0.5 -0.1 -^ fi •J.w 11.1 0.2 * 7 •o. / 1.8 17.9 14.7 3.2 11.3 3.4 0.4 1.9 4•3*
1.1
25.1 10.8 7.0 3.9 1.2 0.8 0.7 0.7 4.2 6.4 71.8 1992 10.7 3.8 2.4 1.4 1.5 0.1 5.3 0.2 O•Oft 4.6 1.1 0.3 10.0 -0.5 -0.4 -0.1 •9 ft •*.o I AA 0.4 -X ft "O.5 2.2 19.8 16.0 3.8 12.7 3.3 0.4 25 £••** C 9 J.<L 1.3 27.0 11.8 7.4 4.2 1.2 0.9 0.8 0.7 4.4 6.1 77.8 1993 11.5 4.2 2.5 1.8 1.6 0.1 5.5 0.2 A £ U.O -0.9 1.1 0.4 8.5 0.9 1.2 -0.4 2./7 I £i .O 0.6 1 A •1.4 1.9 16.2 12.2 4.0 14.3 4.1 05\f»tJ 28 *».v 5./7 1.2 29.4 12.5 8.4 4.3 1.4 1.0 0.8 1.0 5.2 8.1 85.2 1994 15.1 4.6 2.7 1.9 1.6 0.2 8.8 0.2 1.uA -0.5 1.2 0.4 9.3 1.7 1.6 0.1 1.yO I.7** 0.7 o o •2.o 2.3 17.2 12.9 4.3 16.0 4 8 ~.i> 06 V.w 2 o 4r»* a •> o.Z 1.5 31.6 13.3 9.5 4.4 1.5 1.0 0.9 1.0 6.6 7.2 92.7 Est. 1995 15.7 5.3 3.4 1.9 1.8 0.2 8.4 0.3 2. /7 0.1 2.2 0.4 10.7 2.1 1.9 0.2 fi < O.3 1.71 0.8 A £. U.O 3.5 17.9 13.6 4.3 17.2 5 3 •?••/ 0 7 V. / 1 1 J.I H AO.4 1.7 32.0 13.4 9.7 4.5 1.7 1.0 0.9 0.8 6.9 7.1 102.6 OWner-occupoed dvellings land tranportaion land tranportaion land tranportaionTable 2. Marshall Islands: Copra Production, Producer Prices, and Export Unit Values, 1991-95
1991 1992 1993 1994 1995
Production (in short tons) Average producer prices
(In U.S. dollars per short ton) Total income
(In thousands of U.S. dollars) Export unit value
(In U.S. dollars per short ton) 1)
Sources: Data provided by the Office of Planning and Statistics; and staff estimates.
II Export unit values are estimated by dividing the value of exports of coconut oil and
copra cake by total copra production.
4,213 5,861 4,627 4,836 7,728 155 449 470 423 428 653 2,632 2,175 2,046 3,348 336 213 499 437 435
Table 3. Marshall Islands: Majuro Consumer Price Index, 1991-95 Groups Weights All Groups 100.0 57.71Food Household and Personal Supplies 14.76 Clothing11.95 Durable Goods and Fuel 15.58 1991 122.7 (1982 = 100) 122.6 130.6 125.6 112.9 1992 Ql Q2 Q3 Q4 1993 Ql Q2 Q3 Q4 1994
Ql
Q2 Q3 Q4 1995Ql
Q2 Q3 Q4 135.3 130.2 133.1 137.1 140.9 142.1 140.3 142.1 141.7 144.3 150.1 145.5 149.8 153.0 152.1 161.1 154.3 158.6 163.7 167.6 132.1 128.8 129.0 134.3 136.2 135.6 136.3 136.1 133.7 135.8 137.5 137.0 137.8 138.2 136.9 142.6 136.3 138.2 147.0 148.8 162.2 147.4 158.4 170.7 172.5 162.1 155.8 157.7 165.7 169.2 191.2 165.1 191.1 207.9 200.7 219.5 212.8 218.0 217.0 230.1 (Annual average change 1991 1992 1993 1994 1995 4.0 10.3 5.0 5.6 7.3 3.4 7.7 2.6 2.6 3.7 1.0 24.2 -0.1 17.9 14.8 132.3 130.1 131.7 125.7 141.8 153.5 155.6 155.3 150.0 153.1 158.1 155.0 159.4 161.5 156.7 184.1 162.6 189.4 191.1 193.1 in percent) 8.7 5.3 16.0 3.0 16.4 123.6 119.4 124.8 124.8 125.5 138.8 128.3 139.4 142.5 143.9 151.8 151.2 147.9 149.0 159.1 156.5 159.4 154.1 153.9 158.5 2.4 9.5 12.3 6.7 3.1Table4. Marshall Islands: Central Government Finances, 1990/91-1995/96 II (In millions of U.S. dollars)
Revenue and grants Tax revenue
Income tax Import duties Gross receipts tax
Fuel tax
Other (including penalties and interest) Nontax revenue
Fishing rights Interest income Fees and charges Other Grams 2/ Compact Other 21 Exnemiittm Current expenditure Wages and salaries Goods and services
Interest
Subsidies and other current transfers Capital expenditure
Net lending Overall balance
Deferred payments (net) Cash balance
Financing Net borrowing
f^mnjff lt-n.mut.il. IM.JU
vjiua» uor rowing
Repayments
Use of government financial attetc\J^*t MA ^WVAUABIWUl AHmilVMM viwwWMV
Revenue and grants Revenue
Grants
Expenditure and net lending Current expenditure
Capital expenditure and net lending Overall balance
Memorandum item:
Financial holdings (in millions of U.S. dollars)
1990/91 67.8 14.7 7.4 5.9 0.0 0.5 0.8 9.4 1.9 2.6 1.9 3.0 43.7 37.0 6.7 74 A/•I.U 57.3 17.6 22.3 5.9 11.5 12.8 3.9 -6.2 -4.3 -10.5 10.5 39.0 46.5 -7.5 -28 5 V*O.«7 94.5 33.6 60.9 103.1 79.8 23.3 -8.6 46.8 1991/92 67.2 16.7 8.3 5.6 2.2 0.5 0.1 7.7 1.5 3.0 0.1 3.2 42.8 32.5 10.3 07 7 o/./ 63.7 18.8 22.4 9.6 12.9 19.0 5.0 -20.5 -3.4 -23.9 23.9 6.4 23.0 -16.6
n
••*< 86.3 31.3 55.0 112.7 81.8 30.8 -26.3 29.3 1992/93 72.9 19.6 8.1 7.4 3.1 0.6 0.3 8.6 2.4 2.7 1.4 2.0 44.7 33.1 11.6 M.yo 66.8 19.4 26.3 10.2 10.8 18.1 0.0 -12.0 0.0 -12.0 12.0 11.6 100.9 -89.3 04 1993/94 70.9 18.7 8.0 6.6 3.2 0.6 0.4 9.2 3.1 1.4 1.7 3.0 43.0 33.7 9.2 M A .** 59.4 21.0 21.1 6.6 10.7 23.9 0.0 -12.5 0.0 -12.5 12.5 21.5 36.0 -14.5 .on 1994/95 76.7 19.9 9.3 6.2 3.1 0.9 0.4 10.7 1.6 2.5 1.5 5.2 46.1 34.5 11.6 fiO A O7.4 60.2 22.1 24.4 6.1 7.6 29.2 0.0 -12.8 0.0 -12.8 12.8 -12.3 3.1 -15.4 *»« A U.^ ~^.V A.S.V (In percent of GDP) 85.5 33.1 52.5 99.6 78.4 21.2 -14.1 28.9 76.5 30.1 46.3 89.9 64.1 25.8 -13.5 37.9 74.7 29.8 44.9 87.2 58.7 28.5 -12.4 12.9 Budget 1995/96 80.1 19.2 7.5 6.8 ... ... *•* 13.0 2.4 0.4 2.2 4.2 47.8 35.0 12.8 771 1 A A 57.9 21.6 25.2 7.9 3.3 19.5 0.0 2.6 0.0 2.6 -2.6 -13.1 3.3 -16.4 in ^ 1U.3 73.8 29.7 44.1 71.4 53.4 18.0 2.4 2.4 Sources: Data provided by the Marshall Islands authorities; and staff estimates.TableS. Marshall Islands: U.S. Grant Assistance, 1990/91-1995/96 (In millions of U.S. dollars)
Under Compact of Free Association Basic -Section 211
Central government operations Grant
Inflation adjustment
Kwajatetn Atoll Development Authority Grant
Inflation auju sti 1 K/I it KwajaleJn Atoll Trust Fund 11
Giant
Inflation adjustment
Kwajalein resident and landowner
compensation payments - Section 213 11 Energy -Section 214
Communications - Section 215 Tied giants - Section 216 Block grants - Section 221 Other grants Total 1990/91 44.7 35.8 26.2 19.0 7.2 3.8 2.8 1.0 5.7 4.3 1.4 1.9 2.0 0.3 1.7 3.0 6.2 50.9 1991/92 40.3 31.4 21.6 15.0 6.6 3.9 2.8 1.1 5.8 4.3 1.6 1.9 2.0 0.3 1.7 3.0 9.2 49.5 1992/93 41.0 32.1 22.0 15.0 7.0 4.0 2.8 1.2 6.1 4.3 1.8 1.9 2.0 0.3 1.7 3.0 10.4 51.4 1993/94 41.7 32.8 22.7 15.0 7.7 4.0 2.8 1.2 6.1 4.3 1.9 1.9 2.0 0.3 1.7 3.0 7.5 49.3 1994/95 42.6 33.7 23.3 15.0 8.3 4.2 2.8 1.4 6.2 4.3 2.0 1.9 2.0 0.3 1.7 3.0 9.4 52.0 Budget 1995/96 43.3 34.4 23.6 15.0 8.6 4.4 2.8 1.6 6.4 4.3 2.1 1.9 2.0 0.3 1.7 3.0 9.5 52.8
Source: Data provided by the Marshall Islands authorities. I/ Not included in central government finances (Table 4).
Table 6. Marshall Islands: Central Government Current Expenditure, 1990/91-1995/96 (In millions of U.S. dollars)
Government
President and Cabinet
Advisory Council of High Chiefs (Iroij) Legislature (Nitiiela)
Commissions, agencies, and offices 11 Ministries
UM|*II ttn/1 VnuiivMMMMtf ricaim ana Jen vironmeni fcou cation
Transportation and Communications Interior and Outer Island Affairs Public Works
Social Services
Resources and Development Foreign Affiurs
Finance Justice Other
Interest payments
Subsidies and transfers to public enterprises Miscellaneous Total 1990/91 6.4 1.2 0.3 12 3.8 35.0 8.3 8.5 2.5 1.3 2.7 2.9 1.0 1.8 3.6 2.1 0.4 5.9 7.4 2.6 57.3 1991/92 10.6 1.3 0.3 1.1 7.9 32.3 7.4 6.9 2.6 1.6 2.0 3.5 10.0 2.8 1.6 2.2 0.7 9.6 8.4 2.8 63.7 1992/93 12.7 1.4 1.2 1.2 9.7 31.4 5.9 8.1 2.3 1.6 2.0 3.0 1.1 3.4 1.5 1.7 0.8 10.2 6.8 5.7 66.8 1993/94 4.4 1.9 0.4 1.3 0.9 35.0 5.0 9.8 1.9 1.5 2.1 3.0 1.0 3.4 1.6 1.4 4.4 6.6 8.9 4.7 59.4 1994/95 6.8 1.8 0.4 1.9 2.8 35.6 6.4 10.0 2.3 1.4 1.2 2.8 1.1 32 1.3 1.4 4.5 6.1 6.0 5.6 60.1 Budget 1995/96 5.7 2.0 0.1 1.1 2.5 34.2 6.8 7.7 1.6 1.6 2.3 1.5 0.9 3.8 1.1 1.7 5.4 7.9 2.4 7.8 57.9
Sources: Data provided by the Marshall Islands authorities; and staff estimates. I/ Includes typhoon relief and Kwajalein causeway protection spending.
Table 7. Marshall Islands: Subsidies and Transfers to Public Enterprises, 1990/91-1994/95 (In millions of U.S. dollars)
1990/91 1991/92 1992/93 1993/94 1994/95
Total
Tobolar Copra Processing Marshalls Energy Company Air Marshall Islands
National Telecommunications Authority Majuro Water and Sewer Company Kwajalein Enterprises 11 7.4 0.8 0.4 5.3 0.3 0.4 0.2 8.4 2.7 0.4 4.4 0.3 0.4 0.2 6.8 1.9 0.4 3.7 0.3 0.3 0.2 8.9 2.2 1.3 5.3 0.0 0.2 1.1 6.0 2.7 ~ 2.3 0.0 0.5 1.1
Source: Data provided by the Marshall Islands authorities.
TableS. Marshall Islands: Assets and Liabilities of Deposit Money Banks, 1992-95 I/ (In millions of U.S. dollars)
Assets
Foreign Assets
Claims on public enterprises Claims on private sector Unclassified assets Liabilities Demand deposits Checking accounts Load governments Public enterprises Private sector
Checkable savings accounts Time, savings, and foreign currency
deposits Time deposits T 1 « Public enterprises Private sector Savings accounts Local governments Public enterprises Private sector
Foreign currency deposits Import and restricted deposits Foreign liabilities
Central government deposits 21 Capital accounts Unclassified liabilities 1992 Dec. 57.7 20.9 1 0 A . V 1.5 33.0 1.3 57.7 19.0 18.7 1.3 1.1 16.3 0.3 20.4 8.2 0.1 1.5 6.5 12.3 0.2 0.5 11.6 0.0 0.0 0.5 13.0 2.8 1.9 June 52.6 12.3 i < i../ 1.3 35.7 1.8 52.6 14.7 14.6 1.5 1.4 11.6 0.1 20.5 10.0 0.0 0.8 9.1 10.5 0.0 0.2 10.3 0.0 0.1 3.1 9.0 32 1.9 1993 Dec. 57.4 15.8 1 3*.j 1.0 36.1 3.2 57.4 15.9 13.5 2.3 0.2 11.0 2.5 21.8 9.4 0.0 2.4 7.0 12.4 0.0 0.2 12.2 0.0 0.0 3.4 10.1 4.0 22 1994 June 56.5 16.6 1 7i. / 12 34.8 2.2 56.5 14.4 12.4 1.1 0.4 10.9 2.0 18.4 8.6 0.0 0.6 8.0 9.8 0.0 0.2 9.6 0.0 0.0 5.0 12.3 3.3 3.1 Dec. 58.6 18.8 1 4 i.*t 1.0 36.4 1.0 58.6 16.6 14.2 1.4 0.5 12.3 2.4 20.9 8.6 0.0 2.9 5.7 12.3 0.0 02 12.1 0.0 0.0 2.6 13.8 3.9 0.8 Mar. 56.4 18.0 1 * i.j 0.3 34.7 2.1 56.4 14.1 12.1 12 0.5 10.4 2.0 21.2 9.8 0.0 3.4 6.4 11.4 0.0 0.2 11.2 0.0 0.0 2.9 13.1 3.7 1.4 1995 June 54.7 17.6 1 5 1.4 0.2 34.1 1.6 54.7 14.5 12.5 0.8 0.4 11.3 2.0 20.5 10.8 0.0 3.6 72 9.7 0.0 0.2 9.5 0.0 0.0 2.3 12.5 A2 0.7 Sept 54.2 19.1 1 i i.i 0.0 32.3 1.7 SO 13.9 10.7 1.1 0.4 92 32 22.1 12.1 0.0 2.7 9.4 10.0 0.0 02 9.8 0.0 0.0 1.1 12.0 4.5 0.6 Dec. 51.5 17.8 1 11.1 0.0 30.4 22 51.5 13.2 10.3 0.6 1.0 8.7 2.9 20.8 11.4 0.0 22 92 9.4 0.0 0.2 92 0.0 0.0 0.0 11.6 4.5 1.4
Source: Data provided by the Marshall Islands authorities.
Table 9. Marshall Islands: Interest Rates of Deposit Money Banks, 1992-95 (In percent per annum)
1992 1993 1994 1995 Dec. June Dec. June Dec. June Dec.
Deposit rates
Savings accounts I/
Time deposits 21 3 months 6 months
1 year and more Loan rates 3/ Consumer loans Commercial loans 3.6 3.8 3.8 4.2 15.7 11.4 3.2 3.2 3.4 3.7 16.2 11.4 3.1 3.1 3.2 3.6 16.5 11.0 2.9 3.1 3.6 4.0 16.5 12.4 3.1 3.4 3.8 4.2 16.5 12.4 3.1 4.9 5.4 5.8 16.5 12.4 3.1 4.8 5.4 5.9 17.2 12.4 Source: Data provided by the Marshall Islands authorities.
II Average of rates offered by deposit money banks.
2/ Average of minimum rates offered by deposit money banks. 3/ Average of maximum rates charged by deposit money banks.
Table 10. Marshall Islands: Assets and Liabilities of the Marshall Islands Development Bank, 1991-95
(In millions of dollars; end of period)
1991 1992 1993 1994 1995
Assets 11.5 19.5 11.3 12.4 8.3 Deposits with domestic banks 1.5 1.9 0.9 0.8 1.2 Claims on nonresident banks 0.9 2.4 1.7 1.6 0.3
Claims on local governments
Claims on nonfinancial public enterprises Claims on private sector
Fixed assets Other Liabilities Deposits Notes payable I/ Other Bank capital 21 0.1 0.9 6.6 0.0 1.4 11.5 0.1 0.0 0.0 11.4 0.0 1.9 11.8 0.1 1.5 19.5 0.1 5.0 0.5 13.9 0.0 2.8 5.2 0.1 0.6 11.3 0.0 0.0 0.1 11.2 0.0 2.8 5.5 0.1 1.6 12.4 0.0 0.0 0.4 12.0 0.2 0.0 5.9 0.1 0.6 8.3 0.0 0.3 0.1 7.9 Source: Data provided by the Marshall Islands Development Bank.
I/ On-lent by the central government out of the proceeds of its third bond issue. The loan was converted to equity capital in June 1993.
Table 11. Marshall Islands: Balance of Payments, 1990/91-1994/95 I/ (In millions of U.S. dollars)
Trade balance 11 Exports, f.o.b. Imports, c.i.f. 11 Net services Receipts Transportation Travel
Interest and Miviocno em Hints Fishing rights income Labor earnings 3/ Other Payments Transportation Travel Interest payments Other Unrequited transfers Private Inflows Outflows Official U.S. grants Other
Current account including official transfers (As percentage of GDP)
Current account excluding official transfers (As percentage of GDP) Capital account Public sector Gross borrowing 4/ Amortization Others/
Errors and omissions Overall balance 1990/91 -47.5 8.8 56.3. 4.9 36..8 3.5 4.3 15.1 1.9 10.3 1.7 31.9 17.8 2.9 6.1 5.1 50.1 -1..3 0.5 1.8 51..4 50.9. 0.5 7.5 10.4 -43.9 -60.8 39..6 39.0. 46.5. 7.5. 0.6 -38.2 8.9 1991/92 -50.9 9.6 60.5 1.6 37.0 4.5 4.4 15.4 1.5 9.4 1.8 35.4 17.2 32 9.7 5.3 49.1 -1.4 0.5 1.9 50..6 49.5. 1.1 •0.2 -0.3 -50.7 -65.1 11.4 6.4 23..0 16..6 5.0 -28.7 -17.5 1992/93 -53.4 7.9 61.3 1.3 38..4 4.3 4.0 15.1 2.4 10.6 2.0 37.1 17.5 3.0 11.3 5.3 51.1 -1.6 0.5 2.1 52.6 51.4 12 -1.0 -1.2 -53.7 -63.0 13..7 11.6. 100..9 89..3 2.1 -13.1 -0.4 1993/94 -53..3 14..8 68.1. 3.9 38..7 4.9 4.0 13..7 3.1 1.0.5 2.5 34..8 17.5. 32 8.5 5.6 49..4 -1..6 0.5. 2.1. 51.0. 49.3. 1.7 0.0 0.0 -51..0 -55..0 29.7 21.5. 36.0. 14.5. 8.2. -20.6 9.0 1994/95 -56..9 17.0. 73.9. -1..8 37.1. 6.7 4.6 1.3.3 1.6 8.1 2.8 38..9 20.9 3.7 8.5 5.8 52..5 -1..7 0.5 22 542 52..0 22 -6J2 -6.1 -60.4 -538.9 -12..8. -12.3. 3.1 15.4 -0.5 -6.0 -25..0 Sources: Data provided by the Marshall Islands authorities; and staff estimates.
I/ Trade data are compiled on a calendar-year basis and convened to a fiscal-year basis by the staff.
21 Includes petroleum products for re-export.
Table 12. Marshall Islands: Exports by Product Category, 1991-95 I/ (In millions of U.S. dollars)
Product
Copra cake
Coconut oil, crude Trochus shells Chilled fish
Pet fish Frozen fish
Re-export of diesel fuel Total 1991 0.0 1.4 0.2 1.7 0.7 6.8 0.0 10.8 1992 0.1 1.1 0.2 1.6 0.5 5.7 0.0 9.2 1993 0.2 2.1 0.2 1.3 0.6 3.6 0.0 7.5 1994 0.2 2.0 0.2 5.4 0.4 4.7 4.0 17.2 1995 0.2 3.1 — 6.6 0.4 6.7 17.0
Sources: Data provided by the Marshall Islands authorities; and staff estimates.
Table 13. Marshall Islands: Imports by Product Category, 1991-95 I/ (In millions of U.S. dollars)
Product
Food and live animals
Beverages and tobacco
Crude materials
Mineral fuels and lubricants
Animal and vegetable oils Chemicals and related products Manufactured goods
Machinery and transportation equipment Miscellaneous manufactured articles Unidentified items Total 1991 13.7 5.7 3.7 6.3 0.1 1.5 5.5 9.2 10.7 0.0 56.4 1992 15.1 3.3 4.0 8.5 0.1 1.9 7.5 11.2 1.0 9.2 61.8 1993 17.7 4.1 5.2 8.5 0.2 2.7 5.3 10.5 1.4 5.5 61.1 1994 19.9 4.1 5.0 15.3 0.3 2.4 6.0 8.7 1.9 7.0 70.4 1995 18.1 3.1 5.1 18.0 0.3 1.9 4.9 18.5 1.7 3.8 75.1
Sources: Data provided by the Marshall Islands authorities; and staff estimates.
II On a calendar-year basis. Data for 1994-95 include imports of mineral fuels and
lubricants for the Chinese fishing boats and for re-expon to the Federated States of Micronesia.
Table 14. Marshall Islands: Imports by Supplier, 1991-95 I/ (In millions of U.S. dollars)
Australia Fiji Hong Kong Japan New Zealand Philippines Taiwan Province of China United States
Mainland and Hawaii Guam Other Total 1991 0.9 0.8 0.5 5.4 0.2 0.2 0.1 47..2 3.8.0 9.2 1.0 56.4 1992 2.1 0.1 0.8 7.7 1.3 0.2 0.2 49..2 3.7.7 11..5 0.2 61..8 1993 1.1 0.2 0.7 5.9 0.7 0.1 0.3 49.1. 42.4 6.7 3.0 6.1.1 1994 1.3 0.5 1.5 4.2 0.5 0.3 0.8 59..9 42..4 17.0. 1.5 70..4 1995 1.4 0.6 1.3 5.6 1.1 0.4 0.6 49..2 38.3. 10.9. 14.5. 75.1.
Source: Data provided by the Marshall Islands authorities.
I/ On a calendar-year basis. It should be noted that the term "country/ as used in this report, does not in all cases refer to a territorial entity that is a state as understood by international law and practice; the term also covers some territorial entities that are not states but for which statistical data are
Table 15. Marshall Islands: External Assistance by Donor, 1990/91-1994/95 (In millions of U.S. dollars)
1990/91 1991/92 1992/93 1993/94 1994/95
U.S. grants
Under Compact of Free Association Other U.S. Other grants Japan Australia Other Concessional loans
Asian Development Bank
Government of China and others Total 50.9 44.7 6.2 0.5 0.5 0.0 0.0 0.0 0.0 0.0 51.4 49.5 40.3 9.2 1.1 1.0 0.1 0.0 0.7 0.3 0.4 51.3 51.4 41.0 10.4 1.2 1.0 0.1 0.1 0.9 0.9 0.0 53.5 49.3 41.7 7.5 1.7 1.5 0.1 0.1 3.2 1.2 2.0 54.2 52.0 42.6 9.4 2.2 2.0 0.1 0.1 3.1 3.1 0.0 57.3
Table 16. Marshall Islands: External Debt and Debt-Service Obligations, 1990/91-1994/95 (In millions of U.S. dollars)
1990/91 1991/92 1992/93 1993/94 1994/95
Total debt outstanding (In percent of GDP) Debt service
(In percent of exports of goods and services)
95.2 131.9 13.5 29.6 107.6 135.0 26.4 56.7 122.3 140.4 20.3 43.8 153.0 161.7 22.2 41.5 141.2 134.2 22.8 42.1
Medium-term bond issues Disbursements
Outstanding principal Amortization
Interest
Asian Development Bank Disbursements
Outstanding principal Amortization
Interest
Other central government 11 Disbursements
Outstanding principal Amortization
Interest
National Telecommunications Authority Disbursements Outstanding principal Amortization Interest 46.5 93.7 7.5 5.9 0.0 0.0 0.0 0.0 0.0 0.0 0.0 0.0 1.6 1.5 0.0 0.1 22.3 99.4 16.6 9.6 0.3 0.3 0.0 0.0 0.4 0.4 0.0 0.0 6.0 7.6 0.0 0.2 100.0 110.1 89.3 10.2 0.9 1.2 0.0 0.0 0.0 0.4 0.0 0.0 3.4 10.6 0.3 0.5 30.0 125.7 14.4 6.6 1.2 2.4 0.0 0.0 4.8 5.1 0.1 0.0 9.4 19.8 0.2 0.9 0.0 110.7 15.0 6.1 3.1 5.5 0.0 0.0 0.0 4.7 0.4 0.1 0.7 20.2 0.2 1.0 Sources: Data provided by the Marshall Islands authorities; and staff estimates.
References
Asian Development Bank, December 1995, Republic of Marshall Islands: Reforming
Public Finances (Manila).
, December 1993, Republic of Marshall Islands: Country Operational
Strategy (Manila).
Deloitte and Touche, Marshalls Energy Company Inc.-Financial Statements and
Independent Auditors' Report, Years ending September 30, 1995 and 1994 (Majuro).
, Majuro Water and Sewer Company Inc. - Financial Statements and Independent
Auditors' Report, Years ending September 30,1995 and 1994 (Majuro).
, Marshall Islands National Telecommunications Authority - Financial Statements and
Independent Auditors' Report, Years ending September 30.1995 and 1994 (Majuro).
, Republic of Marshall Islands - Financial Statements and Independent Auditors'
Report, Year ending September 30,1994 (Majuro).
, Tobolar Processing Plant, Inc. - Financial Statements and Independent Auditors'
Report, Years ending September 30, 1995 and 1994 (Majuro).
Government of Marshall Islands, December 1995, Policy Reform Program Paper (Majuro). , March 1996, Bill No. 23N.D. 2 (Interim Budget Bill) (Majuro).
, April 1996, Marshall Islands Statistical Abstract 1995 (Majuro).
International Monetary Fund, November 1995, Marshall Islands and Federated States of
Micronesia - IMF Economic Review (Washington).
, May 24, 1995, Marshall Islands - Staff Report for the 1995 Article IV Consultation
(SM/95/121).
, May 26, 1995, Marshall Islands - Statistical Appendix (SM/95/122) , February 28, 1994, Marshall Islands - Staff Report for the 1993 Article IV
Consultation (SM/94/51)
, March 4, 1994, Marshall Islands - Recent Economic Developments (SM/94/59) Marshall Islands Energy Company Inc., Annual Report 1993-94 (Majuro).
Marshall Islands National Telecommunications Authority, Annual Report 1995 (Majuro). United Nations Development Programme, November 1995, Public Sector Management
Improvement Program (New York).
, November 1995, Public Sector Management Improvement Program-Supplementary
Papers (New York).
World Bank, June 1995, Pacific Islands Economies: Building a Resilient Economic Base for