A Web-Based System for Classi
fi
cation of Remote
Sensing Data
Ángel Ferrán, Sergio Bernabé
, Student Member, IEEE
, Pablo G. Rodríguez, and Antonio Plaza
, Senior Member, IEEE
Abstract—The availability of satellite imagery has expandedover the past few years, and the possibility to perform fast pro-cessing of massive databases comprising this kind of imagery data has opened ground-breaking perspectives in many different fields. This paper describes a web-based system (available online: http://hypergim.ceta-ciemat.es), which allows an inexperienced user to perform unsupervised classification of satellite/airborne images. The processing chain adopted in this work has been implemented in C language and integrated in our proposed tool, developed with HTML5, JavaScript, Php, AJAX and other web programming languages. Image acquisition with the applications programmer interface (API) is fast and efficient. An important added functionality of the developed tool is its capacity to exploit a remote server to speed up the processing of large satellite/airborne images at different zoom levels. The ability to process images at different zoom levels allows the tool an improved interaction with the user, who is able to supervise the final result. The previous functionalities are necessary to use efficient techniques for the classification of images and the incorporation of content-based image retrieval (CBIR). Several experimental validation types of the classification results with the proposed system are performed by comparing the classification accuracy of the proposed chain by means of techniques available in the well-known Environment for Visualizing Images (ENVI) software package.
Index Terms—Remote sensing data processing, remote server, satellite/airborne image classification, web-based system.
I. INTRODUCTION
R
EMOTE sensing image analysis and interpretation have become key approaches that rely on the availability of web mapping services and programs. This resourceful increase has led to the exponential growth of the user community for satellite/airborne images, not long ago only accessible by gov-ernment intelligence agencies [1], [2]. In particular, the wealth of satellite/airborne imagery available from Google Maps,Manuscript received June 14, 2012; revised October 11, 2012; accepted November 09, 2012. Date of publication December 21, 2012; date of current version July 22, 2013. This work was supported by the European Commu-nity Marie Curie Research Training Networks Programme under contract MRTN-CT-2006-035927, Hyperspectral Imaging Network (HYPER-I-NET), and supported in part by funding from the Spanish Ministry of Science and Innovation (CEOS-SPAIN project, reference AYA2011-29334-C02-02) and by the Spanish Government Board (National Research Projects) and the European Union (FEDER founds) by means of the grant reference TIN2008-03063.
Á. Ferrán and P. G. Rodríguez are with the Grupo de Ingeniería de Medios, Department of Systems Engineering and Telematics, University of Extremadura, E-10003 Cáceres, Spain (e-mail: [email protected], [email protected]).
S. Bernabé and A. Plaza are with the Hyperspectral Computing Laboratory, Department of Technology of Computers and Communications, University of Extremadura, E-10003 Cáceres, Spain (e-mail: [email protected], [email protected]).
Color versions of one or more of thefigures in this paper are available online at http://ieeexplore.ieee.org.
Digital Object Identifier 10.1109/JSTARS.2012.2230247
which now provides high-resolution images from many loca-tions around the Earth1, has opened the appealing perspective of performing classification and retrieval tasks via the Google Maps application programming interface (API).
The combination of an easily searchable mapping and satel-lite/airborne imagery tool such as Google Maps, with advanced image classification and retrieval features [3], can expand the functionalities of the tool and also allow end-users to extract relevant information from a massive and widely available data-base of satellite/airborne images (this service is also free for non-commercial purposes). It should be noted that the current version of Google Maps does not allow using maps outside a web-based application (except with a link to Google Maps). Here we use Google Maps purely as an example to demonstrate that if we have a data repository we can use the tool we pro-pose, and the logo and Google Maps terms of service2are al-ways in place. The characteristics of Yahoo Maps are similar to Google Maps (though the spatial resolution of the satellite/air-borne imagery in Yahoo Maps is generally lower than Google Maps). OpenStreetMap is a collaborative project aimed at cre-ating a free editable map of the world, a design inspired by sites such as Wikipedia3. For illustrative purposes, the Table I shows a comparison between the main functionalities of the previous map servers.
As shown by Table I, Google Maps offers important com-petitive advantages, such as the availability of high resolution satellite/airborne imagery, the smoothness in the navigation and interaction with the system, the availability of a hybrid satellite view which can be integrated with other views (e.g., maps view), and adaptability for general-purpose web applications. It should be noted that other open standards for geospatial content such as those included within the open geospatial consortium (OCG) cannot currently provide complete world coverage at high spatial resolution as it is the case of Google Maps. This is why we have decided to use Google Maps service as a baseline for our system. However, our system has been designed in a completely modular and open way, and that it allows for the incorporation of alternative data sources and software imple-mentations in future developments. On the other hand, a feature which is currently lacking in Google Maps is the unsupervised or supervised classification of satellite/airborne images at different zoom levels [4], [5], even though image classification is widely recognized as one of the most powerful approaches in order to extract information from satellite/airborne imagery [6]–[8]. The incorporation of such a function into Google Maps
1http://code.google.com/apis/maps/index.html 2https://developers.google.com/maps/terms?hl=en 3http://www.wikipedia.org
FERRÁNet al.: A WEB-BASED SYSTEM FOR CLASSIFICATION OF REMOTE SENSING DATA 1935
TABLE I
COMPARISONBETWEEN THEMAINFUNCTIONALITIES OFGOOGLEMAPS, YAHOOMAPS ANDOPENSTREETMAP.
would allow relevant information withdrawal from a massive, widely available database of satellite/airborne images and the possibility to perform content-based image retrieval (CBIR) tasks [9], which are of great interest for the exploitation of this database and others for satellite/airborne images.
In this paper, we describe a web-based system (which repre-sents a follow-up of our previous work in [10]) that allows an inexperienced user to perform an unsupervised classification of satellite/airborne images obtained via Google Maps. Specifi-cally, our web-based system incorporates a fully unsupervised processing chain based on two well-known clustering tech-niques: ISODATA [11] and k-means [12], followed by spatial post-processing based on majority voting [13]. The processing chain has been implemented in C language and integrated into our proposed tool using open standards and free software tools including HTML5, JavaScript, Php, AJAX, and other web-based programming languages.
In our previous work [10], the tool was implemented as a desktop system and developed in JAVA. The main drawbacks resolved were:
• The image acquisition with the API (only compatible with web applications) is now much faster and efficient be-cause we obtain the image directly, a full mosaic compared with the library swingX-WS, in which we had to manually create the mosaic. In all cases (following the Google Maps terms of service), we do not remove the watermarks, which are visible when using the API. In our tests we have ex-perienced that the watermarks generally do not affect the classification results from a general point of view. • A very important added functionality of our newly
devel-oped tool is the fact that it exploits a remote server to speed up the processing of large images at different zoom levels versus the previously available desktop system, in which large images are very slow to be processed. In the future we are planning to incorporate high performance computing functionalities [14]–[18] to the remote server using GPU technologies [19]–[25].
• The ability to combine and change the color of the class labels and process images at different zoom levels allows the tool an improved interaction with the user who is now able to supervise thefinal result.
• Last but not least, we highlight theflexibility of our pro-posed system since it can be easily extended to other map servers and software platforms. In this regard, our system
has been designed in a way that it would easily allow re-placement of map servers and software implementations following a highly modular design.
The previous functionalities are necessary to use efficient techniques for image classification and the incorporation of con-tent-based image retrieval (CBIR), which are main goals in both systems. Regarding the availability of other client/server system designs for remote sensing data processing, we are aware of de-velopments in the CBIR domain such as the KIM4system (de-veloped by the European Space Agency). Although, we are not aware of similar systems being able to provide fast, scalable and advanced data processing of remotely sensed imagery with high spatial resolution, such as those provided by our application.
The remainder of the paper is organized as follows. Section II describes the system architecture, including relevant aspects such as the map, server and client layers. Section III describes the processing chain implemented by the proposed method-ology, including aspects such as the image acquisition process, the graphical user interface (GUI) that allows end-users to interact with the proposed system, the image processing algo-rithms implemented, and the procedure adopted for data saving and end product distribution to the users. Section IV performs an experimental validation of the classification results obtained by the proposed system by comparing the classification accu-racy of the proposed chain in terms of the techniques available in the well-known Environment for Visualizing Images (ENVI) software package5. Finally, Section V concludes the paper with some remarks and hints at possible future research.
II. SYSTEMARCHITECTURE
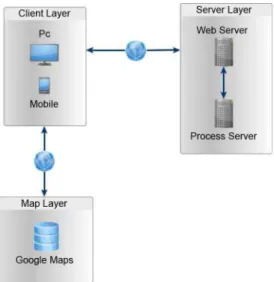
This section describes the architecture of the system, dis-played in Fig. 1. It is a web application comprised of several layers or modules. Each module serves a different purpose, and the technology adopted for the development of the system is based on open standards and free software. A combination of these has been used for the development of the system.
As shown by the architecture model described in Fig. 1, the proposed system can be described from a high level viewpoint using three different layers, which are completely independent from each other. Due to the adopted modular design, any of the layers can be replaced. Also, the system is fully scalable,
4http://rssportal.esa.int/deepenandlearn/tiki-index.php?page=KIM+Project 5http://www.exelisvis.com/language/en-us/productsservices/envi.aspx
Fig. 1. Architecture of the proposed system expressed in the form of different modular layers.
allowing for the incorporation of additional layers and ad-ditional data processing algorithms that can be included in the form of components into our framework. This is done in user-transparent fashion, and the modular design of processing algorithms in the form of components (which receive data as input and provide processing results) allows for the incorpora-tion of addiincorpora-tional components in scalable fashion and without the need to modify the proposed system, only the pool of data processing algorithms in the compute server. Moreover, the de-sign of the system in the form of layers (map, client and server) allows for the incorporation of additional resources in each of the layers without modification of the system. A good example is the possibility to incorporate additional compute resources such as GPUs, or even additional map servers, which are fully supported by our current implementation of the system.
The communication between two layers is carried out over the Internet via the hypertext transfer protocol (HTTP)6. As a result, the system performance will depend largely (as expected) on the available bandwidth. Both the map layer (currently provided by Google Maps) and server layer (by ourselves) are available from any location in the world. We describe each layer adopted in detail next.
A. Map Layer
This layer contains the source imagery data to be used by the system, i.e., the image repository. Google Maps is used in the current version by means of the Google Maps API V3 as a pro-gramming interface intended for accessing the provided maps. The current framework is limited to the types of maps provided by Google Maps. All types of maps provided by the API V3 can be used, including roadmaps (2D mosaics), satellite/airborne images, hybrid view (mixed satellite/airborne images and roadmap, superimposed), or terrain (physical relief). Also, all the potentials and functionalities provided by the Google Maps API V3 are included (this comprises management of zoom levels, image centering, location by geo-spatial coordinates, etc.)
6http://www.w3.org/Protocols/
Although Google Maps is now used by our system as a reitory of images, the system is open and could support other pos-sible alternative or complementary repositories such as Yahoo Maps or OpenStreetMap (thus associating map data and meta-data to satellite/airborne imagery available in other reposito-ries). These systems are all accessible free of charge and are easy to include in our proposed platform. In fact, the image repository can be used to capture any satellite/airborne images displayed by the Google Maps engine, and most importantly the images can be captured at different zoom levels. Even a single image can be extracted at different zoom levels, which is obtained by different image sizes and resolutions. This feature offers signifi-cant advantages in the accurate analysis of geo-registered satel-lite/airborne imagery at different resolutions [26].
B. Server Layer
The server layer is one main component in the system. It is formed by two sub-modules: web server and compute server. The former is the part of the system hosting the source code of the application (developed using HTML5, Php, JavaScript and CSS) and deal with the incoming traffic and requests from client browsers. We have used the Apache web server due to its wide acceptance, performance, and free-of-charge license. Further, Php is used both in the server layer and also for managing the communications between the clients and the web server (mainly dominated by the transmission of satellite/airborne imagery to be processed), and the web server and the compute server (in-tended for the processing of satellite/airborne images).
The compute server is mainly in charge of the actual image processing tasks which comprise clustering using k-means [11] and ISODATA [12] algorithms, and spatial post-processing [13]. The compute server receives the processing requests from end-users, manages them effectively by resorting to exploit a remote server (in the future, we will use the GPU cluster made up of 44 NVidia Tesla C1060 GPUs7connected to this server by means of efficient OpenCL implementations will be pursued), and then provides the obtained result to the end-user. The web server and the compute server are currently hosted on the same machine, which in our case is motivated by the fact that the processing capacity of the server was experimentally observed to be high enough to support also the computational demands introduced by the map layer, but the system also allows to have different machines for this purpose, allowing for incorporation of additional processing modules other than ISODATA, k-means and spatial post-processing.
C. Client Layer
The client layer defines the interactions between the user (through an internet browser) and our system. Only one web page is needed as user interface thanks to the adopted AJAX and JavaScript technologies, which allow for the web interface update without the need for interactions with the web server. At this point, it is important to emphasize that AJAX is a programming method (not a piece of software) and that it is built on Javascript (not a standalone programming language). The design of the web interface has been done using jQuery UI,
FERRÁNet al.: A WEB-BASED SYSTEM FOR CLASSIFICATION OF REMOTE SENSING DATA 1937
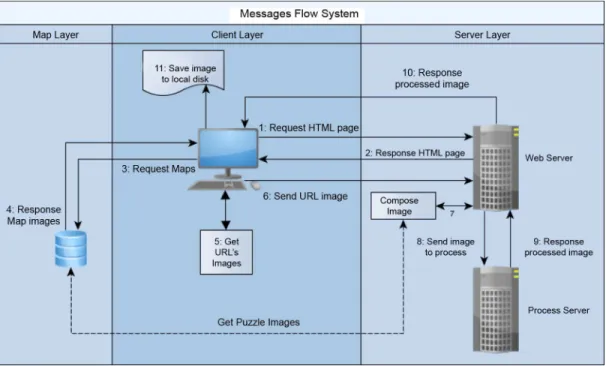
Fig. 2. Interactions between the three main layers (map, client and server) of our system.
which provides built-in JavaScript modules that are attractive, easy to use and freely available. The interaction betwen the user and the client web interface is captured by the event handlers of the jQuery libraries, and executed at the local browser as JavaScript, only run on the browser in our implementation.
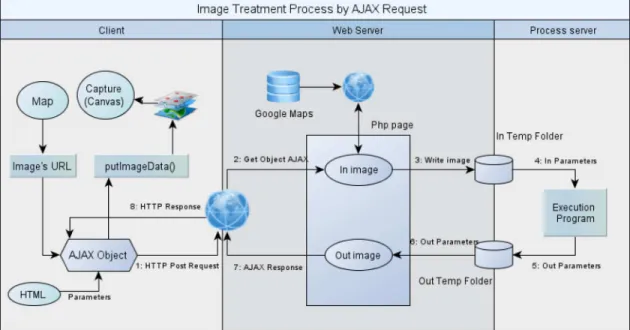
The only user-based actions transmitted to the server layer are those related to the processing of satellite/airborne images. In this context, the images to be processed are transmitted to the server using AJAX-based requests, and the web server pro-vides such requests to the compute server (in our case, imple-mented in the same machine) so that the compute server can process the images very efficiently and produce a result that is then transmitted back to the client layer. This process is illus-trated in Fig. 2, which also shows how the client layer performs requests to the map layer in order to update the maps which are being handled by the end-user. This step comprises operations such as zooming, changing of location in the map, creation of maps, and selection of the specific view in which the processing will be accomplished (satellite, roadmap, hybrid, etc.).
In order to understand the interactions between the different layers of our system (see Fig. 2), an example is provided next about theflow of a processing request started by the client in the system and the different steps needed until a processing result is received by the end-user. The following steps are identified in Fig. 2:
1) First, the client starts the use of the system by requesting a web page from the local internet browser. This results in an HTTP request to the web server.
2) The web server receives this request and provides the client with an HTML web page and all necessary refer-ences (JavaScript libraries, CSS, etc.)
3) At this point, the client requests from the map server the information needed to perform the map modification lo-cally (i.e., zooming). This operation is transparent to the
system, and the requests are performed via messages from the client to the map server.
4) The map layer returns the information requested by the client in the form of updated maps that will be locally man-aged by the end-user.
5) A capture with all the URL addresses associated to each portion that compose the full map is performed to send this information to the web server. This process is locally managed at the client by means of JavaScript functions. We emphasize that the end-user can decide the zoom level and the image view (street, satellite, hybrid, etc.) of the map image to be processed.
6) Now, the Universal Resource Locator (URL) addresses as-sociated to each portion of the full image are sent to the web server by means of AJAX functions and asynchronous resquests. In this way, the interaction with the application at the client layer can continue while the packet is being transferred to the server.
7) The web server composes the full image by accessing to the Google Maps repository.
8) The web server provides the image to be processed to the compute server. Our system thus delegates the processing task to an independent remote server system that takes care of the processing task independently from other layers in the system.
9) Once the image has been processed, the compute server returns the obtained result to the web server. In our cur-rent implementation both the web server and the compute server are implemented in the same machine, hence in this case the communications are minimized.
10) Finally, the processing result is returned to the client so that it can be saved to disk as thefinal outcome of the adopted processing chain.
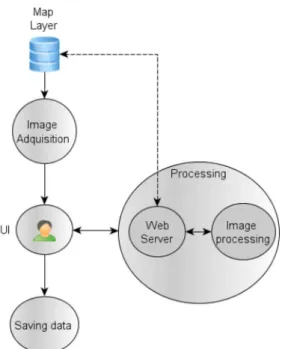
Fig. 3. Flowchart describing the methodology adopted for the development of the system.
III. METHODOLOGY
This section describes the methodology adopted for the development of the proposed system. Several main tasks have been identified: image acquisition, graphical user interface (GUI), web server, image processing and image saving. These tasks, summarized in the flowchart given in Fig. 3, will be described in detail in this section.
A. Image Acquisition
Image acquisition is the starting point of the system opera-tion. The images to be processed are considered from two dif-ferent viewpoints. On the one hand, the images are parts of a map and, on the other, the images can be considered as specific captures or snapshots of a larger map. The maps are dynamic entities that can be dragged, zoomed (i.e., displayed in more or less detail), but the captures can be seen as static parts of a map which are selected by the end-user via the interface. These cap-tures or snapshots can then be sent to the server and processed in spite of the components of the map layer, in our case supported by the Google Maps engine.
The methodology implemented in our system for the image capture retrieval from the map layer has been developed using JavaScript libraries. These processes have access to the collec-tion or “puzzle” of images that compose a certain map, thus taking advantage of the browser’s cache memory to optimize such an operation. The query is directed to the map layer in case that the image is not already in the cache memory (a situa-tion that seldom occurs). This opsitua-tion leads to some advantages, mostly to high speed achieved by the system in the task of image captures regardless of the latency of communications with the server. This feature reduces the communication traffic and in-creases the performance in the local management of image cap-tures.
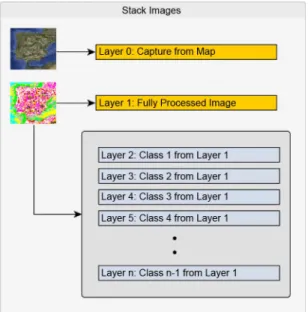
In order to achieve such a functionality, several layers of im-ages from the server are considered once the image captures
Fig. 4. Flowchart describing the strategies adopted for managing image cap-tures.
have been processed, thereby obtaining a stack of images in which each layer represents a class (as determined by the con-sidered processing algorithms, i.e., k-means and ISODATA). The layers are completely independent, thus allowing visualiza-tion as individual entities or as a combinavisualiza-tion between layers, providing greatflexibility in the analysis of the obtained results and a specific management of layers. Finally, the system also al-lows for the rapid acquisition of multiple captures from the same map, along with the simultaneous operation of multiple maps. Fig. 4 shows the strategy adopted by our system for image cap-ture management.
B. Graphical User Interface (GUI)
GUI is important because it is the visible part of our system and allows the user to perform all operations available in the application. An HTML page and JavaScript libraries have been used for development. These libraries are the jQuery framework (version 1.6.2) and jQuery-UI (version 1.8.16). Other developments using JavaScript libraries have been ac-complished in order to add new functionalities to the created widgets. As the whole GUI runs on the client layer, usability and speed of response are guaranteed, and the adopted design is veryflexible. The GUI has been developed in the form of a
FERRÁNet al.: A WEB-BASED SYSTEM FOR CLASSIFICATION OF REMOTE SENSING DATA 1939
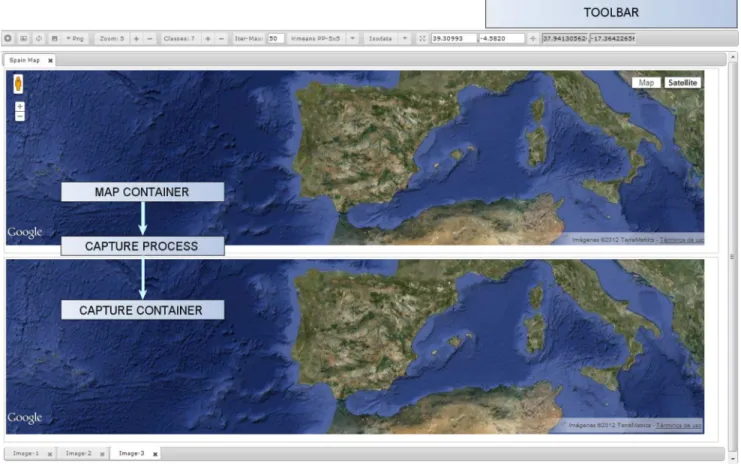
Fig. 5. Graphical user interface in the application.
single HTML page, avoiding repeated requests and responses back to the server.
Several features within the HTML5 standard have been used in order to design the GUI for our system application. The most important object used is the canvas, which allows for an efficient management of the images to be processed. Pixel-level access to the content of a canvas object is possible, thus largely simpli-fying the implementation of image processing operations. The container can carry out map captures (snapshots), to access the information of each pixel of the capture, to transfer all such in-formation to the server layer, and to save the obtained informa-tion (processed images). As noted above, a stack of images is obtained as an outcome with as many layers as the classes iden-tified by the processing algorithms k-means and ISODATA. The obtained layers can be merged in order to simplify the interpre-tation of the obtained results.
To achieve the aforementioned functionality, the only re-quirement at the client layer is the use of browsers that support HTML5. Some browsers currently support some (but not all) of the features in HTML5. One of the key features that client browsers must support in the context of our application is the so-called attribute crossOrigin of the image object in HTML8. Should this feature not be supported, the application will display a security error and will not work correctly.
Our application is fully accessible from mobile devices: al-though the application is developed to be accessed primarily from a PC browser, it is also operational on mobile applica-tions, such as smartphones or tablets, as far as these devices use
8http://www.w3.org/TR/cors
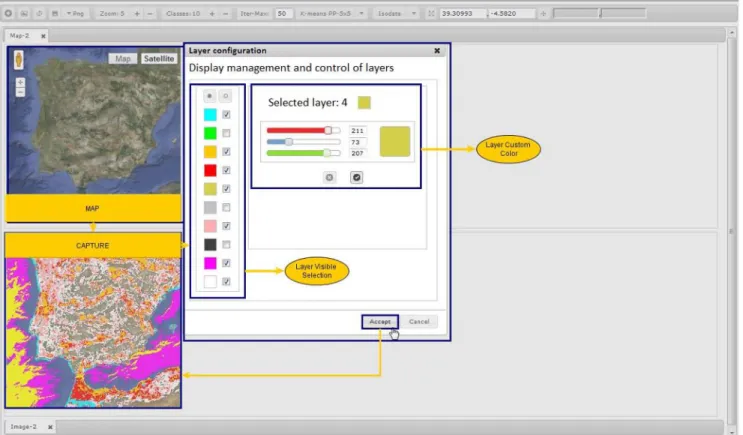
browsers that support HTML5. Fig. 5 shows an example of the designed GUI, designed for simplicity purposes. It consists of a single web page with a working panel, a container of maps, and a capture container. The work panel features the creation of maps, the update of a map’s captures, the zoom level shift, and the selection of processing parameters for the k-means, ISO-DATA and spatial post-processing algorithms implemented for image analysis tasks in the current version. The map container can hold multiple maps of individual sizes, while the capture container allows for several captures of the same map. Different captures of the same map always have the same size as the orig-inal map size.
Finally, Fig. 6 provides a display of our application. Different layers are managed in this case. In this screenshot, we aim to ex-emplify how an image has been processed and several classes have been identified by one of the considered processing algo-rithms. The system can let users show, hide and merge different classes identified by such processing algorithms. The colors as-sociated to these classes can also be edited and customized. The layers can be superimposed on the original image (cap-ture) to be processed, thus generating afinal product which com-prises an unsupervised classification of a certain area whose lo-cation, size, dimensionality, zoom level, etc. are defined by the end-user.
C. Image Processing
Two different modules deal with image processing in our system. First, the web server receives the URLs corresponding to the portions of the image to be processed, then composes
Fig. 6. An example illustrating the management of different layers in the application.
the full image and processes it with the methodologies imple-mented in the system, and then forwards the obtained result to the client layer. Secondly, the compute server processes the image effectively (e.g., applying the considered clustering and spatial post-processing algorithms). The image processing tasks are described next at both layers, and in particular, the method for image processing request management is explained.
1) Handling Image Processing Requests: The main task of
the web server is to receive requests from clients. Such requests are handled as follows. First, the client selects the image capture to be processed and a function gets the URL of each portion in order to compose the full image. In this way the information needed to compose the full image can be encapsulated into an AJAX request together with all processing options, and sent to the web server asynchronously using the HTTP protocol, and specifically a function called post.
Once the web server has received the full request, a Php function creates an image from the URL received and then ob-tains the parameters needed to accomplish the processing task (number of classes, number of iterations, etc.) Then the com-pute server assigns a timestamp to the image to identify it as a unique entity. The image is stored onto a temporary folder, and the web server calls the compute server indicating the location and unique identification of the image, so that the data can be efficiently processed by the compute server (both the web server and compute server can access the image structure and its par-ticular location). Finally, the compute server generates a final product (in our case, the processed image) from the information received, and stores the output on another temporary location. After the processing task has been completed, the web server takes control again. It collects thefinal product generated by the
compute server and sends it to the client in response to the orig-inal AJAX request originated at the client layer, thus closing the communication cycle with the client that originated the request.
2) Performing the Actual Image Processing Task: Next we
describe in more detail how the actual image processing task is performed at the compute server. C language is used to per-form the analysis of the input image, thus producing a final product (processed image) which is stored on a different lo-cation. As described above, the communication between the system layers (i.e., the different modules that compose the de-sign of our system) is performed using system calls from the web server to the compute server. This is done by an asyn-chronous call using the method POST of AJAX. The call is re-ceived by the web server, which creates a new processing thread and performs a call to the compute server using sentences from the operating system. In our case, these sentences are simple invocations to the processing software using input (image to be processed) and output (processed image) parameters as
fol-lows: . The processing
thread now simply awaits thefinalization of the processing task and returns the obtained result to the web server. Since each thread is independent from each other, there are no possible con-flicts between different operating system calls. This is because the writeoperations in disk are independent as a result of the fact that unique image identifiers (timestamps) are used. Cur-rently our system only uses one CPU and, hence, the signaling can still be handled in a conventional way.
Fig. 7 summarizes the whole image processing strategy adopted by our proposed system, from the receipt of the URLs that allow for the composition of the full image, to the gen-eration of an AJAX request in order to start the processing
FERRÁNet al.: A WEB-BASED SYSTEM FOR CLASSIFICATION OF REMOTE SENSING DATA 1941
Fig. 7. A summary of the whole image processing strategy adopted by our proposed system.
Fig. 8. Processing example, using the proposed system, of a Google Maps image of the Iberian Peninsula. The example shows that the classification can be refined by merging classes.
cycle at the web server, and ultimately to the execution of the request and the compute server, and the provision of thefinal product (processed image) back to the client that initiated the request. An importantfinal step of the process is to overlay the final product with the original image to be processed. This is done at the client, once the processing cycle has beenfinalized. The method used to perform this task is putImageData, also a method of the canvas object. Fig. 7 reveals a modular design with clearly defined interactions between the different layers of the system.
Finally, Fig. 8 shows a processing example of an image cap-tured from Google Maps corresponding to the Iberian Penin-sula. As indicated in Fig. 7, many classes could be identified in the considered test case, including different ones in the water areas. The combination of classes (functionality included in the system) can lead to improved results by joining different classes (e.g., belonging to water).
3) Saving the Final Results: This part specifies howfinal
results are saved, as this requires a special treatment in the im-plementation. Specifically, the generated product is not stored on any server when the processing is completed, and it is only located in the local memory of the browser at the client. The results can be expressed in different forms, e.g., as a processed image, as a collection of layers that can be superimposed with the original data set, or as a combination of both. Two specific actions are taken:
1) A JavaScript library (called canvas2image) saves the con-tents of the canvas object on the local device using different image formats, such as JPEG, PNG or Bitmap.
2) The combined result is saved after putting together dif-ferent layers of the results inside the canvas object by ap-plying another canvas container which integrates all the data layers to be displayed. Once the image is saved, the initial container is not retained. This process is transparent
Fig. 9. Structure of the canvas object that contains the initial image to be pro-cessed and the outcome of the processing.
to the user and is also optimized from the viewpoint of computational performance. Fig. 9 displays the content of a canvas object, which is the container of both the orig-inal image capture and processed image, decomposed in the form of different layers after the processing is com-pleted.
IV. EXPERIMENTALRESULTS
This section describes the experimental validation of our developed system by using satellite/airborne images obtained from Google Maps across different locations. The validation is conducted by means of the following steps:
1) An experiment with the k-means unsupervised classifi-cation algorithm by selecting a satellite image over an urban area (Pavia city, Italy). This choice represents a challenging classification scenario due to the presence of complex urban features. The validation has been conducted by evaluating the agreement between the clas-sification results provided by our implemented version of k-means in relation to those available in the well-known ENVI commercial software package. We adopt the same parameters when running our implementations as those available in the ENVI package.
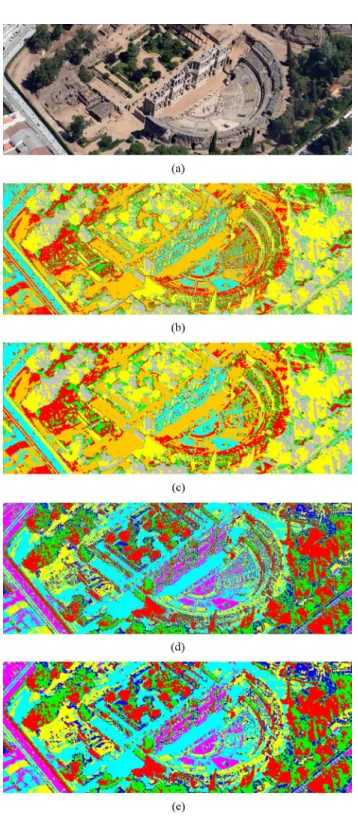
2) The second experiment is a similar analysis, but this time based on a satellite image collected over the city of Mérida, Spain. This area contains archeological re-mains from Roman times, thus probed to examine how the web-based tool can work in the context of arche-ological-oriented remote sensing applications. In this experiment, we also evaluate the impact of using the ISODATA algorithm and spatial post-processing over the considered processing chain based on a visual assessment of the classification results obtained.
3) Thefirst two tests used Google Map images, obtained at the highest level of zoom available, whereas in the third exper-iment, a satellite image is obtained over the Amazon river in South America by using a higher zoom level that seeks
to evaluate our tool when processing much larger areas of the Earth’s surface. In this experiment we also evaluate the computational performance of the server-client architec-ture developed for the fast processing of massive data sets.
A. Experiment 1: Validation of the K-means Unsupervised Classification Algorithm
For this experiment, Pavia, Italy [see Fig. 10(a)] represents a challenging classification scenario due to the presence of com-plex urban features. The spatial resolution of the image is ap-proximately 1.2 meters per pixel. Fig. 10(b) shows the unsuper-vised classification result obtained by the proposed processing chain, using the well-known k-means algorithm, implemented to search for a total of clusters [12]. No spatial post-pro-cessing is performed, thus the spectral clustering performance of the algorithm takes place without any spatial information.
Fig. 10(c) shows the classification result obtained by the k-means algorithm implemented by Research Systems ENVI software, using also classes. As shown by comparing Figs. 10(b) and 10(c), the color labels obtained in the different classification results are different, but the classification maps provided by our processing chain applied to the original satel-lite image in Fig. 10(b) and by ENVI’s implementation of k-means in Fig. 10(c) are similar. Table II reports the classifi-cation agreement (in percentage) [3] measured after comparing our processing chain result, based on k-means classification, with the one obtained by ENVI (assuming the latter as the reference). As shown by Table II, the agreement between the obtained classification maps is always very high regardless of the labeling of the classes. This is also confirmed by the confusion matrix [24] displayed in Table III. This experiment reveals that our k-means classifier is very similar to the one available in the commercial (ENVI) software.
B. Experiment 2: Validation of the ISODATA Algorithm With Spatial Post-Processing
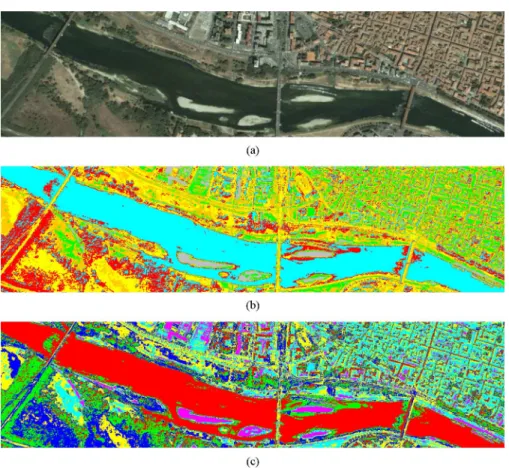
In this second experiment, the satellite-based image taken of Mérida, Spain [see Fig. 11(a)], offers a high spatial resolution of approximately 1.2 meters per pixel. The image was collected over the Roman Theater of Mérida (dating back to 16 – 15 BC, but renovated later on). The theatre is located in one of the most extensive archaeological sites in Spain. It was declared a World Heritage Site by UNESCO in 1993. The theatre was located at the edge of the Roman city near the walls. The grandstand con-sists of a semicircular seating area (cavea), with a capacity for 6,000 spectators eventually divided into three areas: the lowest tier called the ima cavea (22 rows), the medium tier called the media (5 rows), and a top tier called the summa, this one in less good condition. The Roman theater is the most visited monu-ment in the city, and its festival classic theater is performed for thefirst time in 1933 and still continues today.
This monument has been chosen as an example of remotely sensed archeology, and we have decided to enhance a view offered by Google Maps to improve the visualization of the structure and the scale of this relevant monument for the re-gion. Figs. 11(b) and 11(c) respectively show the unsupervised classification results obtained from our processing chain using the ISODATA algorithm and the classification obtained from
FERRÁNet al.: A WEB-BASED SYSTEM FOR CLASSIFICATION OF REMOTE SENSING DATA 1943
Fig. 10. (a) Satellite image collected over the city of Pavia, Italy (b) Classification using our processing chain implemented with k-means and classes (c) Classification using ENVI’s k-means implemented with the same parameters.
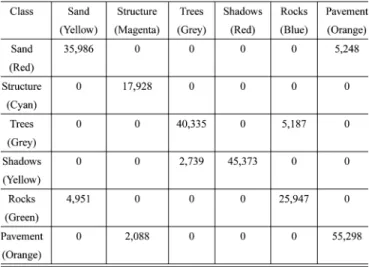
applying spatial post-processing (using a processing window of 3 3 pixels) over the classification result obtained from Fig. 11(b). Figs. 11(d) and 11(e) respectively show the un-supervised classification of the ISODATA algorithm and the classification obtained from applying spatial post-processing using the same parameters and the ones obtained from our implementation.
In this experiment, afixed number of and a window size of 3 3 pixels have been considered. Also, although the color class labels for the implementations are different, the clas-sification map provided by our implementation (without spatial post-processing) and the ones obtained using ENVI are very similar. In both cases, the algorithm parameters have been set to exactly the same values. Table IV reports the classification per-centages of agreement measured after comparing our ISODATA classification maps with and without to apply a spatial post-pro-cessing. As shown by Table IV, the agreement between the maps is always very high (about a 90%). The confusion matrices for ISODATA and ISODATA with a spatial post-processing are re-spectively provided in Tables V and VI. With this example, the potential of our proposed tool for perform classification with and without applying a spatial post-processing over a satellite image is shown.
C. Experiment 3: Performance of the Client-Server Architecture
This third test assesses the performance of the system in terms of computational cost and processing time. The experiment con-sists of two main parts. First, we evaluate the performance of
the proposed application using a web-based server and three different client configurations (medium, high, and very high quality of Internet access). Then, we discuss the impact of using a local compute server or a remote server in the experiments. A satellite image is collected over the Amazon river in South America, using different zoom levels to illustrate the impact of the parameters from the two previous experiments when per-forming the image capture (snapshot) in the Google Maps en-gine. The comparison is simply intended to illustrate the putational advantages that can be gained by using a remote com-pute server with regards to the case in which local processing is performed in a desktop computer.
Fig. 12(a) shows the image to be processed at a given zoom level. Fig. 12(b) shows the obtained processing result, using the k-means algorithm with classes and without spa-tial post-processing. Table VII summarizes the different zoom levels that will be considered in this scene. The table indicates the spatial resolution of each image (depending on the consid-ered zoom level) and the size in MB of the captured image at each zoom level. Before describing the obtained timing re-sults, we summarize in Table VIII the client-server configu-rations adopted in our experimental evaluation. The table de-scribes three different scenarios given by different processing speeds, where the “Home PC” scenario can be considered as medium quality, the “Work PC” scenario as high quality, and the “UEX LAN” scenario (here, the abbreviation ”UEX” refers to ”University of Extremadura”), as very high quality (in terms of bandwidth transmission). All the previous scenarios make use of a remote server called “CETA-Ciemat”.
TABLE II
PERCENTAGE OFAGREEMENT(INTERMS OFINDIVIDUALCLASSES ANDFROM AGLOBALPOINT OFVIEW) AFTERCOMPARING THECLASSIFICATION MAP IN FIG. 10(B), PRODUCED BY OURTOOL(WITH THEK-MEANSALGORITHM) WITH THECLASSIFICATION MAP INFIGS. 10(C), PRODUCED BYENVI.
Fig. 11. (a) Satellite image collected over the Roman city of Mérida, Spain (b) Classification using our processing chain with ISODATA (c) Classification using ENVI’s ISODATA (d) Classification using our processing chain with ISO-DATA with spatial post-processing (e) Classification using ENVI’s ISOISO-DATA with spatial post-processing.
Fig. 13 compares the timing results obtained in the three con-sidered scenarios (Home PC, Work PC and UEX LAN) with and without spatial post-processing. As Fig. 13 suggests, processing time depends on the type of internet connection. Secondly, pro-cessing time depends largely on image size. As indicated in Fig. 13, this time will grow significantly as the zoom level be-comes more detailed, in particular for the medium-quality sce-nario. Finally, it is also clear from Fig. 13 that spatial post-pro-cessing increases execution time but not significantly, regardless of the quality of the connection available.
In all cases, we can observe how processing complexity in-creases with image size (i.e., with the considered zoom level). Spatial post-processing does not significantly increase computa-tional complexity (despite the relatively large size of the spatial window adopted, with 7 7 pixels). Another important obser-vation is that, as the quality of the used configuration increases, processing times significantly decreases, though the proposed system performs suitably in all cases. This fact illustrates the portability of the proposed system to different quality configu-rations.
Finally, a comparison is made between the processing time invested by the proposed system to perform the same image processing task described if the compute server is implemented locally versus the implementation in which the compute server is run on a remote machine. Fig. 14 shows the processing times measured for the considered image processing scenario when the compute server is executed locally (in “Home PC”) and with a remote server system (using the “Server CETA-Ciemat”).
After comparing Figs. 14(a) and 14(b), the significant im-provements achieved by implementing the compute server as a remote server can be observed, which reduces the processing times significantly. These improvements are detailed below: 1) If the compute server is implemented locally, the processing times are always much higher than if using a remote server, even if the local processing removes communication times over the network, as all the work is done on the same machine; and 2) the larger the image size, the higher the times measured for the local processing while the remote processing times do not in-crease so significantly. This observation demonstrates that the use of a dedicated (remote) compute server, offers important ad-vantages from the viewpoint of the computational efficiency of the considered application. In this case, a LAN connection is recommended in order to keep the communication times within reasonable levels.
V. CONCLUSIONS ANDFUTURERESEARCHLINES
This paper has described a web-based system for compu-tationally efficient processing of satellite/airborne images. The system, developed with the Google Maps applications
FERRÁNet al.: A WEB-BASED SYSTEM FOR CLASSIFICATION OF REMOTE SENSING DATA 1945
TABLE III
CONFUSIONMATRIXOBTAINEDAFTERCOMPARING THECLASSIFICATION MAP INFIG. 10(B), PRODUCED BY OURSYSTEM(WITH THEK-MEANSALGORITHM) WITH THECLASSIFICATION MAP INFIG. 10(C) PRODUCED BYENVI.
TABLE IV
PERCENTAGE OFAGREEMENTAFTERCOMPARING THECLASSIFICATION MAP INFIG. 11(B), PRODUCED BY OURTOOL(WITHISODATA), WITH THE CLASSIFICATION MAP INFIG. 11(D), PRODUCED BYENVI,ANDAFTERCOMPARING THE MAP INFIG. 11(C) PRODUCED BY OURTOOL(WITHSPATIAL
POST-PROCESSING) WITH THECLASSIFICATION MAP INFIG. 11(E) PRODUCED BYENVI (ALSOWITHSPATIALPOST-PROCESSING).
TABLE V
CONFUSIONMATRIXOBTAINEDAFTERCOMPARING THECLASSIFICATION MAP INFIG. 11(B), PRODUCED BY OURSYSTEM(WITHISODATA) WITH THE MAP
INFIG. 11(D), PRODUCED BYENVI.
programming interface (API), incorporates functionalities such as unsupervised classification for image portions selected by the user (at the desired zoom level) using the k-means and ISODATA clustering algorithms, followed by spatial post-pro-cessing. Most importantly, the processing of satellite/airborne images is conducted by means of a centralized server which receives the image to be processed, performs the analysis
TABLE VI
CONFUSIONMATRIXOBTAINEDAFTERCOMPARING THECLASSIFICATION MAP INFIG. 11(C), PRODUCED BY OURSYSTEM(WITHISODATA PLUSSPATIAL POST-PROCESSING), WITH THECLASSIFICATION MAP INFIG. 11(E), PRODUCED
BYENVI.
efficiently, and returns the classification result to the end-user. This represents an improvement over a previous development desktop application presented in [10]. The system has been im-plemented using a modular design which allows for the future incorporation of full multi-GPU functionality (using OpenCL implementations) in order to expand its processing capabilities.
Fig. 12. (a) Satellite image collected over the Amazon river in South America. (b) Classification using our processing chain with k-means.
TABLE VII
DIFFERENTZOOMLEVELSCONSIDERED IN THEEXPERIMENTSWITH A SATELLITEIMAGEOVER THEAMAZONRIVER INSOUTHAMERICA AND
AVAILABLE INGOOGLEMAPS.
Fig. 13. Comparison of the timing results obtained in the three considered sce-narios (Home PC, Work PC and UEX LAN) with and without spatial post-pro-cessing.
This would require a further evaluation of the possibility to perform the computation in distributed fashion, accompanied of a comparison in terms of energy consumption to determine the efficiency of the used server setups. Our experimental results,
Fig. 14. Comparison of the timing results obtained by the proposed system when the compute server is implemented as a local machine or as a (remote) server.
conducted by comparing the obtained classification results with those provided by commercial products such as the popular ENVI software package, reveal that the proposed web-based tool provides classification maps with high similarity in rela-tion to those provided by ENVI for the same satellite/airborne imagery, but with the possibility to perform the classification of any image portion available in the Google Maps engine. However, in future developments we are planing on using the overlays available in Google Maps API to superimpose the outcome of the classification process (possibly with different transparency levels) on the original satellite/airborne imagery provided by Google Maps.
In the future, our optimal scenario would be to validate the classification accuracies that can be achieved by the proposed system in comparison to some ground-truth data or other su-pervised classification methods. However, ground-truth data are very difficult to obtain in practice and we could not obtain such information registered to the Google Maps data used by the pro-posed system. Hence, in this work we decided to use the agree-ment with the classification results provided by the same algo-rithms implemented in a widely used and highly consolidated software tool such as ENVI as an indicator of the performance of our system in classification tasks. The obtained agreements were very high, indicating that our system can provide classi-fication results which are similar to those already provided by commercial software. In addition, we also plan to incorporate other advanced classifiers to the proposed web-based system,
FERRÁNet al.: A WEB-BASED SYSTEM FOR CLASSIFICATION OF REMOTE SENSING DATA 1947
TABLE VIII
DIFFERENTSCENARIOSUSED IN THECOMPUTATIONALPERFORMANCEEVALUATION OF OURSYSTEM.
such as Random Forests (RFs) and Support Vector Machines (SVMs). We are also considering the inclusion of alternative data sources without watermarks (e.g., Bing Maps) following a highly modular design. We are also planning on separating the web server and the processing server functionalities in order to make our design more modular and also to guarantee security (it would be highly desirable to have a design in which the compute server only has access to the web server and cannot be externally accessed. On the other hand, we would like to extend the devel-oped tool with the incorporation of CBIR functionalities. For that purpose, the strategy will be based on a query system linked to feature extraction from an image repository (such as Google Maps or other maps server). The retrieved features (which will comprise shape descriptors, texture features, etc.) will be stored on a database of features and used to compare the feature vector of the input query with those recorded by means of a similarity function. This facility will provide a result to the end-user in the form of image portions (across different locations) that have enough similarity in relation to the features of the input query. An immediate research focus would thus be the integration of a CBIR architecture in our system.
ACKNOWLEDGMENT
The authors gratefully thank CETA-Ciemat Supercomputing Center in Trujillo, Spain, for their technical support, and the ed-itors and reviewers for their outstanding comments and sugges-tions, which greatly helped to improve the technical content and presentation of the manuscript.
REFERENCES
[1] R. A. Schowengerdt, Remote Sensing: Models and Methods for Image Processing, 2nd ed. New York: Academic Press, 1997.
[2] D. A. Landgrebe, Signal Theory Methods in Multispectral Remote Sensing. New York: Wiley, 2003.
[3] J. A. Richards and X. Jia, Remote Sensing Digital Image Analysis: An Introduction. New York: Springer, 2006.
[4] M. Fauvel, J. A. Benediktsson, J. Chanussot, and J. Sveinsson, “Recent advances in techniques for hyperspectral image processing,”Remote Sens. Environ., vol. 113, pp. 110–122, 2009.
[5] A. Plaza, J. A. Benediktsson, J. Boardman, J. Brazile, L. Bruzzone, G. Camps-Valls, J. Chanussot, M. Fauvel, P. Gamba, J. Gualtieri, M. Mar-concini, J. Tilton, and G. Trianni, “Spectral and spatial classification of hyperspectral data using svms and morphological profiles,”IEEE Trans. Geosci. Remote Sens., vol. 46, no. 11, pp. 3804–3814, 2008. [6] E. Quirós, A. M. Felicísimo, and A. Cuartero, “Testing multivariate
adaptive regression splines (MARS) as a method of land cover clas-sification of Terra-Aster satellite images,”Sensors, vol. 9, no. 11, pp. 9011–9028, 2009.
[7] A. Cuartero, A. M. Felicísimo, M. E. Polo, A. Caro, and P. G. Ro-driguez, “Positional accuracy analysis of satellite imagery by circular statistics,” Photogramm. Eng. Remote Sens., vol. 76, no. 11, pp. 1275–1286, 2010.
[8] D. Tuia, F. Ratle, F. Pacifici, M. F. Kanevski, and W. J. Emery, “Active learning methods for remote sensing image classification,”IEEE Trans. Geosci. Remote Sens., vol. 47, no. 7, pp. 2218–2232, 2009.
[9] A. Plaza, J. Plaza, and A. Paz, “Parallel heterogeneous CBIR system for efficient hyperspectral image retrieval using spectral mixture analysis,”
Concurrency and Computation: Practice and Experience, vol. 22, no. 9, pp. 1138–1159, 2010.
[10] S. Bernabé, A. Plaza, P. R. Marpu, and J. A. Benediktsson, “A new parallel tool for classification of remotely sensed imagery,”Comput. Geosci., vol. 46, pp. 208–218, 2012.
[11] G. Ball and D. Hall, ISODATA: A Novel Method of Data Analysis and Classification, Stanford University, 1965, Technical Report AD-699616.
[12] J. A. Hartigan and M. A. Wong, “Algorithm as 136: A k-means clustering algorithm,”J. of the Royal Statistical Soc., Series C (Appl. Statist.), vol. 28, pp. 100–108, 1979.
[13] P. Gamba, F. Dell’Acqua, F. Ferrari, J. A. Palmason, and J. A. Benediktsson, “Exploiting spectral and spatial information in hy-perspectral urban data with high resolution,”IEEE Geosci. Remote Sensing Lett., vol. 1, pp. 322–326, 2005.
[14] A. Plaza and C.-I. Chang, High Performance Computing in Remote Sensing. Boca Raton, FL: Taylor & Francis, 2007.
[15] A. Plaza, D. Valencia, J. Plaza, and P. Martinez, “Commodity cluster-based parallel processing of hyperspectral imagery,”J. Parallel and Distributed Computing, vol. 66, no. 3, pp. 345–358, 2006.
[16] A. Plaza, J. Plaza, A. Paz, and S. Sanchez, “Parallel hyperspectral image and signal processing,”IEEE Signal Process. Mag., vol. 28, no. 3, pp. 119–126, 2011.
[17] S. Kalluri, Z. Zhang, J. JaJa, S. Liang, and J. Townshend, “Charac-terizing land surface anisotropy from AVHRR data at a global scale using high performance computing,”Int. J. Remote Sens., vol. 22, pp. 2171–2191, 2001.
[18] A. Plaza, “Special issue on architectures and techniques for real-time processing of remotely sensed images,”J. Real-Time Image Process., vol. 4, pp. 191–193, 2009.
[19] T. Balz and U. Stilla, “Hybrid GPU-based single- and double-bounce SAR simulationn,”IEEE Trans. Geosci. Remote Sens., vol. 47, no. 10, pp. 3519–3529, 2009.
[20] J. Mielikainen, B. Huang, and A. Huang, “GPU-accelerated multi-pro-file radiative transfer model for the infrared atmospheric sounding in-terferometer,”IEEE J. Sel. Top. Appl. Earth Observ. Remote Sens., vol. 4, no. 3, pp. 691–700, 2011.
[21] C. Song, Y. Li, and B. Huang, “A GPU-accelerated wavelet decom-pression system with SPIHT and Reed-Solomon decoding for satellite images,”IEEE J. Sel. Top. Appl. Earth Observ. Remote Sens., vol. 4, no. 3, pp. 683–690, 2011.
[22] S.-C. Wei and B. Huang, “GPU acceleration of predictive partitioned vector quantization for ultraspectral sounder data compression,”IEEE J. Sel. Topics Appl. Earth Observ. Remote Sens., vol. 4, no. 3, pp. 677–682, 2011.
[23] C.-C. Chang, Y.-L. Chang, M.-Y. Huang, and B. Huang, “Acceler-ating regular LDPC code decoders on GPUs,”IEEE J. Sel. Topics Appl. Earth Observ. Remote Sens., vol. 4, no. 3, pp. 503–507, 2011. [24] A. Plaza, Q. Du, Y.-L. Chang, and R. L. King, “Foreword to the special
issue on high performance computing in earth observation and remote sensing,”IEEE J. Sel. Topics Appl. Earth Observ. Remote Sens., vol. 4, no. 3, pp. 503–507, 2011.
[25] C. A. Lee, S. D. Gasster, A. Plaza, C.-I. Chang, and B. Huang, “Recent developments in high performance computing for remote sensing: A review,”IEEE J. Sel. Topics Appl. Earth Observ. Remote Sens., vol. 4, no. 3, pp. 508–527, 2011.
[26] J. L. Moigne, N. S. Netanyahu, and R. D. Eastman, Image Registration for Remote Sensing. New York: Cambridge University Press/Wiley, 2011.
[27] H. G. Lewis and M. Brown, “A generalized confusion matrix for as-sessing area estimates from remotely sensed data,”Int. J. Remote Sens., vol. 22, no. 16, pp. 3223–3235, 2001.
Ángel Ferránwas born in Mérida, Extremadura, Spain, in 1975. He received the Technical Engi-neering Computer degree from the University of Extremadura (UEX) in 1999 and the Master of Engineering Computer degree from Polytechnic of Caceres (UEX) in 2012.
He joined “Proactiva Medio Ambiente” Madrid, Spain in 1999, as analyst-programmer in an inter-national project about computerized accounting. In 2003 he was in charge of that project. From 2005 to 2009 he worked as Sap Programmer in Extremadura Health Service. Since 2009 he worked in the development computer projects department of the Government of Extremadura. He is currently collaborating on researching projects with the Gim and HyperComp research groups at the Polytechnic of Caceres. His research interests include earth observations, remote sensing and web programming.
Sergio Bernabéreceived the Computer Engineer de-gree from the University of Extremadura, Caceres, Spain, and the M.Sc. degree from the same univer-sity. He is currently a joint Ph.D. between the Uni-versity of Iceland and the UniUni-versity of Extremadura, Spain.
He has been a visiting researcher with the Insti-tute for Applied Microelectronics, University of Las Palmas de Gran Canaria, Spain. His research interests comprise hyper/multi-spectral image analysis and ef-ficient implementations of large-scale cientific prob-lems on commodity Beowulf clusters and graphical processing units (GPUS).
Mr. Bernabe has served as a reviewer for the IEEE JOURNAL OFSELECTED TOPICS INAPPLIEDEARTHOBSERVATIONS ANDREMOTESENSING.
Pablo G. Rodríguezreceived the B.Sc. degree in physical science with specialization in electronics and computing in 1992. He received the Ph.D. degree in computer science in 2000, working in digital mammography.
He is an Associate Professor in the Department of Computer Science at the University of Extremadura since 1997. His research area is related to the devel-opment of Pattern Recognition and Image Analysis techniques, and so specificfields of interest are ac-tive contours, texture analysis, image classification, relevance feedback, and CBIR (content-based image retrieval) and CBVR (con-tent-based video retrieval) systems.
Antonio Plazawas born in Cáceres, Spain, in 1975. He received the M.S. and Ph.D. degrees in computer engineering from the University of Extremadura, Spain.
He has been a Visiting Researcher with the Remote Sensing Signal and Image Processing Laboratory (RSSIPL), University of Maryland Baltimore County; with the Applied Information Sciences Branch, NASA Goddard Space Flight Center (GSFC), Greenbelt, MD; with the Airborne Visible Infrared Imaging Spectrometer Data Facility, NASA Jet Propulsion Laboratory (JPL), Pasadena, CA; with the Telecommu-nications and Remote Sensing Laboratory, University of Pavia, Italy; and with the GIPSA-lab, Grenoble Images Parole Signal Automatique, France. He is currently an Associate Professor (with accreditation for Full Professor) with the Department of Technology of Computers and Communications, University of Extremadura, where he is the Head of the Hyperspectral Computing Laboratory (HyperComp). He was the Coordinator of the Hyperspectral Imaging Network, a European project designed to build an interdisciplinary research community focused on hyperspectral imaging activities. He is the author or coauthor of more than 350 publications on remotely sensed hyperspectral imaging, including more than 90 journal citation report papers (45 since January 2011), around 20 book chapters, and over 230 conference proceeding papers. His research interests include remotely sensed hyperspectral imaging, pattern recognition, signal and image processing, and efficient implementation of large-scale scientific problems on parallel and distributed computer architec-tures.
Dr. Plaza has guest edited seven special issues on scientific journals on the topic of remotely sensed hyperspectral imaging. He has been a Chair for the IEEE Workshop on Hyperspectral Image and Signal Processing: Evolution in Remote Sensing (Whispers 2011). He has also been serving as a Chair for the SPIE Conference on Satellite Data Compression, Communications, and Pro-cessing, since 2009, and for the SPIE Europe Conference on High-Performance Computing in Remote Sensing, since 2011. He has been a recipient of the recog-nition of Best Reviewers of the IEEEGeoscience and Remote Sensing Let-tersin 2009 and a recipient of the recognition of Best Reviewers of the IEEE TRANSACTIONS ONGEOSCIENCE ANDREMOTESENSINGin 2010, a journal for which he has served as Associate Editor since 2007 and for which he has re-viewed more than 260 manuscripts. He is currently serving as the Director of Education Activities for the IEEE Geoscience and Remote Sensing Society (GRSS), and as President of the Spanish Chapter of IEEE GRSS. He has been appointed Editor of the IEEE TRANSACTIONS ONGEOSCIENCE ANDREMOTE SENSING, with a three-year term starting on January 2013.