Carolin Strobl and Anne-Laure Boulesteix and Thomas Kneib and Thomas
Augustin and Achim Zeileis
Conditional Variable Importance for Random Forests
Article (Published)
(Refereed)
Original Citation:
Strobl, Carolin and Boulesteix, Anne-Laure and Kneib, Thomas and Augustin, Thomas and Zeileis,
Achim (2008) Conditional Variable Importance for Random Forests.
BMC Bioinformatics
, 9 (307).
pp. 1-11. ISSN 1471-2105
This version is available at:
http://epub.wu.ac.at/4987/
Available in ePub
WU: April 2016
ePub
WU, the institutional repository of the WU Vienna University of Economics and Business, is
provided by the University Library and the IT-Services. The aim is to enable open access to the
scholarly output of the WU.
This document is the publisher-created published version. It is a verbatim copy of the publisher
version.
Open Access
Methodology article
Conditional variable importance for random forests
Carolin Strobl*
1, Anne-Laure Boulesteix
2, Thomas Kneib
1, Thomas Augustin
1and Achim Zeileis
3Address: 1Department of Statistics, Ludwig-Maximilians-Universität Munchen, Ludwigstraße 33, D-80539 München, Germany, 2Sylvia Lawry
Centre for Multiple Sclerosis Research, Hohenlindener Straße 1, D-81677 München, Germany and 3Department of Statistics and Mathematics,
Wirtschaftsuniversität Wien, Augasse 2 – 6, A-1090 Wien, Austria
Email: Carolin Strobl* - [email protected]; Anne-Laure Boulesteix - [email protected]; Thomas Kneib - [email protected]; Thomas Augustin - [email protected]; Achim Zeileis - [email protected]
* Corresponding author
Abstract
Background: Random forests are becoming increasingly popular in many scientific fields because
they can cope with "small n large p" problems, complex interactions and even highly correlated predictor variables. Their variable importance measures have recently been suggested as screening tools for, e.g., gene expression studies. However, these variable importance measures show a bias towards correlated predictor variables.
Results: We identify two mechanisms responsible for this finding: (i) A preference for the
selection of correlated predictors in the tree building process and (ii) an additional advantage for correlated predictor variables induced by the unconditional permutation scheme that is employed in the computation of the variable importance measure. Based on these considerations we develop a new, conditional permutation scheme for the computation of the variable importance measure.
Conclusion: The resulting conditional variable importance reflects the true impact of each
predictor variable more reliably than the original marginal approach.
1 Background
Within the past few years, random forests [1] have become a popular and widely-used tool for non-paramet-ric regression in many scientific areas. They show high predictive accuracy and are applicable even in high-dimensional problems with highly correlated variables, a situation which often occurs in bioinformatics. Recently, the variable importance measures yielded by random for-ests have also been suggested for the selection of relevant predictor variables in the analysis of microarray data, DNA sequencing and other applications [2-5].
Identifying relevant predictor variables, rather than only predicting the response by means of some "black-box" model, is of interest in many applications. By means of variable importance measures the candidate predictor var-iables can be compared with respect to their impact in pre-dicting the response or even their causal effect (see, e.g., [6] for assumptions necessary for interpreting the impor-tance of a variable as a causal effect). In this case a key advantage of random forest variable importance meas-ures, as compared to univariate screening methods, is that they cover the impact of each predictor variable
individu-Published: 11 July 2008
BMC Bioinformatics 2008, 9:307 doi:10.1186/1471-2105-9-307
Received: 1 April 2008 Accepted: 11 July 2008 This article is available from: http://www.biomedcentral.com/1471-2105/9/307
© 2008 Strobl et al; licensee BioMed Central Ltd.
This is an Open Access article distributed under the terms of the Creative Commons Attribution License (http://creativecommons.org/licenses/by/2.0), which permits unrestricted use, distribution, and reproduction in any medium, provided the original work is properly cited.
ally as well as in multivariate interactions with other pre-dictor variables. For example, Lunetta et al. [2] find that genetic markers relevant in interactions with other mark-ers or environmental variables can be detected more effi-ciently by means of random forests than by means of univariate screening methods like Fisher's exact test. In the analysis of amino acid sequence data Segal et al. [7] also point out the necessity to consider interactions between sequence positions. Tree-based methods like random for-ests can help identify relevant predictor variables even in such high dimensional settings involving complex inter-actions. Therefore, the impact of different amino acid properties, some of which have been shown to be relevant in DNA and protein evolution [8], for predicting peptide binding is investigated in our application example in Sec-tion 4. However, we will find in this applicaSec-tion example, as often in practical problems, that many predictor varia-bles are highly correlated.
The issue of correlated predictor variables is prominent in, but not limited to, applications in genomics and other high-dimensional problems. Therefore, it is important to note that in any non-experimental scientific study, where the predictor variable settings cannot be manipulated independently by the investigator, the distinction between the marginal and the conditional effect of a vari-able is crucial.
Consider, for example, the apparent correlation between rates of complication after surgery and mortality in hospi-tals, that was investigated by Silber and Rosenbaum [9]. It is plausible to believe that the mortality rate of a hospital depends on the rate of complications – or even that the mortalities are caused by the complications. However, when severity of illness is taken into account, the correla-tion disappears [9].
This phenomenon is known as a spurious correlation (see also Stigler [10] for a historical example). In the hospital mortality example, the spurious correlation is caused by the fact that hospitals that treat many serious cases have both higher complication and mortality rates. However, when conditioning on severity of illness (i.e. comparing only patients with similar severity of illness), mortality is no longer associated with complications.
If you consider this as a prediction problem, once the truly influential background variable (severity of illness) is known, it is clear that the remaining covariate (complica-tion rate) provides no or little addi(complica-tional informa(complica-tion for predicting the response (mortality rate). From a statistical point of view, however, this distinction can only be made by a conditional importance measure.
We will point out throughout this chapter that correla-tions between predictor variables – regardless of whether they arise from small-scale characteristics, such as proxim-ities between genetic loci in organisms, or large-scale char-acteristics, such as similarities in the clientele of hospitals – severely affect the original random forest variable importance measures, because they can be considered as measures of marginal importance, even though what is of interest in most applications is the conditional effect of each variable. To make this distinction more clear, let us shortly review previous suggestions from the literature for measuring or illustrating variable importance in classifica-tion and regression trees (termed "classificaclassifica-tion trees" in the following for brevity, while all results apply to both classification and regression trees) and random forests: Breiman [11] displays the change in the response variable over the range of one predictor variable in "partial dependence plots" (see also [12] for a related approach). This may remind of the interpretation of model coeffi-cients in linear models. However, whether the effect of a variable is interpretable as conditional on all other varia-bles, as in linear models, may not be guaranteed in other models – and we will point out explicitly below that this is not the case in classification trees or random forests. The permutation accuracy importance, that is described in more detail in Section 2.3, follows the rationale that a ran-dom permutation of the values of the predictor variable is supposed to mimic the absence of the variable from the model. The difference in the prediction accuracy before and after permuting the predictor variable, i.e. with and without the help of this predictor variable, is used as an importance measure. The actual permutation accuracy importance measure will be termed "permutation impor-tance" in the following, while the general concept of the impact of a predictor variable in predicting the response is termed "variable importance". The alternative variable importance measure used in random forests, the Gini importance, is based on the principle of impurity reduc-tion that is followed in most tradireduc-tional classificareduc-tion tree algorithms. However, it has been shown to be biased when predictor variables vary in their number of catego-ries or scale of measurement [13], because the underlying Gini gain splitting criterion is a biased estimator and can be affected by multiple testing effects [14]. Therefore, we will focus on the permutation importance in the follow-ing, that is reliable when subsampling without replace-ment – instead of bootstrap sampling – is used in the construction of the forest [13].
Based on the permutation importance, schemes for varia-ble selection and for providing statements of the "signifi-cance" of a predictor variable (instead of a merely descriptive ranking of the variables w.r.t. their importance scores) have been derived: Breiman and Cutler [15]
sug-gest a simple significance test that, however, shows poor statistical properties [16]. An approach for variable selec-tion in large scale screening studies is introduced by Diaz-Uriarte and Alvarez de Andres [17], who suggest a back-ward elimination strategy. This approach has been shown to provide a reasonable selection of genes in many situa-tions and is freely available in an R package [18], that also provides different plots for comparing the performance on the original data set to those on a data set with ran-domly permuted values of the response variable. The lat-ter mimics the overall null hypothesis that none of the predictor variables is relevant and may serve as a baseline for significance statements. A similar approach is followed by Rodenburg et al. [19]. However, some recent simula-tion studies indicate that the performance of the variable importance measures may not be reliable when predictor variables are correlated: Even though Archer and Kimes [20] show in their extensive simulation study that the Gini importance can identify influential predictor variables out of sets of correlated covariates in many settings, the pre-liminary results of the simulation study of Nicodemus and Shugart [21] indicate that the ability of the permuta-tion importance to detect influential predictor variables in sets of correlated covariates is less reliable than that of alternative machine learning methods and highly depends on the number of previously selected splitting variables mtry. These studies, as well as our simulation results, indicate that random forests show a preference for correlated predictor variables, that is also carried forward to any significance test or variable selection scheme con-structed from the importance measures.
In this work we aim at providing a deeper understanding of the underlying mechanisms responsible for the obser-vations of [20] and [21]. In addition to this, we want to broaden the scope of considered problems to the compar-ison of the influence of correlated and uncorrelated pre-dictor variables. For this type of problem we introduce a new, conditional permutation importance for random forests, that better reflects the true importance of predictor variables. Our approach is motivated by the visual means of illustration introduced by Nason et al. [22]: In their "CARTscans" plots they not only display the marginal influence of a predictor variable, like the partial depend-ence plots of Breiman [11], but the infludepend-ence of continu-ous predictor variables separately for the levels of two other, categorical predictor variables, namely a condi-tional influence plot.
As pointed out above, in the case of correlated predictor variables it is important to distinguish between condi-tional and marginal influence of a variable, because a var-iable that may appear influential marginally might actually be independent of the response when considered conditional on another variable. In this respect the
approach of [22] is an important improvement, but in its current form is only applicable for categorical covariates. Therefore our aim in this work is to provide a general scheme that can be used both for illustrating the effect of a variable and for computing its permutation importance conditional on relevant covariates of any type. While the conditioning scheme of [22] can be considered as a full-factorial cross-tabulation based on two categorical predic-tor variables, our conditioning scheme is based on a par-tition of the entire feature space that is determined directly by the fitted random forest model.
In the following Section 2 we will outline how ensembles of classification trees are constructed and illustrate in a simulation study why correlated predictor variables tend to be overselected. Then we will review the construction of the original permutation importance before we introduce a new permutation scheme that we suggest for the con-struction of a conditional permutation importance meas-ure. The advantage of this measure over the currently-used one is illustrated in the results of our simulation study in Section 3 and in the application to peptide-binding data in Section 4.
2 Methods
In random forests and the related method bagging, an ensemble of classification trees is created by means of drawing several bootstrap samples or subsamples from the original training data and fitting a single classification tree to each sample. Due to the random variation in the samples and the instability of the single classification trees, the ensemble will consist of a diverse set of trees. For prediction, a vote (or average) over the predictions of the single trees is used and has been shown to highly outper-form the single trees: By combining the prediction of a diverse set of trees, bagging utilizes the fact that classifica-tion trees are instable but on average produce the right prediction. This understanding has been supported by several empirical studies (see, e.g., [23-26]) and especially the theoretical results of Bühlmann and Yu [27], who could show that the improvement in the prediction accu-racy of ensembles is achieved by means of smoothing the hard cut decision boundaries created by splitting in single classification trees, which in return reduces the variance of the prediction.
In random forests, another source of diversity is intro-duced when the set of predictor variables to select from is randomly restricted in each split, producing even more diverse trees. In addition to the smoothing of hard deci-sion boundaries, the random selection of splitting varia-bles in random forests allows predictor variavaria-bles that were otherwise outplayed by their competitors to enter the ensemble. Even though these variables may not be opti-mal with respect to the current split, their selection may
reveal interaction effects with other variables that other-wise would have been missed and thus work towards the global optimality of the ensemble.
The classification trees, from which the random forests are built, are built recursively in that the next splitting varia-ble is selected by means of locally optimizing a criterion (such as the Gini gain in the traditional CART algorithm [28]) within the current node. This current node is defined by a configuration of predictor values, that is determined by all previous splits in the same branch of the tree (see, e.g., [29] for illustrations). In this respect the evaluation of the next splitting variable can be considered conditional on the previously selected predictor variables, but regardless of any other predictor variable. In particu-lar, the selection of the first splitting variable involves only the marginal, univariate association between that predic-tor variable and the response, regardless of all other pre-dictor variables. However, this search strategy leads to a variable selection pattern where a predictor variable that is per se only weakly or not at all associated with the response, but is highly correlated with another influential predictor variable, may appear equally well suited for splitting as the truly influential predictor variable. We will illustrate this point in more detail in the following simu-lation study.
2.1 Simulation design
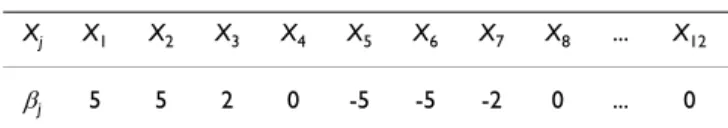
A simulation study was set up in order to illustrate the treatment of correlated predictor variables in ensemble methods based on classification trees. Data sets were gen-erated according to a linear model with twelve predictor variables yi = β1·xi,1 + ... + β12·xi,12 + εi, with . The predictor variables were sampled from a multivariate normal distribution X1,..., X12 ~ N(0, Σ) where the covariance structure Σwas chosen such that all variables have unit variance σj, j = 1 and only the first four predictor variables are block-correlated with σj, j' = 0.9 for j ≠j' ≤ 4, while the rest were independent with σj, j' = 0.
Of the twelve predictor variables only six were influential, as indicated by their coefficients in Table 1. A covariance structure of this type was already used for illustrating the effect of correlations by Archer and Kimes [20]. However, while their study mainly aimed at identifying one
influen-tial predictor out of a correlated set, here we also want to compare the importance scores of predictor variables with equally large coefficients, while some of the predictor var-iables are correlated and others are not: X1,..., X4 and X5,...,
X8 share the same coefficient pattern, while only X1,..., X4
are correlated. From the generated data sets, random for-ests were built with the cforest function from the party package [30,31] in the R system for statistical computing [32]. Different values for the parameter mtry, that regu-lates the number of randomly preselected splitting varia-bles, were considered to be able to investigate the mechanisms responsible for the results of Nicodemus and Shugart [21]. Default settings were used for all other parameters.
2.2 Illustration of variable selection
We find in the panel on the left hand side of Figure 1 that in the first splits of all trees, where the variables are con-sidered only marginally with respect to their association to the response, those variables (X3 and X4) correlated with highly influential predictors are selected equally often as the highly influential predictor variables (X1 and
X2 as well as X5 and X6) for mtry = 1, where no competitors are available and the correlated predictors can serve as replacements of the influential ones (the fact that the non-influential predictor variables X8 through X12 are selected almost equally often is only due to the lax choice of the stop criterion). When mtry increases and the highly influ-ential variables may be available as predominant compet-itors in some splits those variables (X3 and X4) correlated with highly influential predictors are selected less often than the highly influential correlated ones (X1 and X2)
themselves, but more often than even the highly influen-tial uncorrelated ones (X5 and X6). When we consider all splits of all trees in the panel on the right hand side of Fig-ure 1, the correlated predictors loose most of their advan-tage because variable selection is now conditional on the previously chosen variables in the same branch of the tree, that may include the truly influential correlated predic-tors. However, since variable selection is not conditional on all (or at least all correlated) variables, there is still a preference for the correlated variables with low and zero coefficients (X3 and X4 over X7 and X8), with a similar dependency on mtry.
This selection pattern is due to the locally optimal variable selection scheme used in recursive partitioning, that con-siders only one variable at a time and conditional only on the current branch. However, since this characteristic of tree-based methods is a crucial means of reducing compu-tational complexity (and any attempts to produce globally optimal partitions are strictly limited to low dimensional εii i d. . .~ N( , . )0 0 5
Table 1: Simulation design. Regression coefficients of the data generating process.
Xj X1 X2 X3 X4 X5 X6 X7 X8 ... X12
problems at the moment [33]), it shall remain untouched here.
2.3 The permutation importance
The rationale of the original random forest permutation importance is the following: By randomly permuting the predictor variable Xj, its original association with the
response Y is broken. When the permuted variable Xj,
together with the remaining non-permuted predictor var-iables, is used to predict the response for the out-of-bag observations, the prediction accuracy (i.e. the number of observations classified correctly) decreases substantially if the original variable Xj was associated with the response. Thus, Breiman [1] suggests the difference in prediction accuracy before and after permuting Xj, averaged over all trees, as a measure for variable importance, that we
for-malize as follows: Let be the out-of-bag (oob)
sam-ple for a tree t, with t ∈ {1,..., ntree}. Then the variable importance of variable Xj in tree t is
where is the predicted class for observation
i before and is the predicted class for
observation i after permuting its value of variable Xj, i.e.
with . (Note that
VI(t)(X
j) = 0 by definition, if variable Xj is not in tree t.) The
raw variable importance score for each variable is then computed as the mean importance over all trees:
In standard implementations of random forests an addi-tional scaled version of the permutation importance (often called z-score), that is achieved by dividing the raw importance by its standard error, is provided. However,
( )t VI I yi yi t i t t I yi yit j t j ( ) ( ) ( ) ( ) | ( )| , ( ) X = = ⎛ ⎝⎜ ⎞⎠⎟ ∈ ∑ − = ⎛ ⎝ ⎜ ⎞ ⎠ π ⎟⎟ ∈ ∑i t t ( ) | ( )| (1) ˆ( ) ( )( ) yit = f t xi ˆ( ), ( )( , ) yit f t i j j π = x π xi i i j i j i j i p j x x x j x x ,π =( ,1,..., ,−1, π ( ), , ,+1,..., , ) VI j VI t t ntree j ntree (X )= ∑=1 ( )( )x Selection rates Figure 1
Selection rates. Relative selection rates for twelve variables in the first splits (left) and in all splits (right) of all trees in
ran-dom forests built with different values for mtry.
0 0.2 0.4
first split
mtry = 1
0 0.4 0.8all splits
0 0.2 0.4mtry = 3
0 0.4 0.8 1 2 3 4 5 6 7 8 9 10 11 12 0 0.2 0.4mtry = 8
variable
1 2 3 4 5 6 7 8 9 10 11 12 0 0.4 0.8variable
since recent results [16,17] indicate that the raw impor-tance VI(Xj) has better statistical properties, we will only consider the unscaled version here.
2.4 Types of independence
We know that the original permutation importance over-estimates the importance of correlated predictor variables. Part of this artefact may be due to the preference of corre-lated predictor variables in early splits as illustrated in Sec-tion 2.2. However, we also have to take into account the permutation scheme that is employed in the computation of the permutation importance. In the following we will first outline what notion of independence corresponds to the current permutation scheme of the random forest per-mutation importance. Then we will introduce a more sen-sible permutation scheme that better reflects the true impact of predictor variables.
It can help our understanding to consider the permuta-tion scheme in the context of permutapermuta-tion tests [34]: Usu-ally a null hypothesis is considered that implies the independence of particular (sets of) variables. Under this null hypothesis some permutations of the data are permit-ted because they preserve the structure determined by the null hypothesis. If, for example, the response variable Y is independent from all predictor variables (global null
hypothesis) a permutation of the (observed) values of Y
affects neither the marginal distribution of Y nor the joint distribution of X1,..., Xp and Y, because the joint distribu-tion can be factorized as P(Y, X1,..., Xp) = P(Y)·P(X1,..., Xp) under the null hypothesis. If, however, the null hypothe-sis is not true, the same permutation will lead to a devia-tion in the joint distribudevia-tion or some reasonable test statistic computed from it. Therefore, a change in the dis-tribution or test statistic caused by the permutation can serve as an indicator that the data do not follow the inde-pendence structure we would expect under the null hypothesis.
With this framework in mind, we can now take a second look at the random forest permutation importance and ask: Under which null hypothesis would this permutation scheme be permitted? If the data are actually generated under this null hypothesis the permutation importance will be (a random value from a distribution with mean) zero, while any deviation from the null hypothesis will lead to a change in the prediction accuracy, that is used as a test statistic here, and thus will be detectable as an increase in the value of the permutation importance. We find that the original permutation importance, where
one predictor variable Xj is permuted against both the
response Y and the remaining (one or more) predictor
variables Z = X1,..., Xj-1, Xj+1,..., Xp as illustrated in the left
panel of Figure 2, corresponds to a null hypothesis of independence between Xj and both Y and Z:
H0 : Xj ⊥Y, Z or equivalently Xj ⊥Y ∧Xj ⊥Z (2) Under this null hypothesis the joint distribution can be factorized as
What is crucial when we want to understand why corre-lated predictor variables are preferred by the original ran-dom forest permutation importance is that a positive value of the importance corresponds to a deviation from this null hypothesis – that can be caused by a violation of either part: the independence of Xj and Y, or the independ-ence of Xj and Z. However, from these two aspects only one is of interest when we want to assess the impact of Xj
to help predict Y, namely the question if Xj and Y are inde-pendent. This aim, to measure only the impact of Xj on Y, would be better reflected if we could create a measure of deviation from the null hypothesis that Xj and Y are
inde-pendent under a given correlation structure between Xj
and the other predictor variables, that is determined by our data set. To meet this aim we suggest a conditional
permutation scheme, where Xj is permuted only within
groups of observations with Z = z, to preserve the correla-tion structure between Xj and the other predictor variables as illustrated in the right panel of Figure 2.
This permutation scheme corresponds to the following null hypothesis
H0 : (Xj ⊥Y)|Z, (4)
where the conditional distribution can be factorized under the null hypothesis as
which is the definition of conditional independence. In the special case where Xj and Z are independent both permutation schemes will give the same result, as illus-trated by our simulation results below. When Xj and Z are correlated, however, the original permutation scheme will lead to an apparent increase in the importance of corre-lated predictor variables, that is due to deviations from the uninteresting null hypothesis of independence between Xj
and Z. P Y X Zj P Y Z P X H j ( , , )=0 ( , )⋅ ( ). (3) P Y X Z P Y Z P X Z P Y X Z P Y Z j H j j H ( , | ) ( | ) ( | ) ( | , ) ( | ), = ⋅ = 0 0 or (5)
2.5 A new, conditional permutation scheme
Technically, any kind of conditional assessment of the importance of one variable conditional on another one is straightforward whenever the variables to be conditioned on, Z, are categorical as in [22]. However, for our aim to conditionally permute the values of Xj within groups of Z
= z, where Z can contain potentially large sets of covariates of different scales of measurement, we want to supply a grid that (i) is applicable to variables of different types, (ii) is as parsimonious as possible, but (iii) is also compu-tationally feasible. Our suggestion is to define the grid within which the values of Xj are permuted for each tree by means of the partition of the feature space induced by that tree. The main advantages of this approach are that this partition was already learned from the data during model fitting, contains splits in categorical, ordered and continu-ous predictor variables and can thus serve as an internally available means for discretizing the feature space. In principle, any partition derived from a classification tree can be used to define the permutation grid. Here we used partitions produced by unbiased conditional infer-ence trees [31], that employ binary splitting as in the standard CART algorithm [28]. This means that, if k is the number of categories of an unordered or ordered categor-ical variable, up to k, but potentially less than k, subsets of the data are separated.
Continuous variables are treated in the same way: Every binary split in a variable provides one or more cutpoints, that can induce a more or less fine graded grid on this var-iable. By using the grid resulting from the current tree we are able to condition in a straightforward way not only on categorical, but also on continuous variables and create a grid that may be more parsimonious than the full factorial approach of [22]. Only in one aspect we suggest to leave the recursive partition induced by a tree: Within a tree structure, each cutpoint refers to a split in a variable only
within the current node (i.e. a split in a variable may not bisect the entire sample space but only partial planes of it). However, for ease of computation, we suggest that the conditional permutation grid uses all cutpoints as bisec-tors of the sample space (the same approach is followed by [22]). This leads to a more fine graded grid, and may in some cases result in small cell frequencies inducing greater variation (even though our simulation results indi-cate that in practice this is not a critical issue). From a the-oretical point of view, however, conditioning too strictly has no negative effect, while a lack of conditioning pro-duces artefacts as observed for the unconditional permu-tation importance.
In summary the conditional permutation importance is derived as follows:
1. In each tree compute the oob-prediction accuracy before the permutation as in Equation 1:
.
2. For all variables Z to be conditioned on: Extract the cut-points that split this variable in the current tree and create a grid by means of bisecting the sample space in each cut-point.
3. Within this grid permute the values of Xj and compute the oob-prediction accuracy after permutation:
, where is the
predicted classes for observation i after permuting its
value of variable Xj within the grid defined by the variables
Z.
4. The difference between the prediction accuracy before and after the permutation accuracy again gives the impor-tance of Xj for one tree (see Equation 1). The importance of Xj for the forest is again computed as an average over all trees.
To determine the variables Z to be conditioned on, the
most conservative – or rather overcautious -strategy would be to include all other variables as conditioning variables, as was indicated by our initial notation. A more intuitive choice is to include only those variables whose empirical correlation with the variable of interest Xj exceeds a certain moderate threshold, as we do with the Pearson correla-tion coefficient for continuous variables in the following simulation study and application example. For the more general case of predictor variables of different scales of
I yi yit i t t = ⎛ ⎝⎜ ⎞⎠⎟ ∈ ∑ ( ) ˆ( ) | ( )| I yi yi j Z t i t t = ⎛ ⎝ ⎜ ⎞ ⎠ ⎟ ∈ ∑ ˆ , | ( ) ( ) | ( )| π ˆ, | ( ) ( ) ( ) , | yit Z f t i Z j j π = x π Permutation schemes. Figure 2
Permutation scheme for the original marginal (left) and for the newly suggested conditional (right) permutation impor-tance.
measurement the framework promoted by Hothorn et al. [31] provides p-values of conditional inference tests as measures of association. The p-values have the advantage that they are comparable for variables of all types and can serve as an intuitive and objective means for selecting the variables Z to be conditioned on in any problem. Another option is to let the user himself select certain variables to condition on, if, e.g., a hypothesis of interest includes cer-tain independencies.
Note however, that neither a high number of condition-ing variables nor a high overall number of variables in the data set poses a problem for the conditional permutation approach: The permutation importance is computed indi-vidually for each tree and then averaged over all trees. Cor-respondingly, the conditioning grid for each tree is determined by the partition of that particular tree only. Thus, even if in principle the stability of the permutation may be affected by small cell counts in the grid, practically the complexity of the grid is limited by the depth of each tree.
The depth of the tree, however, does not depend on the overall number of predictor variables, but on various other characteristics of the data set (most importantly the ratio of relevant vs. noise variables, that is usually low, for example in genomics) in combination with tuning parameter settings (including the number of randomly preselected predictor variables, the split selection crite-rion, the use of stopping criteria and so forth). Lin and Jeon [35] even point out that limiting the depth of the trees in random forests may prove beneficial w.r.t. predic-tion accuracy in certain situapredic-tions.
Another important aspect is that the conditioning varia-bles, especially if there are many, may not necessarily appear all together with the variable of interest in each individual tree, but different combinations may be repre-sented in different trees if the forest is large enough.
3 Results
For the simulation design introduced in Section 2.1, Fig-ure 3 shows the median and interquartile range (over 500 iterations) of the importance scores of each variable for the different permutation schemes: the original marginal permutation and the newly suggested conditional permu-tation scheme. The set of variables Z to be conditioned on was chosen here to include all variables with an empirical correlation r ≥ .2.
We find that the pattern of the coefficients induced in the data generating process is not reflected by the importance values computed with the ordinary permutation scheme. With this scheme the importance scores of the correlated predictor variables are highly overestimated. This effect is
most pronounced for small values of mtry, because corre-lated variables have a higher chance to end up in a top position in a tree when their correlated competitors are not available.
For the conditional permutation scheme the importance scores better reflect the true pattern: The correlated varia-bles X1 and X2 with the same coefficient show an almost
equal level of importance as the uncorrelated variables X5
and X6, while the importance of X3 and X4, that are corre-lated but have a lower or zero coefficient, decrease. For the variables with small and zero coefficients we still find a difference between the correlated and uncorrelated varia-bles, such that for the correlated variables the importance values are still overestimated – however to a much lesser extent than with the unconditional permutation scheme. This remaining disadvantage of the uncorrelated predictor variables may be due to the fact that for most values of mtry these variables are selected less often and in lower positions in the tree (see Figure 1) and thus have a lower chance to produce a high importance value. The degree of the preference of correlated predictor variables also depends on the choice of mtry and is most pronounced for small values of mtry, as expected from the selection
Permutation importance Figure 3
Permutation importance. Median permutation
impor-tance for marginal (dashed) and conditional (solid) permuta-tion scheme along with inter-quartile range. Note that the ordering of variables in the plot is arbitrary.
mtry = 1 ● ● ● ● ●● ● ● ●● ● ● ● ● ● ●●● ● ● ● ● ● ● ● ● ● ● ● ● ● ● ● ● ● ● ●●●●●●●●● ●●●●●●●●●●● ●●●●●● ●●●●●●●●●●●●●●● 0 5 15 25 mtry = 3 ●●●● ●● ● ● ● ● ● ● ● ● ● ● ●●● ● ● ● ● ● ● ● ● ● ● ● ●●●●●● ●●●●●● ●●●●●●●●● ●●●●●● ●●●●●●●●● 01 0 3 0 5 0 mtry = 8 ●●●● ●● ● ● ● ● ● ● ● ● ● ● ● ●●● ● ● ● ● ● ● ●●●●● ●●●● ●●●●●● ●●● ●●●●● 1 2 3 4 5 6 7 8 9 10 11 12 0 2 04 06 08 0 variable
frequencies. On the other hand, we find in Figure 3 that the variability of the importance increases for large values of mtry, and the prediction accuracy is expected to be higher for smaller values of mtry. Another interesting fea-ture of the conditional permutation scheme is that the variability of the conditional importance is lower than that of the unconditional importance within each level of mtry.
With respect to the identifiability of few influential predic-tors from a set of correlated and other noise variables (which was the task in [20] and [21]), we can see from the importance scores for X1,..., X3 in comparison to that of X4
that the conditional importance reflects the same pattern as the unconditional importance, however with a notably smaller variation that may improve the identifiability. In the comparison of potentially influential correlated and uncorrelated predictor variables on the other hand, the conditional importance is much better suited as a means of comparison than the original importance. For piece-wise constant functions, that can be more easily addressed with recursive partitioning methods, the beneficial effect of conditioning is even stronger than presented here.
4 Example: Relating amino acid sequence to
phenotype in peptide-binding data
As an application example we consider peptide-binding data that were previously analysed with recursive parti-tioning techniques by Segal et al. [7]. The data set includes 105 variables for a total of n = 310 amino acid sequences. The response to be predicted is a binding property that can be coded as a binary variable (binding/no binding). The remaining variables available in this data set corre-spond to 13 amino acid properties for each of the eight considered amino acid positions. These 13 properties include, e.g. volume, polarity, bulkiness, flexibility, aro-maticity, and charge, yielding in total 104 continuous pre-dictor variables. A random forest with 1000 trees and mtry = 104 (which corresponds to bagging [23,24] as a special case of a random forest where mtry is equal to the number of candidate predictors and variable selection is not ran-domly restricted) was fit to the data set. The permutation importance was computed either with the unconditional or the conditional permutation scheme. The resulting importance scores are displayed in Figure 4 (note that the absolute values of the scores should not be interpreted). The few predictor variables whose importance scores reach highest or even exceed the plotting area would be selected for further analysis by any means. However, for some of the variables with the next smaller importance scores the ranking strongly depends on the permutation scheme. We will focus our illustration on the ranking of three exemplary predictor variables, "h2y8", "flex8" and "pol3", that are highlighted in Figure 4: We find in the unconditional view in the top panel of Figure 4 that
"h2y8" and "flex8" appear to be of higher importance than "pol3" (ranks "h2y8": 8, "flex8": 9, "pol3": 11). However, in the conditional view in the bottom panel of Figure 4 their order is reversed and it turns out that "pol3" is really more important than "h2y8" and "flex8"(ranks "h2y8": 9, "flex8": 8, "pol3": 7). This change in the ranks of the predictor variables is most pronounced for large mtry as expected, but similar effects can be observed for smaller values.
When exploring the reason why the importances of "h2y8" and "flex8" are moderated by conditioning, while the importance of "pol3" remains almost constant, we find that "h2y8" and "flex8" are correlated with influen-tial covariates, while "pol3" is only correlated with non-influential covariates. For example, "h2y8" is highly corre-lated with the polarity at position eight "pol8", that is indicated by the * symbol in in Figure 4. The variable "pol8" shows a high importance (that is however also moderated by conditioning) and was already found to be influential by Segal et al. [7], who note that it may approx-imate an effect of the eighth position in the original sequence data, while the results of Xia and Li [8] indicate an effect of the amino acid property polarity itself. This shows that importance rankings in data sets that con-tain complex correlations between predictor variables can be severely affected by the underlying permutation scheme: When the conditional permutation is used, the importance scores of correlated predictor are moderated such that the truly influential predictor variables have a higher chance to be detected.
Example: peptide-binding data Figure 4
Example: peptide-binding data. Marginal (top) and
con-ditional (bottom) permutation importance of 104 predictors of peptide-binding. 0 0.005 unconditional 0 0.005 conditional
h2y8 flex8 pol3
5 Discussion and conclusion
We have investigated the sources of preferences in the var-iable importance measures of random forests in favor of correlated predictor variables and suggested a new, condi-tional permutation scheme for the computation of the variable importance measure. This new, conditional per-mutation scheme uses the partition that is automatically provided by the fitted model as a conditioning grid and reflects the true impact of each predictor variable better than the original, marginal approach. Even though the conditional permutation cannot entirely eliminate the preference for correlated predictor variables, it has been shown to provide a more fair means of comparison that can help identify the truly relevant predictor variables. Our simulation results also illustrate the impact of the choice of the random forest tuning parameter mtry: While
the default value mtry = is often found to be optimal
with respect to prediction accuracy in empirical studies [36], our findings indicate that in the case of correlated predictor variables different values of mtry should be con-sidered. However, it should also be noted that any inter-pretation of random forest variable importance scores can only be sensible when the number of trees is chosen suffi-ciently large such that the results produced with different random seeds do not vary systematically. Only then it is assured that the differences between, e.g., unconditional and conditional importance are not only due to random variation.
The conditional permutation importance will be freely available in the next release of the party package for recur-sive partitioning [30,31] in the R system for statistical computing [32].
Authors' contributions
CS defined the research question, suggested the condi-tional variable importance, set up and performed the sim-ulation experiments and drafted the manuscript. A–LB analyzed the peptide-binding data. TK, TA and AZ con-tributed to the theoretical understanding and presenta-tion of the problem. All authors contributed to and approved the final version of the manuscript.
Acknowledgements
A–LB was supported by the Porticus Foundation in the context of the Inter-national School for Technical Medicine and Clinical Bioinformatics. The authors would like to thank Torsten Hothorn for providing essential help with accessing and processing cforest objects.
References
1. Breiman L: Random Forests. Machine Learning 2001, 45:5-32.
2. Lunetta KL, Hayward LB, Segal J, Eerdewegh PV: Screening Large-Scale Association Study Data: Exploiting Interactions Using Random Forests. BMC Genetics 2004, 5:32.
3. Bureau A, Dupuis J, Falls K, Lunetta KL, Hayward B, Keith TP, Eerdewegh PV: Identifying SNPs Predictive of Phenotype Using Random Forests. Genetic Epidemiology 2005,
28(2):171-182.
4. Huang X, Pan W, Grindle S, Han X, Chen Y, Park SJ, Miller LW, Hall J: A Comparative Study of Discriminating Human Heart Fail-ure Etiology Using Gene Expression Profiles. BMC Bioinformat-ics 2005, 6:205.
5. Qi Y, Bar-Joseph Z, Klein-Seetharaman J: Evaluation of Different Biological Data and Computational Classification Methods for Use in Protein Interaction Prediction. Proteins 2006,
63(3):490-500.
6. Laan M van der: Statistical Inference for Variable Importance.
International Journal of Biostatistics 2006, 2:Article 2 [http:// www.bepress.com/ijb/vol2/iss1/2/].
7. Segal MR, Cummings MP, Hubbard AE: Relating Amino Acid Sequence to Phenotype: Analysis of Peptide-binding Data.
Biometrics 2001, 57(2):632-643.
8. Xia X, Li WH: What Amino Acid Properties Affect Protein Evolution? Journal of Molecular Evolution 1998, 47(5):557-564. 9. Silber JH, Rosenbaum PR: A Spurious Correlation Between
Hos-pital Mortality and Complication Rates. The Importance of Severity Adjustment. Journal of Urology 1998, 160:288-289. 10. Stigler SM: Correlation and Causation: A Comment.
Perspec-tives in Biology and Medicine 2005, 48:88-94. Supplement
11. Breiman L: Statistical Modeling: The Two Cultures. Statistical Science 2001, 16(3):199-231.
12. Feraud R, Clerot F: A Methodology to Explain Neural Network Classification. Neural Networks 2002, 15(2):237-246.
13. Strobl C, Boulesteix AL, Zeileis A, Hothorn T: Bias in Random Forest Variable Importance Measures: Illustrations, Sources and a Solution. BMC Bioinformatics 2007, 8:25.
14. Strobl C, Boulesteix AL, Augustin T: Unbiased Split Selection for Classification Trees Based on the Gini Index. Computational Statistics & Data Analysis 2007, 52:483-501.
15. Breiman L, Cutler A: Random Forests – Classification Manual (website accessed in 12/2007). [http://www.math.usu.edu/ ~adele/forests/].
16. Strobl C, Zeileis A: Danger: High Power! – Exploring the Sta-tistical Properties of a Test for Random Forest Variable Importance. Proceedings of the 18th International Conference on Com-putational Statistics, Porto, Portugal 2008.
17. Diaz-Uriarte R, Alvarez de Andrés S: Gene Selection and Classi-fication of Microarray Data Using Random Forest. BMC Bioin-formatics 2006, 7:3.
18. Diaz-Uriarte R: GeneSrF and varSelRF: A Web-based Tool and R Package for Gene Selection and Classification Using Ran-dom Forest. BMC Bioinformatics 2007, 8:328.
19. Rodenburg W, Heidema AG, Boer JM, Bovee-Oudenhoven IM, Fes-kens EJ, Mariman EC, Keijer J: A Framework to Identify Physio-logical Responses in Microarray Based Gene Expression Studies: Selection and Interpretation of Biologically Rele-vant Genes. Physiological Genomics 2008, 33:78-90.
20. Archer KJ, Kimes RV: Empirical characterization of random forest variable importance measures. Computational Statistics & Data Analysis 2008, 52(4):2249-2260.
21. Nicodemus K, Shugart YY: Impact of Linkage Disequilibrium and Effect Size on the Ability of Machine Learning Methods to Detect Epistasis in Case-Control Studies. Abstract volume of the Sixteenth Annual Meeting of the International Genetic Epidemiology Society, North Yorkshire, UK 2007, 31(6):611.
22. Nason M, Emerson S, Leblanc M: CARTscans: A Tool for Visual-izing Complex Models. Journal of Computational and Graphical Sta-tistics 2004, 13(4):1-19.
23. Breiman L: Bagging Predictors. Machine Learning 1996,
24(2):123-140.
24. Breiman L: Arcing Classifiers. The Annals of Statistics 1998,
26(3):801-849.
25. Bauer E, Kohavi R: An Empirical Comparison of Voting Classi-fication Algorithms: Bagging, Boosting, and Variants.
Machine Learning 1999, 36(1–2):105-139.
26. Dietterich TG: An Experimental Comparison of Three Meth-ods for Constructing Ensembles of Decision Trees: Bagging, p
Publish with BioMed Central and every scientist can read your work free of charge
"BioMed Central will be the most significant development for disseminating the results of biomedical researc h in our lifetime."
Sir Paul Nurse, Cancer Research UK Your research papers will be:
available free of charge to the entire biomedical community peer reviewed and published immediately upon acceptance cited in PubMed and archived on PubMed Central yours — you keep the copyright
Submit your manuscript here:
http://www.biomedcentral.com/info/publishing_adv.asp
BioMedcentral Boosting, and Randomization. Machine Learning 2000,
40(2):139-157.
27. Bühlmann P, Yu B: Analyzing Bagging. The Annals of Statistics 2002,
30(4):927-961.
28. Breiman L, Friedman JH, Olshen RA, Stone CJ: Classification and Regression Trees New York: Chapman and Hall; 1984.
29. Hastie T, Tibshirani R, Friedman JH: The Elements of Statistical Learning
New York: Springer; 2001.
30. Hothorn T, Hornik K, Zeileis A: party: A Laboratory for Recur-sive Part(y)itioning. [http://CRAN.R-project.org/package=party]. R package version 0.9-96.
31. Hothorn T, Hornik K, Zeileis A: Unbiased Recursive Partition-ing: A Conditional Inference Framework. Journal of Computa-tional and Graphical Statistics 2006, 15(3):651-674.
32. R Development Core Team: R: A Language and Environment for Statis-tical Computing 2008 [http://www.R-project.org/]. R Foundation for Statistical Computing, Vienna, Austria
33. van Os BJ, Meulman J: Globally Optimal Tree Models. In Abstract Book of the 3rd World Conference on Computational Statistics & Data Analysis of the International Association for Statistical Computing, Cyprus, Greece Edited by: Azen S, Kontoghiorghes E, Lee JC. Matrix Compu-tations and Statistics Group; 2005:79.
34. Good P: Permutation, Parametric, and Bootstrap Tests of Hypotheses 3rd edition. New York: Springer Series in Statistics; 2005.
35. Lin Y, Jeon Y: Random Forests and Adaptive Nearest Neigh-bors. Journal of the American Statistical Association 2006,
101(474):578-590.
36. Svetnik V, Liaw A, Tong C, Culberson JC, Sheridan RP, Feuston BP:
Random Forest: A Classification and Regression Tool for Compound Classification and QSAR Modeling. Journal of Chemical Information and Computer Sciences 2003, 43(6):1947-1958.
![Poly[[diaquabis{μ 4 [6 (4 carboxyphenyl) 4,4′ bipyridin 2 yl]benzoato κ2O:N4′}zinc] dimethylformamide tetrasolvate]](data:image/gif;base64,R0lGODlhAQABAIAAAP///wAAACH5BAEAAAAALAAAAAABAAEAAAICRAEAOw==)