International Poverty Centre
March 2007
Analysing and achieving
Pro-Poor Growth
F R O M T H E
E D I T O R
Dag Ehrenpreis
Poverty in Focus is a regular publication of the International Poverty Centre (IPC). Its purpose is to presentthe results of research on poverty and inequality in the developing world. IPC is a joint project between the United Nations Development Programme and Brazil to promote South-South Cooperation on applied poverty research. It specialises in analysing poverty and inequality and offering research-based policy recommendations on how to reduce them. IPC is directly linked to the Poverty Group of the Bureau for Development Policy, UNDP and the Brazilian Government’s Institute for Applied Economic Research (Ipea).
IPC Director (acting) Terry McKinley Editor
Dag Ehrenpreis International Advisory Board
Desktop Publisher Roberto Astorino
Front page: Photo by Manish Mandlik, Thane, Maharashtra, India: “Rice Harvest” Photo # 475485, Stock.XCHNG, http://www.sxc. hu/index.phtml. The photo illustrates that pro-poor growth has to be based on enhancing the productivity of poor women and men in sectors and areas where the poor make a living, such as in the rural villages of India. As shown in the table on page 18, the state of Maharashtra is characterised by high growth, but low poverty elasticity. It is the state where the financial and industrial centre of Mumbai (ex-Bombay) is located, where most of its economic growth is generated. Thus it also illustrates that economic growth in the urban modern sector is not necessarily pro-poor.
Editor’s note: The sources of graphs and tables are the reference publications at the end of each article concerned. Thanks for permission to use this material to Stephan Klasen, University of Göttingen; Janet Stotsky, IMF; Palgrave-Macmillan; Swedish International Development Cooperation Agency (Sida); ILO; German Institute of Global and Areas Studies (GIGA); Blackwell Publishing; Africa Economic Research Consortium (AERC); and the University of Connecticut. And thanks not least to all the authors contributing their intellectual products without any monetary remuneration.
International Poverty Centre SBS – Ed. BNDES, 10º andar 70076-900 Brasilia DF Brazil povertycentre@undp-povertycentre.org www.undp-povertycentre.org
The views expressed in IPC publications are those of the authors and do not necessarily reflect the views of IPC, IPEA or UNDP.
Oscar Altimir, CEPAL, Santiago de Chile
Giovanni A. Cornia, Università di Firenze
Nora Lustig, UNDP/BDP Poverty Group
Gita Sen, Indian Institute of Management, Bangalore
Anna Tibaijuka, UN Habitat, Nairobi
Peter Townsend, London School of Economics
Philippe van Parijs, Université de Louvain
T
he reduction of income poverty is largely associated with long-term economic growth. There seems to be a broad consensus among analysts and policy makers that per capita income growth is a major element of sustainable poverty reduction. However, similar rates of growth can have very different impact on income poverty under different conditions, varying in time and space.Poor women and men are not just beneficiaries but primary creators of growth. The extent of poverty reduction depends on the degree to which the poor participate in the growth process and share in its proceeds, i.e. on inequality in the asset and income distribution. Thus, both the pace and pattern of growth matter for poverty reduction. The distinction between pro-poor growth and general economic growth is crucial for policy analysis and for formulating poverty reduction strategies. Yet, there is no consensus about how to define and measure pro-poor growth. The International Poverty Centre (IPC) initiated a debate on this issue among researchers in 2004-05 in a series of One-pagers, summarised in Number 6:Pro-poor growth: finding the Holy Grail, available on the website.
This issue of IPC’s journal Poverty in Focus is not so much about the definition of pro-poor growth as about analytical and policy approaches, and results. The authors spell out and apply different definitions and measures in discussing various policy-related aspects of pro-poor growth and summarising research results. It is clear that much more pro-poor growth, whatever the definition, is needed in most countries if the first Millennum Development Goal is to be achieved.
Hyun Son reports on a recent IPC study, which analyses growth performance during the period 1984-2001 in 80 countries and especially the extent of pro-poorness of 237 growth spells, using a fairly tough definition.
Stephan Klasen shows that gender inequality, especially in education and employment, has a negative impact on overall economic growth and notably on poverty reduction. Andy McKay presents growth incidence curves as a useful graphical tool for observing and analysing the changes in poverty that the distribution and growth patterns imply. Louise Cord summarises a recent collaborative research project with country studies, which confirm the strong correlation between economic growth and poverty reduction. Susanna Lundström and Per Ronnås outline a method for integrated pro-poor growth analysis of employment, the macroeconomy and the business environment. Aziz R. Khan discusses recent international research on how the incomes of the poor depend on the nature and extent of employment that economic growth generates. Esther Ishengoma and Robert Kappel explore the challenges of formalising informal firms, which is hugely important for improving the employment conditions of poor people. Timothy Besley et al. identify the main policy origins of the very different growth and poverty experiences across India’s states and indicate reforms for more pro-poor growth. John Farrington and Mark Robinson analyse the serious challenges that Asian countries face in seeking to sustain the rapid growth and poverty reduction achieved so far on the road to achieving MDGs by 2015.
Germano Mwabu and Erik Thorbecke review a collaborative study by African economic researchers on the broad elements of development strategies based on pro-poor growth. Nanak Kakwani et al. reveal how Brazil managed to reduce poverty without growth in per capita incomes by implementing pro-poor policies that reduced inequality. Mwangi S. Kimenyi proposes 10 Commandments of Pro Poor Growth. A basic notion is that policies must be designed to stimulate growth in those sectors and areas, in which poor people earn their living.
This issue of Poverty in Focus is intended to illuminate the state-of-the art regarding the policy implications of the relationship between economic growth and income poverty reduction. We hope you will find it instructive and useful.
Global Estimates of
Pro-Poor Growth
by Hyun H. Son,
International Poverty Centre
A recent IPC study analyses global growth rates and their extent of pro-poorness.
A new method to measure pro-poor growth is presented and used on available data. Negative per capita growth is quite frequent, while far too few
growth spells are both positive and pro-poor. There is a large
variation across regions and country categories. Some factors behind these outcomes are also analysed.
The economic
growth performanceof developing countries differs a lot, both over time and across countries. There are large variations not only in growth rates but also in the impact on poverty per unit of growth–the elasticity of poverty with respect to mean growth of income or consumption. This article is intended to illuminate the empirical interrelation between growth performance, poverty reduction and changes in inequality. A recent Working Paper from the International Poverty Centre, IPC, presents global estimates of growth and its pro-poorness on the basis of cross-country analysis of 237 growth spells in 80 low- and middle-income developing countries during the period 1984-2001, spanning two successive household surveys for a given country.
The study defined growth as pro-poor if poor households increase income (or consumption, which ever measure is available for a given country)
proportionally more than the non-poor, i.e. households above the poverty line. When growth is negative, i.e. in a recession, it is called pro-poor if the income decrease is proportionally less, on average, for poor households than for the non-poor ones.
Further, a new measure of pro-poor growth was defined in order to adjust the observed mean growth rates of income (or consumption) for distributional changes. Thus, if
inequality increases over a period, then the pro-poor growth rate will be lower than the observed growth rate of the mean income or consumption, and vice versa. This new measure of pro-poor growth captures gains and losses in the income (or consumption) of the poor, relative to the observed average
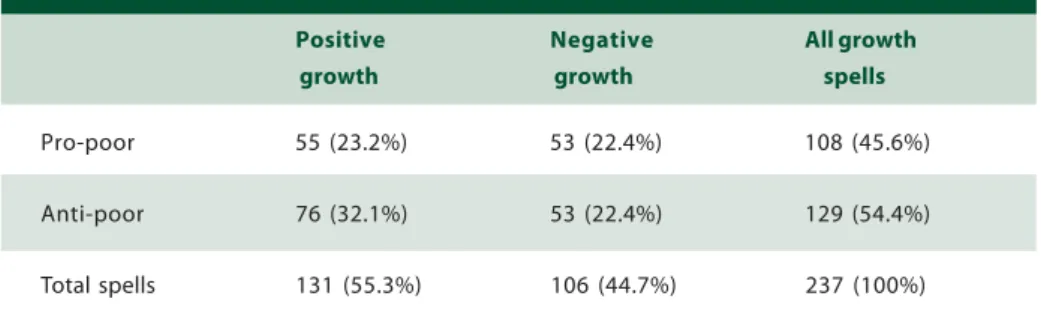
growth rates, due to changes in inequality. The gains imply pro-poor growth, the losses anti-poor growth. The proposed pro-poor growth rate can be calculated if statistical data are available on the mean income or consumption as well as the distribution by decile for the period between any two household surveys. The World Bank’s cross-country data provide this information and thus the proposed methodology was applied to globally assess the rates of growth and its pro-poorness across the developing countries. Some of the empirical findings are summarised here in the two tables. Table 1 shows that of all the 237 growth spells under observation, 106 had a negative growth rate of per capita consumption, i.e. not much less than half (44.7 percent). For the remaining 131 growth spells where the per capita growth rates were positive, growth was pro-poor only in 55 cases (23.2 percent) and anti-poor in 76 cases (32.1 percent). These findings suggest thus that global growth processes have generally not been pro-poor as here defined. Then, the study broke down the 237 growth spells into various country classifications as defined in the World
Positive Negative All growth growth growth spells
Pro-poor 55 (23.2%) 53 (22.4%) 108 (45.6%)
Anti-poor 76 (32.1%) 53 (22.4%) 129 (54.4%)
Total spells 131 (55.3%) 106 (44.7%) 237 (100%)
Table 1
Development Indicators. The results are summarized in Table 2.
In East Asia and the Pacific, growth rates were positive in 74.3 percent of the spells, but only in 17.1 percent of the spells was growth both positive and pro-poor. This suggests that in this region, poverty reduction was due mainly to high rates of actual growth, rather than to growth being pro-poor when considering its distribution.
Low-income countries, heavily indebted countries and sub-Saharan Africa–the largely overlapping country groupings with the highest incidence of poverty– had a lower than average frequence of growth spells that were both positive and pro-poor: around 20 percent. The highest such frequence was in the Middle East and Northern Africa region, and in the low middle-income countries. In Latin America and the Caribbean as well as South Asia, about 30 percent of the spells were both positive and pro-poor, while the latter region had the lowest frequency of both negative and anti-poor spells, less than 6 percent. The worst-performing region was East Europe and Central Asia, which went through a transition period in the 1990s. Growth was positive only in one-third of the spells in the region, and both positive and pro-poor in only 12.3 percent of the observed spells, i.e. in less than one in eight. Growth was negative in two thirds of the spells, and in addition anti-poor in rather close to half of the spells (45.6 percent).
Which factors determine growth patterns, whether positive or negative in the mean, and whether pro-poor or anti-poor? The study focused on macroeconomic, structural and institutional determinants such as inflation, openness to trade, share of agriculture in GDP, and the rule of law. The strength of the association between each of these factors and growth patterns was statistically tested. In recent years, policy makers have placed increased emphasis on price stability. Monetary policy has been geared toward the achievement of low and stable inflation. When inflation is
high and unpredictable, businesses and households are expected to perform poorly, and vice versa. The study found a statistically insignificant relationship between inflation and rates of mean growth, but a highly significant negative relationship between inflation and pro-poor growth. Thus, lower inflation is associated with pro-poor growth, and vice versa.
Openness to international trade was measured by exports plus imports relative to GDP. Contrary to conventional wisdom, the study found that low levels of trade openness were significantly associated with positive growth and high level of trade openness with negative growth; the statistical relationship with the pro-poorness of growth was insignificant.
Regarding the share of agriculture in GDP, the study found an overall insignificant relationship with positive growth, but a positive relationship where the
agricultural share of GDP ranges between 20-30 percent. The results indicate an insignificant association between the share of agriculture and pro-poor or anti-poor growth.
The rule of law was not found to have any statistical significant association with either mean growth rates or pro-poor growth. It should be kept in mind that
conclusions emerging from cross-country analysis must be interpreted with care. They indicate only the average picture across a large number of countries. Individual country experiences may be quite different. Hence, the policy conclusions emerging from cross-country analysis should only be used as a reference for further analysis in individual countries. Son, Hyun H. and Nanak Kakwani (2006) Global Estimates of Pro-Poor Growth, IPC Working Paper series No. 31, IPC, Brazil. http://www.undp-povertycentre.org/pub/ IPCWorkingPaper31.pdf
Table 2
Summary results by various country groupings
Low-income countries 20.8 33.3 54.2 27.8 18.1 45.8
Low middle-income 26.7 31.4 58.1 19.0 22.9 41.9
Upper middle-income 21.7 35.0 56.7 21.7 21.7 43.3
Heavily-indebted poor
countries, HIPC 18.6 27.1 45.8 32.2 22.0 54.2
East Asia & Pacific 17.1 57.1 74.3 17.1 8.6 25.7
East Europe & Central Asia 12.3 21.1 33.3 21.1 45.6 66.7
Latin America & Caribbean 30.4 29.1 59.5 24.1 16.5 40.5
Middle East and North Africa 35.7 14.3 50.0 28.6 21.4 50.0
South Asia 29.4 52.9 82.4 11.8 5.9 17.6
Sub-Saharan Africa 20.0 34.3 54.3 31.4 14.3 45.7
All countries 23.2 32.1 55.3 22.4 22.4 44.7
Country groupings
Positive growth Negative growth
Pro-Poor Growth and
Gender Inequality:
Insights from new research
Stephan Klasen, University of Göttingen
Research shows that gender inequality in education and employment has a negative impact on economic growth. This is an issue in all
countries but there is large regional variation in the gender inequality aspects that are most harmful to pro-poor growth. Gender inequality impacts much more on growth rates than on overall income inequality. Country-specific policies are needed for promoting pro-poor growth through reducing gender inequality. The Unbalanced Distribution of Global Economic Growth
Between 1981 and 2001, world GDP (PPP in 1993 prices) increased by $18.7 billion. Of this, only $786 billion, or 4.2 percent, went to poverty reduction as defined by the $2-a-day poverty line—slightly less than the share of the poor in GDP at the beginning of the period—even though the poor represented the majority of the world population. Poverty reduction based on the $1-a-day poverty line was even smaller, at $278 billion—just 1.5 percent of GDP.
To put it another way, of every $100 of growth in income per person in the world between 1981 and 2001, just $1.30 contributed to reducing poverty as measured by the $1-a-day line and a further $2.80 to reducing poverty between $1-a-day and $2-a-day lines. The remaining $95.90 went to the rest of the world population above the $2-a-day line.
Redistributing just 1 percent of the income of the richest 20 percent of the world’s population to the poorest 20 percent would benefit the latter as much as distributionally equal growth of around 20 percent. Even expanding the target group to the poorest 50 percent of the world’s population—equivalent to a poverty line of around $2.50 per day at 1993 prices—and the source group to 25 percent (roughly the level at which the well-being literature indicates that further increases in income cease to raise well-being), a 1 percent redistribution is equivalent to economic growth of 7.4 percent. This is more than four times the average 1.7 percent per capita growth rate of global GDP (in PPP terms) since 1981.
D. Woodward and A. Simms: Growth is failing the Poor: The Unbalanced Distribution of Global Economic Growth. UN-DESA Working Paper No. 20, March 2006.
Pro-poor growth
, i.e. rates and patterns of economic growth that are associated with significant increases in the incomes of the poor, is central to reducing absolute income poverty and thus to reach the first Millennium Development Goal. Pro-poor growth will be particularly high in environments of high economic growth associated with pro-poor distributional change. Given the existing literature on the impact of gender inequality on growth, and on various well-being outcomes at the household level, the recently completed international research project on Operationalizing Pro-Poor Growth (OPPG) included an analysis of whether and to what extent reduced gender inequality can contribute to pro-poor growth.An analysis of the impact of gender inequality on pro-poor growth has to deal with the problem that income poverty is defined and measured at the household level and cannot easily be
attributed to individual members for conceptual and practical reasons. As a result, intra-household gender inequalities will not be captured; and policies that help reduce such inequalities will not have an impact on measured poverty beyond their effect on total incomes.
From a well-being perspective, such an income-based approach will not be very helpful in investigating the inequality of the gender distribution of the benefits from growth and poverty reduction. In poor countries, many women and older girl children are engaged in non-market production that is not captured in the standard income concept used in household surveys. They nevertheless produce valuable outcomes, such as better health, education, and nutrition of their families and children. Neither their contribution nor the outcome of their contribution is directly visible in an
Gender and macroeconomy
Gender inequality within households suggests that the bargaining power of the different family members influence consumption and saving behavior and other economic variables of choice to the household. If these differences are systematic and pervasive enough, they may also lead to differences in macroeconomic outcomes. One key finding is that women tend to devote a larger share of household resources to activities that are necessities to the household and that foster the growth of their children’s capabilities. Some evidence also suggests that women are more oriented toward productive saving and investment behavior, though they are less likely to take financial risks. Further evidence indicates that women’s political empowerment leads to support for a larger role for public insurance. Altogether, these differences suggest that policies that give women greater control over household decisions can strengthen aggregate economic growth while at the same time moderate macroeconomic instability.
Janet Stotsky: Gender and Its Relevance to Macroeconomic Policy: A Survey. IMF Working Paper, WP/06/233.
income-based concept of pro-poor growth. It will only show up indirectly in our income-based measures if the outcomes of their household production lead to increases in earned incomes. Thus, a narrow lens focusing only on income poverty neglects very important contributions of women to non-income well-being outcomes of household members. However, this brief summary article about pro-poor growth in the income dimension has to use such a lens. Both theoretical and empirical research indicates a negative impact on overall economic growth of gender inequality in education and also in employment opportunities. It is much less clear, however, whether and how gender inequality affects inequality between households across the income distribution. That depends on whether gender gaps and their impact on incomes are larger within poor or rich households, and this varies a lot with country-specific circumstances. The 14 country case studies1 in the OPPG
work clearly illustrate the large regional differences regarding which aspects of gender inequality impose critical constraints on pro-poor growth.
In most of Sub-Saharan Africa, high fertility and gender inequality in education remain the key constraints to women’s access to formal sector employment and to their productivity in the informal and agricultural sectors where they are main participants.
Also, significant gender gaps in access to productive assets and inputs into agriculture, viz. land, fertilizer and modern technologies, seriously limit pro-poor growth. In addition, poor access
to water, fuel and markets cause serious time poverty, further reducing women’s economic capabilities. And AIDS places an extra time burden on women in the affected countries.
In South Asia as well as North Africa, fertility decline is well under way, but large gender gaps in education in some parts and employment opportunities virtually everywhere remain central constraints for pro-poor growth. However, in Bangladesh, Southern India, and Tunisia much lower gender gaps in education, combined with labour-intensive export-oriented growth strategies, have enabled women to make important contributions to pro-poor growth while also enhancing their incomes and bargaining power. In Latin America, low fertility and low gender gaps in education have created a favourable environment for women to contribute to pro-poor growth. But they are held back by significant barriers and discrimination in the labour market and are often crowded into informal sectors.
In East Asia, the pro-poor growth success is in considerable part due to the contribution of women in agriculture as well as export-oriented growth strategies. Low fertility and low gender gaps in education and employment were helpful factors. The central remaining barrier is continuing gender
discrimination in the labour market, both in pay and career advancement.
Gender and growth issues in case study countries Region Sub-Saharan Africa South Asia and North Africa Latin America East Asia Transition Countries Countries include Burkina Faso, Ghana, Senegal, Uganda, Zambia Bangladesh, India, Tunisia Bolivia, Brazil, El Salvador Vietnam, Indonesia Romania Growth-relevant gender issues High fertility, significant gender gaps in education, low levels of female education, low female share of formal employment, inequality in access to land and inputs, time poverty
Moderate fertility, large gender gaps in education and employment, rising female employment in manufacturing/services Moderate fertility, low gender gaps in education, high female labour force participation, but unequal access to formal sector Low fertility, low gender gaps in education, large female participation in export industries, large pay gaps
Low fertility, no gender gaps in education, high female labour force participation
Differences within region Role of AIDS in imposing time burden on women and affecting human capital accumulation (Zambia, Uganda); Levels and gaps in education (lower in Uganda, Ghana); separate versus joint production in agriculture (West Africa versus Eastern and Southern Africa)
Higher female education and expansion of female employment (Bangladesh and Tunisia)
Important role of women in export production (El Salvador)
Role of transition on employment opportunities of women (Vietnam)
Depth of economic crisis affects female employment changes
Trends in priority gender issues Little change in fertility (except Ghana) and in education levels, and slow reduction of gaps (except Uganda), burden of AIDS worsening (except Uganda), little change in access to land and inputs
Strong fertility decline, sharp expansion of education, quick reduction of gaps (except India), large expansion in female employment (exception India) Strong fertility decline, further expansion of education, large expansion of female employment
Rapid expansion of female education and employment in manufacturing (including exports) and services; slight reduction in gender pay gaps
Decline in female employment and relative pay
1. Burkina Faso, Ghana, Senegal, Uganda, Zambia; Tunisia; Bangladesh, India; Bolivia, Brazil, El Salvador; Vietnam, Indonesia; and Romania.
In transition countries, women have historically contributed strongly to growth through high education and labour market participation. The challenge here is to ensure that these gains for women are protected in the transition process where in many countries gender gaps in education and employment are re-emerging, to the cost of women as well as the entire societies. Similarly, opportunities to combine work with family are strongly curtailed, further undermining women’s previous strong roles in the labour market. This very cursory summary suggests that gender inequality is an issue in all countries but the nature, extent, and effect of gender inequality differs greatly by region. It is probably fair to say that in most of Sub-Saharan Africa and South Asia the high potential contribution of women to poor-poor growth is particularly constrained while in East Asia, the important contribution of women can be nicely demonstrated.
The central importance of reducing the gender gaps in education is also demonstrated in the diagram, which shows the correlation between the rate of pro-poor growth in the 14 OPPG case study countries, i.e. the average rate of income growth of households below the poverty line, and initial gender gaps in secondary education. The diagram clearly suggests that pro-poor growth is higher in countries where gender gaps in secondary education are lower, although no straight causality can be inferred through this cross-country correlation. Other cross-country correlation diagrams for the group of 14 OPPG countries are shown in the book chapter under reference below. They demonstrate the correlation betwee the rate of pro-poor growth and, respectively, initial fertility rates and the annual increase in female labour force participation rates. They show similar although somewhat less robust patterns of correlations.
Further analyses reveal that the impact of gender inequality on pro-poor growth is mostly a result of the effect of gender inequality on economic growth rates, and not so much of the effect of gender inequality on income inequality. Thus addressing gender inequality will promote pro-poor growth by accelerating overall economic growth. Which types of gender inequality matter the most for promoting growth depends on the region and country. This calls for region/ country-specific policies for promoting pro-poor growth through reducing gender inequality.
Klasen, S. “Pro-Poor growth and gender inequality. “ In Menkhoff, L. (Ed.) Pro-Poor Growth: Policy and Evidence. Berlin: Duncker & Humblot (2006), 151-179. http://wiwi.uni-goettingen.de/vwlseminar/ working_papers/ibero/DB151.pdf
Pro-poor growth is a function of the pattern as well as the pace of growth.
Distributional changes need to be analysed to inform policy
responses to ensure that growth reduces poverty more efficiently. Growth incidence curves provide a useful graphical tool for observing growth and distribution together. Some typical curves based on new data are shown and interpreted in several distributional dimensions.
Analysing the
Distributional
Pattern of Growth
by Andy McKay, University of SussexThere is
widespread agreement that economic growth plays a very important role in poverty reduction. The recent experience of China provides an emphatic example of this, while many other examples, often in Sub-Saharan Africa, show how difficult it is to achieve poverty reduction without growth. But its distributional pattern also matters. Where richer members of society capture the benefits of growth, its poverty reduction impact is limited or undermined. From a pro-poor growth perspective, the key question then is whether poor women and men are able to participate in, or otherwise benefit from, economic growth. This may be through direct participation in productive activities, for example through increased real wages, new employment opportunities or increased returns in self-employment activities. The poor may also benefit indirectly from increased public spending or private transfers made possible by increased revenues from growth. The extent to which the poor share in this will depend on many factors including the pattern of growth, the nature of poverty (who/where/why), the institutional context and the policy environment. To assess this, it is important to examine the income distribution. In policy and research circles, discussions on growth, poverty and inequality are often conducted separately, despite the fact that they are clearly interlinked. This is partly a data issue. Standard national accounts data typically enable a disaggregation of economic growth by productive sector, but not of the distribution of incomes among poor or non-poor income-earners, nor by region. Analysis of poverty and inequality is generally based on household surveys and other micro-level data sources. Where household survey data areavailable at two points in time, policy analysts can assess the distributional pattern of growth by examining data on changes in household income or consumption over this period.
There are many different approaches to this, including through decomposition of changes in poverty into growth and distribution components. A useful graphical way of presenting such data to policy analysts is by means of a growth incidence curve, as illustrated for four countries in the diagram. The growth incidence curve (GIC) summarises how the different statistical percentiles of the income distribution fared over the period of time between the surveys: the rate of change in income or consumption across the population. The GICs are based on a comparison between survey data at two points in time, for example 1992 and 2003 in the case of Vietnam. The horizontal axis of the graph plots the population by percentile from the poorest 1 percent to the richest 1 percent. The vertical axis plots the annual change in income (or consumption) between these two points in time for each percentile. The shape and position of the curve provides important visual insights about the distributional pattern of growth. It can also be used to assess the changes in poverty that the growth pattern implies. The shape of the GIC provides information about the distributional pattern of growth and thus about the implied change in inequality. Where the GIC is broadly upward sloping (Bangladesh and Vietnam here), this shows that consumption levels increased at faster rates for higher percentile groups compared to lower percentile groups. This implies that inequality increased over this period. Where the GIC is downward sloping (as in the case of Indonesia here) this implies that
inequality fell; the recession associated with the East Asian crisis over this period hit everyone, but the impact seems greater in the richer percentiles. These examples also illustrate the difference between absolute and relative concepts of pro-poor growth. In Vietnam growth was pro-poor in an absolute sense, and poverty fell; but growth was not pro-poor in a relative sense. In Indonesia inequality fell (pro-poor change in a relative sense), but growth was negative and poverty increased. Thus, growth was not pro-poor in an absolute sense. The position of the GIC also allows conclusions to be drawn about the change in poverty. Where the curve is always above the zero axis (as in the cases of Bangladesh and Vietnam here), this means that all absolute measures of poverty will have fallen over this period, whatever the poverty line set. The magnitude of the reduction still depends on where the poverty line is set, and the GICs provide a quick visual summary of how the magnitude of change would be different for example on the very poorest. Similarly in the case of
Indonesia, headcount poverty rose over this period for any poverty line, but the magnitude of the rise would be less for lower poverty lines. When the GIC crosses the axis as in the case of Zambia, the conclusion about changes in poverty will depend on where the poverty line is set and on which poverty measure is selected.
Growth incidence curves thus provide a quick graphical summary of the distributional pattern of growth between two periods in time. They provide an important starting point for analysing what underlies the observed distributional pattern of growth, and hence for the formulation of policy reforms and poverty reduction strategies. The same technique can be applied to subgroups of the population, and this can be very informative. Growth is often highly spatially differentiated within a country, and this may be very relevant to assessing the poverty reduction potential in growth. In the case of Ghana over the 1990s, national level data shows an upward sloping GIC
above the zero axis, i.e. poverty reduction with a modest increase in inequality. But GICs for different localities in the country show a diversity of experience. In the rural areas of the country’s forest zone, its main export producing area, growth was relatively fast throughout the distribution; but in the rural areas of the savannah in the north of the country (the poorest locality to begin with) the GIC was in fact below the zero axis between about the 10th and 65th percentile.
In other words growth was highly spatially differentiated, and this was an important factor making growth less pro-poor than it would otherwise have been. This is important information for policy purposes in trying to achieve pro-poor growth: it is not sufficient to just consider the economic growth rate in aggregate. Similarly the Zambia pattern in the above diagram reflects very different experiences in rural and urban areas of the country. Spatial differentials in growth are an important factor in many countries, and of particular relevance for pro-poor growth policies, especially if the lagging regions are poorer to begin with. Similar analysis for other subgroups – for example employment categories – can also be very informative, and directly related to key policy questions.
GICs are only a tool for presenting the distributional pattern of growth; but much of the value comes from seeking to understand the factors underlying the observed patterns. As a graphic tool though they have a number of
advantages. In particular they are a convenient means of considering growth and distribution together; they do not depend on a specific poverty line; and they can enable a specific analytical and policy focus on the poor according to any relevant definition. The technique can also be applied to measures of non-income dimensions of wellbeing.
However, GICs do not provide information on household mobility along the income distribution because the composition of each percentile is not the same in different surveys. Understanding the processes by which some households improve their incomes while others are not able to is important for policy analysts interested in pro-poor growth, but this requires panel or longitudinal data, i.e. observing the same households at different points of time.
Grimm, M., S. Klasen and A. McKay (eds.); Determinants of Pro-Poor Growth: Analytic Issues and Findings from Country Cases. Palgrave-Macmillan, 2007.
While a broad
consensus has been reached on the respective roles of growth and inequality in reducing poverty, we still know little about the policies and strategies which enable poor households to participate in and benefit from growth. Recently completed studies of eight countries1 that have beenrelatively successful in delivering pro-poor growth provide important insights. These studies integrate growth analytics with the micro analysis of household data to determine how country policies and conditions interact to reduce poverty and to spread the benefits of growth across different groups.
To what extent was growth associated with poverty reduction in the sample of countries? Not surprisingly, countries that experienced the strongest growth also had the greatest poverty reduction in the 1990s. The correlation between changes in poverty and in GDP per capita was negative and significant as seen in the lower part of the figure.
But to what degree did inequality hamper the poverty reducing impact of growth? Rising inequality over the 1990s offset the gains from growth in five of the fastest growing countries.2
In Bangladesh rising inequality meant that poverty fell by only 9 percentage points between 1992 and 2000, instead of 16 percentage points if growth had been distribution-neutral. If inequality had not increased in Uganda between 1992 and 2002, the poverty rate would have 30 percent instead of 38 percent. Comparing changes in the mean growth rate in consumption of the poor (RPPG, the rate of pro-poor growth) with changes in average consumption for the whole population provides a more precise measure of the impact of growth on the well-being of the poor
Promoting Pro-Poor
Growth:
Lessons from
country experiences
by Louise Cord,the World Bank
and non-poor. The upper part of the figure shows that the RPPG is positive for all countries except Indonesia, but less than the average growth rate in mean consumption, except Brazil. Thus, inequality between the poor and the non-poor rose on average among these countries. These results underscore that growth, although extremely important, does not explain all the variation in poverty reduction. Initial inequality and changes in inequality are also important factors which can limit the extent to which the poor participate in and benefit from growth. What insights do these eight countries provide for poverty reduction strategies? The specific policies adopted by the eight countries differed, as did the role of exogenous forces in affecting growth and hence poverty reduction. However, some common threads emerge. The country studies underscore that a successful shared growth strategy needs to have, at its core, measures for sustained and rapid economic growth. These measures include macroeconomic stability, well-defined property rights, trade openness, a good investment climate, an attractive incentive framework, well-functioning factor markets, and broad access to infrastructure and education. These cases alsosuggest that it is important to design policies which enable poor people to participate in and benefit from growth. This task requires a conscious and sustained effort on the part of governments to provide the basic conditions necessary for broad-based growth in the regions and sectors where the poor live and work.
Since labour is the most abundant asset of the poor, it is hardly surprising that Recent country studies
confirm the strong correlation between economic growth and poverty reduction. The rates of pro-poor growth were almost all positive, but lower than GDP growth due to increasing inequality. Poverty reduction strategies need to focus on job creation and growth in sectors and regions where the poorlive and work. This includes both agriculture and non-farm activities, and involves education, labour market policies and public investment.
1. Bangladesh, Brazil, Ghana, India; Indonesia; Tunisia; Uganda and Vietnam.
the most successful experiences with poverty reduction have occurred where policy has supported the creation of attractive jobs, accessible to poor households. Given the concentration of poor households in agriculture, this strategy rests in part on making agricultural activities more productive. Improved access to markets and
technology, strengthened property rights, and better methods of risk management may each have a role to play.
But since growth in non-agricultural activities has tended to be much higher than in agriculture, a strategy of shared growth also rests on enabling the poor to take advantage of rural non-farm and urban employment opportunities. Improvements in the investment climate and infrastructure, expanded access to secondary education (particularly for girls), and reform of labour market regulations may all feature in such a strategy. Are there particular country conditions which are prerequisites for shared growth? The case studies suggest that successful strategies can be forged even under initially unfavourable conditions. The experiences of Bangladesh, Indonesia, and Uganda testify that countries can achieve high rates of growth and poverty reduction even when faced with weak institutions, poor human development outcomes, and weak trading links and infrastructure assets. And impressive rates of poverty reduction and growth occurred under a variety of political regimes. But whether more or less democratic, the eight countries had in common a political leadership that was committed to achieving growth and poverty reduction. Indeed, even in the absence of democracy, poverty reduction largely occurred because the incentives of the political elite were aligned behind that goal.
The eight countries represent a diverse sample: the policies outlined above were implemented to various degrees in each of them; and because of different initial conditions and exogenous factors not all of the policies increased the ability of the poor to participate in growth to the same extent. Nonetheless, these cases share enough in common to underline certain core principles for achieving shared growth. In particular,
three pillars – good macroeconomic and structural economic policies, political stability, and public investments in physical and human capital – were essential in facilitating private initiatives and investments among the non-poor and especially the poor. Political regimes and the quality of institutions also affected outcomes, but drawing
conclusions about their impact on growth and poverty reduction is difficult, as many countries were innovative in overcoming their institutional weaknesses.
The experience of these eight countries in the 1990s underscores three
challenges for analysts and policymakers as they seek to accelerate poverty reduction through broad-based growth. First, movement from agricultural to non-agricultural employment helped raise the incomes of poor households in many countries, but the more educated and better-connected workers were more successful in this regard. The effects of education and labour market policies on sectoral mobility are important areas for further research. Second, the impact of growth was uneven across regions within countries. Public investment strategies that can address sub-regional
growth and poverty are another important area for further analysis. Third, country wide indicators of political regime often do not take into account the institutions which matter most for the poor. Sub-national and sectoral institutional indicators – including the share of land that is titled in rural and urban areas, the quality of local service delivery, and corruption and governance indicators which reflect regional variations – would help us to better understand the differentiated institutional fabric of developing countries, yielding important insights into how local and national conditions affect the impact of institutions on the poor.
These areas of future research promise to advance an important analytical agenda. The application of a pro-poor growth lens to development challenges can cast light on the economic and systemic constraints facing the poor and enhance the design of policies to ensure that they are among the principal participants in and beneficiaries of growth.
Timothy Besley and Louise J. Cord (eds): Delivering on the Promise of Pro-Poor Growth, New York: Palgrave, 2006. Notes: 1) RPPG = Rate of pro-poor growth, which is a different measure than the pro-poor growth rate in the
articles on pages 3 and 24.
2) The x-axis in the upper part shows consumption, in the lower part GDP per capita. These are measured by different methods, hence the different horizontal positions of some countries.
Income from work
, for wages or as self-employed, is crucial for the livelihoods of most people. Thus, employment is the key link between economic growth and income poverty reduction. The majority of all people who live in poverty are either unemployed or under-employed. They lack sufficient work or, more commonly, are trapped in employment of such low productivity that – even with long, hard hours – it pays too little to enable them to escape poverty. Yet, employment and labour market analysis is seldom at the fore of economic analysis, if at all included. The creation of productive employment opportunities is still often seen as a side-effect rather than as an objective of economic growth. Despite the bulging literature on pro-poor growth (PPG), the scant regard paid to employment aspects in economic analysis also implies that the mechanisms translating economic growth into reduced poverty remain rather poorly understood. The traditional analytical approach has been to focus on economic growth per se, as a necessary, albeit not sufficient, condition for reducing poverty. An alternative, and arguably more helpful approach is to view people living in poverty as creators of growth rather than as recipients of its benefits; i.e. as economic actors – whether self-employed producers or employees of a firm. Economic growth is the aggregate result of the efforts of all economic actors to increase their incomes. Thus, it is not growth as such that reduces poverty, but people, including those living in poverty, who individually or collectively create growth and improve their material well-being in the process.For growth to reduce poverty efficiently the poor need to be able to participate
fully and on an equal basis in the economy. Enhancing employment and returns to labour by (i) strengthening the productive resources and capacity of the poor and (ii) creating opportunities for everyone to make full use of the
productive resources at hand, is the main avenue for reducing income poverty and achieving pro-poor growth.
Productive employment thus becomes the natural entry point – as well as an indispensable integral part – of economic analysis that has poverty reduction as a key objective. Indeed, a more holistic approach to economic analysis, which puts employment, labour productivity and incomes in focus, is needed to sharpen the poverty focus. We have developed an integrated economic analysis (IEA) approach, which aims to improve the understanding of the determinants of pro-poor growth at the country level, by integrating employment analysis, macroeconomic analysis and business environment analysis. This approach opens up for considerable synergies and has proven to have considerable merits. Based on an analysis of the context specific development dynamics, challenges and opportunities, it aims to identify the binding constraints on pro-poor growth with a view to facilitate informed prioritisation in policy-making. The focus on the economic actors also makes it conceptually easier to incorporate cross-border labour migration into the analysis. The employment analysis covers all workers irrespective of whether they work within or outside the country, while the business environment analysis is supplemented by a migration climate analysis that follows the same logic as an investment climate analysis. Economic growth is the
aggregate result of the efforts of all economic actors to increase their incomes. For growth to reduce poverty efficiently the poor must be able to participate fully and on an equal basis in economic growth. Employment is the key link between economic growth and income poverty reduction. We need an integrated analysis of employment, the macroeconomy and the business environment in each country.
by Susanna Lundström and Per Ronnås, Swedish International Development
Cooperation Agency, Sida
Integrated Economic
Analysis for Pro-Poor
Growth
Traditional labour market analysis is less meaningful in developing countries where most of the labour force is self-employed, as it tends to assume that different actors account for the supply and demand for labour, viz. there are employees and employers. The IEA largely solves this problem by integrating the employment analysis with the business environment analysis. The latter is in practice, though often unwittingly, tantamount to an analysis of the demand side of employment (i.e. creation of jobs and income) – directly for the self-employed and indirectly for the wage employed. The self-employed are in fact more or less identical with the economic actors in a business environment analysis. By integrating business environment analysis and macroeconomic analysis with the employment analysis, the demand for labour is not only assessed, but causes behind inadequate demand and low productivity/ income
opportunities are also identified. The business environment analyses is greatly enriched by being linked to employment analysis, as the latter provides information on the characteristics of the economic actors with regard to
endowment with human resources
(education, skills), strengths and
weaknesses etc. Such knowledge is crucial for assessing the particular needs of different economic actors – such as the poor and resource-weak, and the impact on these groups of deficiencies in the business environment.
Thus, it facilitates a sharper poverty focus in the business environment analysis by highlighting how deficiencies in the economic environment affect the smaller and weaker economic actors, i.e. the poor. Another major advantage of integrating employment and business environment analysis is that the dynamics of the informal economy become part and parcel of the analysis.
Linking macroeconomic analysis with labour market and business environment analysis brings several advantages. It makes it easier to identify structural causes of both macroeconomic vulnerability and of stability-related constraints on growth. It also helps shift the focus from short-term remedies for acute macroeconomic problems towards long-term macroeconomic stability, by addressing root causes of instability. In the final stage of the IEA analysis, the findings and conclusions from the
employment, macroeconomic and business environment analyses are brought together with a view to identifying the binding constraints on enhancing employment, labour productivity and returns to labour i.e. the binding constraints on pro-poor growth. The IEA approach captures not only growth constraints that are due to low productivity (technology, institutions, risk, etc) or low levels of input of production factors (land, labour, capital), but also those pertaining to low mobility of labour and poor and unequal access to economic and employment
opportunities. Moreover, IEA aims at identifying a bundle of constraints rather than the binding constraint, and
emphasises the need to sequence the relaxation of constraints. Finally, it is important to recognise the time lag between policy and impact; some constraints that are not immediately binding may need to be addressed now in order not to become binding later. The IEA should be regarded as an integral part of country analytical work, which should draw on and complement existing economic analysis, and as a tool to identify knowledge gaps to inform future studies.
The broad integrated approach to economic analysis, its strong focus on the poor as economic actors and on aspects (employment, productivity and returns to labour) that have a direct impact on poverty, as well as the identification of binding constraints makes it well suited as an analytical tool generating knowledge for prioritisation of policies and as input into national poverty reduction strategy (PRS) processes. It can also be helpful in the identification of result indicators. A methodological guideline based on the IEA approach, as well as several empirical country studies based on this approach, have recently been published by the Swedish International Development Cooperation Agency (Sida).
Integrated Economic Analysis for Pro-Poor Growth. Sida Methods Document, Stockholm, September 2006. http:// www.sida.se/shared/jsp/download.jsp?f= SIDA30631en_IEA_web.pdf&a=25631
The incomes of the poor depend on the nature and extent of employment that economic growth generates. Slow employment growth has been a major correlate of slow poverty reduction in developing countries. While East Asia is the best example of pro-poor growth in modern history, growth in China and India has been far less employment friendly. Macroeconomic stabilization can reduce economic growth and damage its employment Intensity.
by Azizur Rahman Khan, Columbia University
The role of
employment inpro-poor growth has been increasingly emphasized in the analysis of development policy in recent years. The incomes of the poor largely depend on the nature and extent of employment that economic growth generates. But there is no automatic relationship between growth and employment and not all growth is equally employment intensive. This article focuses on the employment intensity of growth.
The bulk of the income of the poor comes from labour, even when they have some assets such as land that enables their labour to be used in productive activities. Thus, increased employment with improved rewards is key to poverty reduction. More specifically, growing incomes for the poor can come from increases in: (a) wage employment; (b) real wage; (c) self-employment time, productivity and output prices. All these factors are associated with high rates of economic growth. But growth is not equally employment intensive everywhere. East Asia is the best example of pro-poor growth in modern history, characterized by a high employment intensity of growth, whereas the more recent rapid growth of China and India has been far less employment friendly.
Employment intensity of growth can be measured by the gross output elasticity of employment (GOEE), the ratio of growth in employment to growth in output. In a developing country this can be meaningfully measured only for industries and modern services. For traditional agriculture and informal activities the measurement of GOEE can often be misleading due to variations in the degree of underemployment in these sectors of residual employment category.
Employment and
Pro-Poor Growth
The central elements of East Asia’s remarkable success in poverty reduction have been their very high rates of growth and the high GOEEs of the fast-growth sectors: industries and modern services. The growth in employment and its remuneration, as well as a shift in its composition towards higher productivity sectors, were the principal forces behind the dramatic reduction in poverty. Recent economic growth rates in China and, lately, India have exceeded those of East Asia at its peak. But the success of these countries in poverty reduction can not be said to be nearly as remarkable as that in East Asia. One critical feature of growth in these countries that largely explains the difference is the low GOEE of their growth sectors.
Several sets of country studies by the International Labour Organization (ILO) and UNDP show that slow employment growth has been a major correlate of slow poverty reduction in developing countries. And almost without exception, slow employment growth was associated with low GOEE.
In Asia, manufacturing employment decreased in the 1990s, largely driven by China despite its extraordinarily rapid industrial growth. In other Asian countries, growth in manufacturing employment was slower than in the 1980s except in India, which however still had a very low absolute elasticity. This was an obstacle to the change in the composition of employment away from low-productivity agriculture in favour of higher-productivity industries.
In a new study1 of eight Asian countries
only one, Malaysia, had the right kind of long-term employment growth, while in China, India and post-Asian-crisis Indonesia and Thailand it has been low
and declining over time. In the two most rapidly growing economies, China and India, the problem has been a sharp fall in the GOEE, and in Indonesia and Thailand it was due to reductions both in the GOEE and in growth rates. In Cambodia, the Philippines and Sri Lanka it was by and large due to growth being too low and/or bypassing the large sectors where the poor eke out a living.
Why was industrial growth, including that in the most rapidly growing countries, so employment hostile? A major explanation is inherent in the nature of the transition from inward-looking, regulation-based, import-substituting industrialization (ISI) policy regimes to ones based on greater competition and integration with the global economy. While the incentive system in the latter is more employment friendly than in the former, the transition itself entails the laying off of vast numbers of workers inefficiently absorbed in the payroll, principally but not exclusively of state enterprises (the most prominent case being China).
A second source is a sharp sudden shift in the composition of incremental output in favour of activities with low labour intensity, either in response to such factors as opportunity thrown open by the global economy, e.g. India’s rapid IT-led growth, or due to loss of competitiveness in some labour-intensive exports. An example of the latter is reduction in access to credit for small labour-intensive enterprises in a period of macroeconomic contraction. The transition away from ISI regimes is indeed desirable and a change in the composition of incremental demand for exports is by itself nothing to be preempted. But appropriate and timely transitional measures of sufficient magnitude – increased employment in public works, retraining of laid-off workers, a more transparent system of unemployment insurance, and the prevention of the erosion of competitiveness in labour-intensive industries – should have been implemented to offset their negative impact on employment growth.
Employment performance is powerfully influenced by macroeconomic policies. In five of the seven Asian countries
in difficulty (see above), higher economic growth would help overcome the problem. Far too often disproportionate macroeconomic stabilization has reduced economic growth to rates that simply are too low to permit adequately high rates of employment growth even when employment intensities are high and intact. But macroeconomic contraction can also damage the employment intensity itself through its asymmetrical impact on enterprises differing in factor intensity. Employment hostility of industrial growth has contributed to the slowing and even a reversal in the so-called Lewis transition – reduction in absolute employment in agriculture – that is the hallmark of all successful cases of growth. In East Asia this transition took place early and rapidly: in South Korea agriculture’s share of employment fell from nearly a half in 1970 to about a sixth in 1990 and the absolute fall in agricultural employment started right at the beginning of the period. China, with a faster rate growth between 1980 and 2000 than what Korea achieved during the above two decades had a far slower fall in agriculture’s share of employment, from 69 percent to 46 percent. Absolute employment in agriculture started falling after 1991, but this trend was reversed after 1996, due largely to a negative growth in industrial employment. The resulting rise in the gap between agriculture’s share of employment and its share of GDP led to a further worsening of the already large gap between rural and urban areas in terms of output per worker and income per person.
Since most of the poor are rural residents, this was detrimental to the welfare of the poor.
Another study2 of ten Asian countries
shows a recent increase in agriculture’s share of total employment in five: Armenia, Kyrgyz Republic, Mongolia, Indonesia, and Cambodia. This was because industries and related modern activities failed to absorb labour and, in several of these cases, the absolute number of workers employed by these sectors declined. Agriculture in these and most other low-income countries needs a smaller share of national employment and a larger share of national capital in order to boost productivity and reduce the gap in living standard and poverty between agriculture and the rest of the economy. Many countries further exacerbate the problem of rural and overall poverty by adopting policies and/or failing to offset changes that result in an adverse movement in agriculture’s terms of trade. China after the early1980s and Vietnam in the late1990s are examples of a decline in agriculture’s terms of trade slowing down the rate of rural and overall poverty reduction. The problem of low GOEE in the high-growth sectors underlines the importance of expanding the scope of
self-employment for the poor by improving their access to credit, technology, market and, above all, human capital which not only increases the productivity of self-employment but also the productivity and earnings of the wage-employed.
1. Khan, A. R., 2007, Asian Experience on Growth, Employment and Poverty, An overview with special reference to the findings of some recent country case studies, UNDP Regional Centre, Colombo and the ILO. 2. Khan, A. R., 2005, Growth, Employment and Poverty: An Analysis of the Vital Nexus based on some Recent UNDP and ILO/SIDA Studies, Issues in Employment and Poverty Discussion Paper 19, ILO, Geneva. Employment-friendly growth: a success story
In South Korea in the 1970s, a phase roughly comparable to China’s growth in the 1990s and India’s at the present time, the GOEE for manufacturing was approximately 0.7. With an annual growth rate of the fast-growing non-agricultural sectors exceeding 12 percent, employment in those sectors increased by more than 8 percent per year, soon making these sectors absorb the underemployed workers in agriculture and other traditional activities. This led to an increase in real wages at roughly the same rate as per capita GDP growth, and a trend reduction in absolute employment in agriculture.
by Esther K. Ishengoma, University of Dar es Salaam, and Robert Kappel, GIGA–German Institute of Global and Area Studies
Formalising Informal
Firms:
What can be done?
The informal sector plays an important role for poor women and men in developing countries. But the views differ on its contribution to poverty reduction and alleviation. Poverty forces people to engage in it and this is a dimension of living in poverty. Formalising informal firms is a challenge for improving the employment conditions of poor people.
The important
economic role ofthe informal sector (IS) in developing countries has drawn the attention of both researchers and policy makers. The IS links formal sub-sectors to consumers, and it supplies many low and middle income employees of the formal sector with goods and services. The IS accounts for around half of urban employment in Sub-Saharan Africa (SSA), and about one quarter of urban jobs in Latin America, while this share varied widely across Asia: 10-65 percent.
Informal sector wage employment is less frequent than self-employment, which accounts for 70 percent of IS jobs in SSA and about 60 percent in the other developing regions. However, self-employment is sometimes referred to as a community of the poor or non-dynamic part of the IS. This has triggered concerns among policy makers and in the ILO regarding the status of the IS and its relation to poverty. The IS jobs have poor working conditions and thus do not contribute much to poverty reduction. IS workers are poorly remunerated and
underemployed, and they lack social protection; their rights are less respected, and they are excluded from social dialogue and decision making. The situation is even worse for female informal workers, who earn much less on average than male informal workers.
IS workers run a high risk of injury and other health hazards, while lacking protection or safety nets to help them and their families survive on a reduced or cutoff income. Thus, it can be inferred that poverty forces people to engage in the IS and working in the IS is a dimension of living in poverty.
On the other hand, studies indicate that in the absence of informal incomes, a majority of formal sector households would have fallen deeper into poverty. This indicates a significant role for the IS in alleviating poverty, reducing its depth and severity. How, then, can the contribution of the IS develop from this role of just alleviating poverty to an exit strategy for sustainably reducing it through underpinning pro-poor growth?
The expansion of the IS and the deteriorating employment situation in many developing countries in SSA, Latin America and the Caribbean are associated with low GDP growth rates. Many of these countries have also faced high population growth rates and increasing numbers of job-seekers particularly among the youth. However, an increase in the economic growth rate of a country does not automatically result in the movement of workers from the IS to the formal sector. Despite high GDP growth rates, some East Asian countries have faced an increase in unemployment. Economic growth reduces the size of the IS only to the extent that it is pro-poor, i.e. accompanied by improvements in formal employment levels and income distribution.
There are several factors holding back the growth of informal enterprises. Some of the most import obstacles facing an informal sector firm are: limited human and working capital, poor location, obsolete technology, limited access to markets and to financial and business support services, complex and burdensome government regulations, lack of economic
infrastructure and a poor supply of public services.
A firm’s decision to operate formally or informally depends on several matters. Firms tend to formalise as the enterprise grows. Younger firms may choose not to participate in some societal institutions due to the uncertainty surrounding their future. While manufacturing sector firms employ a relatively high number of paid workers and tend to comply with labour regulations, IS resale sector firms commonly utilise more unpaid workers. Given the current business environment in developing countries, the opportunity costs of informality seem to be much lower than the cost of operating formally. Even small and medium enterprises (SMEs) with a higher degree of formality still face the same obstacles as their informal competitors. On the other hand, the cost of operating completely formally is very high for medium-size firms. This discourages SMEs to grow and increase their degree of formality.
Due to inefficient and poor property right enforcement coupled with corruption, most transactions among formal enterprises are coordinated by informal networks. Irrespective of their formality, SMEs and large manufacturing firms have limited access to long-term loans. In sum, total formality may mean having to close the operations of the firm unless the business environment is improved.
The quest for formalising enterprises needs to be addressed from various different angles, viz. reducing entry and operating formal costs, increasing the incentives for SMEs to operate formally, reducing obstacles to their growth, and searching for inexpensive approaches through which to enforce compliance with government regulations. This can be achieved by undertaking the following measures.
The reduction of entry costs can be accomplished by having a one stop-shop for registration, decreasing registration procedures, and increasing the effectiveness and efficiency of offices involved in the registration process. Following the approach of the Shanghai Municipal Government, the one-stop-shop can be organised at
different levels namely local, municipal/ district, regional and national. At local level it may need to facilitate the registration process by providing enterprises with all the information, helping them to meet all the registration requirements; while the hostile behaviour of government officials towards informal enterprises should be repressed.
The national tax system needs to be well structured, clear and transparent. Local levies may be transformed into fees for the use of community resources in order to encourage the efficient provision of local public services and accountability. Measures aimed at enhancing
accountability need to be taken. Property right registration and contract enforcement mechanisms which incorporate informal, popular rules need to be introduced. Ways to link multilateral private governance
structures and the formal judicial system may have to be found to simplify the process, increase its effectiveness and efficiency and improve its reach to all business operators.
Dual labour regulations and safety nets are often important for enabling informal enterprises to meet part of their labour contributions while staying in business and offering employment. It would be necessary to introduce dual safety nets for this purpose, whereby informal enterprises pay a certain percentage and the rest is covered by governments. Such schemes need to be spelled out in poverty reduction strategies and social protection policies. Informal enterprises may need to be sensitised to the need of improving employment and working conditions. This needs to be incorporated into training programs that target informal enterprises. NGOs, local public
governance structures, informal labour associations in cooperation with local and global lead firms need to encourage fair trade labelling.
Following the South African approach, training concepts for informal
enterprises need to be introduced in vocational training programs. Students
following these programs can be assigned to informal enterprises in order to conduct their practical tasks which would enable them to learn more as future entrepreneurs and facilitate the solving of problems faced by informal enterprises. The diversification of products offered by financial institutions may need to incorporate security insurance and the establishment of limited liability institutions to encourage high return-high risk investment. The provision of business and financial services needs to be very realistic and objectively evaluated.
Training programs designed for SMEs may need to incorporate modules focusing on improving worker capabilities. Employers should be encouraged to allow their employees to attend training courses which in turn may also increase their employment potential.
It is important to encourage the creation of informal-formal sector forward linkages. Measures to overcome exploitation need to be considered and implemented. Actors who add no value in the chain linking informal and formal firms need to be removed which can be done by facilitating the creation of direct links between value adding informal and formal enterprises. The formalisation of informal enterprises can be viewed as an empowerment process and a central feature of poverty reduction strategies recognising the key concept of capability poverty, because it entails legal/official recognition of the living conditions of the poor and their sources of income. This can be possible if the voices of IS employers and employees are empowered. If IS actors participate in decision making and the formulation of policies and regulations they may in turn be motivated to comply with them. Increased formalisation requires incentives; the provision of public infrastructure services needs to be efficient, reliable and affordable.
Ishengoma, E. K. and Kappel, R: Economic Growth and Poverty: Does Formalisation of Informal Enterprises Matter? GIGA WP-20/ 2006. http://repec.giga-hamburg.de/pdf/ giga_06_wp20_ishengoma-kappel.pdf