Supporting Information
Influence of Ether Solvent and Anion Coordination on Electrochemical Behavior in Calcium Battery Electrolytes
Nathan T. Hahn,a,b,* Darren M. Driscoll,a,c Zhou Yu,a,d George E. Sterbinsky,c Lei Cheng,a,d
Mahalingam Balasubramanian,a,c Kevin R. Zavadila,b aJoint Center for Energy Storage Research, Lemont, IL, 60439
bMaterial, Physical and Chemical Sciences Center, Sandia National Laboratories, Albuquerque, NM 87185 cAdvanced Photon Source, Argonne National Laboratory, Lemont, IL, 60439
dMaterials Science Division, Argonne National Laboratory, Lemont, IL, 60439
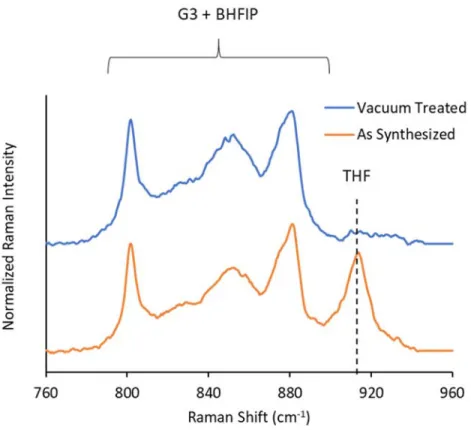
Figure S1: Raman spectra of 0.45 M CaBHFIP2/G3 produced by dissolution of a CaBHFIP2ꞏTHFx solvate
in G3. The species contributing to the observable vibrational modes are indicated. Measurements are compared before and after treatment by dynamic vacuum, confirming removal of the solvent of crystallization (THF) from solution.
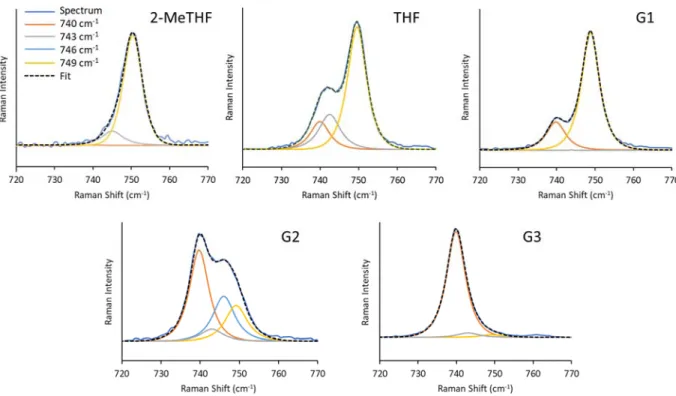
Figure S2. Spectral deconvolution examples for the TFSI breathing mode region measured by Raman spectroscopy for ~0.5 M CaTFSI2 solutions across the ethereal solvent series illustrating the distribution of
vibrational modes associated with various TFSI configurations as a function of solvent. The approximate frequencies of these modes are shown in the legend. For each example the frequency and line-width of the free/SSIP TFSI mode were tightly constrained (f = 739.8-740.0 cm-1, FWHM = 5.8 cm-1) whereas the
parameters of the other modes were allowed to vary to a limited extent in order to match the spectral line shapes. Small, broad features at 760 – 770 cm-1 were also observed but their origin is not clear at present
Figure S3: Measured potential of a mechanically abraded Ca rod reference electrode in ~0.5 M CaTFSI2
and ~0.2 M CaBHFIP2 electrolytes containing ~5 mM Fc through cyclic voltammetry (CV) of the reversible
Fc/Fc+ redox couple on a freshly polished Au substrate; scan rate = 50 mV/s. The Ca reference electrode
varied from -2.75 to -3.05 V vs. the E0
rev for Fc/Fc+. The Ca/Ca2+ redox potential was defined as -3.1 V vs.
Fc/Fc+ based on the zero-current crossing potential measured between calcium deposition and dissolution
in CaBHFIP2/G1, and this value was used to convert all solution potential axes (see Figure 6 in main text)
to Ca/Ca2+ based on these measured Fc/Fc+ potentials.
Figure S4. Example local solvation structure, coordination number (CN), and Ca-O bond distance from AIMD relaxation of CMD simulated structures. Fully solvated Ca2+ structures in (a) G1, (b) G2, and (c) G3
and a neutral ion pair structure in G1 (d). The green, red, cyan, white, blue, yellow, and pink ball denotes the Ca, O, C, H, N, S, and F atoms, respectively.
X-ray Absorption Spectroscopy Details
All EXAFS measurements were performed at the Ca K-edge. In the EXAFS, three multi-electron transitions appear at roughly 2.7, 3.1 and 10.3 Å-1.1-2 The multi-electron excitation (MEE) at 10.3 Å-1 was
accounted for using an arctangent correction function. The other two MEEs have little effect on the regions of interest in the r-space, Fourier transformed data and were therefore ignored.
In order to fit the experimental data of the CaTFSI2 salt dissolved in G3, an MD-optimized solvated
Ca2+ ion was used as a starting input. The starting-point Ca2+ cluster included 1 tridentate and 2 bidendate
G3 ligands, all interacting with the Ca2+ through oxygen bonds. Individual photoelectron scattering paths
for Ca-O, Ca-C and Ca-O-C were included to fit the data. The paths chosen, while approximating the contributions, are the minimum required to model the data that covers the r-range (1.6–3.5 Å). The k-window used of (3 – 11 Å-1), provides a r-space resolvability of ~0.15 Å for nearby neighbors of similar
identity (oxygen neighbors, for instance). Therefore, we took a single averaged Ca-O bond distance. Two unique Ca-C bond distances that were positioned roughly 0.16 Å apart and weighted appropriately based on their relative abundance were used. Additionally, Ca-O-C multiple scattering paths, appropriately weighted based on abundance, were also used. Each path contains 4 parameters that would be typically varied. These included the coordination number (CN), inner potential shift (ΔE0), half path length (ΔR),
and Debye Waller factor (σ2). Using the MD-optimized model as a starting point, each Ca-O bond is
assumed to be accompanied by 2.2 Ca-C paths and 4 Ca-O-C paths. This relationship is then properly accounted for using constraints that refer to the single CN variable associated with the first shell Ca-O path. No matter the denticity of each glyme unit, it was assumed that the adjustment of the ΔR and σ2 would scale
constantly across all coordinated glyme molecules. Each ΔR for Ca-C and Ca-O-C was adjusted based on the average angle of the glyme unit when interacting with Ca2+. During initial fits, it was found that a
single ΔE0 was sufficient to represent all the paths; so in the final fits a single global ΔE0 was varied and
previous work.1, 3 The constraints implemented using this parametrization method1 greatly reduced the total
number of varied parameters – essentially a total of 5 parameters were varied, much lower than the number of independent data points, 9.5, afforded by the data. The fitting procedure was carried out in r-space. A full list of fitted parameters can be found in Table S1.
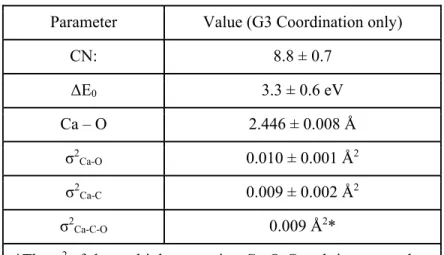
Table S1. List of parameters derived from fitting the 0.5 M CaTFSI2/G3 experimental data. The model is
based on only solvent coordination, which is consistent with the Raman spectroscopy findings discussed in the main text.
Parameter Value (G3 Coordination only)
CN: 8.8 ± 0.7 ΔE0 3.3 ± 0.6 eV Ca – O 2.446 ± 0.008 Å σ2 Ca-O 0.010 ± 0.001 Å2 σ2 Ca-C 0.009 ± 0.002 Å2 σ2 Ca-C-O 0.009 Å2*
*The σ2 of the multiple scattering Ca-O-C path is set equal to
the Ca-C path
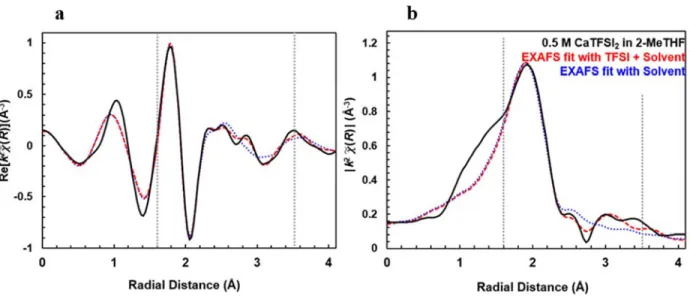
In the case of CaTFSI2 dissolved in 2-MeTHF, a similar fitting procedure was used. Unlike the
CaTFSI2/G3 system, we found that the experimental EXAFS data of CaTFSI2/2-MeTHF cannot be modeled
assuming only solvent coordination and the addition of TFSI coordination is essential (Figure S5). Individual scattering paths for Ca-O, Ca-S, Ca-O-S and Ca-O-S-O were included in the fit. Attempts to include the Ca-C paths associated with the cyclic ether structure were unsuccessful in improving the fit, and these paths along with that of the lone methyl group were not included. Due to the k-window used in the fits (3 - 11 Å-1), we assume that only one Ca-O path is resolved within the experimental data, which is
likely to be a combination of Ca−TFSI ligands and Ca−2-MeTHF ligands. Therefore, in order to identify the fraction of TFSI ligands in the data, we applied a two-component fit where the coordination number of sulfur containing paths was floated as a fraction of the total coordination number of Ca-O paths (defined as 8 based on the typical CN of Ca2+ coordination environments). A full list of parameters for the solvent +
TFSI fit can viewed in Table S2. For the solvent only model, fits with only the Ca-O path and fits with the Ca-O path and the Ca-C path of the THF ring were considered. Statistics of all fit combinations are shown in Table S3. The fits unequivocally demonstrate the presence of TFSI within the first coordination shell of Ca2+ and is therefore consistent with Raman data.
Figure S5. Fourier transform of the χ(k) shown as the real component (a) and the magnitude (b) for 0.5 M CaTFSI2/2-MeTHF. The EXAFS model fits of the experimental data incorporating both solvent and TFSI
coordination (red, dashed trace) and only solvent coordination (blue, dotted trace) are shown between 1.55 – 3.5 Å. Inclusion of TFSI greatly improves the accuracy of the fit between 2.4 and 3.5 Å. Resulting fit parameters are shown in Tables S2 and S3.
Table S2. List of parameters used to fit the 0.5 M CaTFSI2/2-MeTHF experimental data. The model
assumes both anion and solvent coordination.
Parameter Value Total CN 8* Ca-OTFSI CN 4.23 ± 2.46# ΔE0 4.6 ± 0.8 eV Ca – O 2.41 ± 0.01 Å σ2 Ca-O 0.0112 ± 6 x 10⁻⁴ Å2 Ca – S 3.61 ± 0.03 Å σ2 Ca-S 0.02 ± 0.01 Å2
*Total coordination number is fixed to 8
#The fraction of TFSI is calculated using the Ca-S single scattering path
and Ca-O-S multiple scattering path as a fraction of the total Ca-O contribution
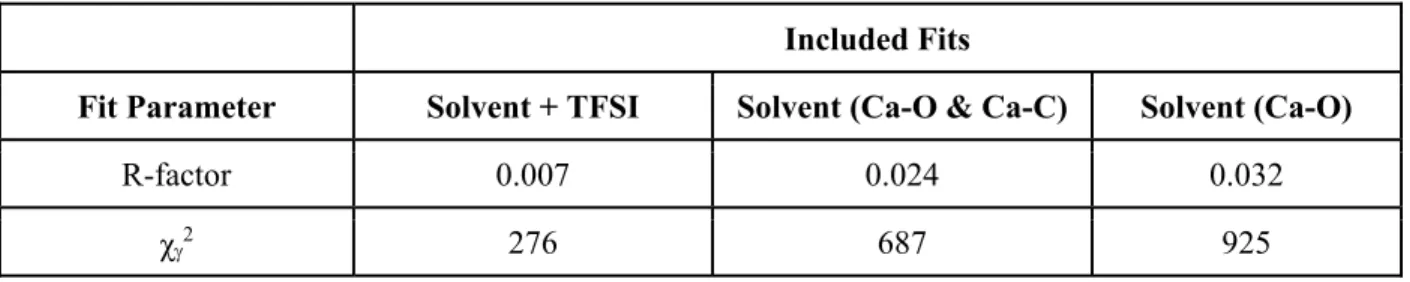
Table S3. A comparison of the statistical fitting accuracy of the 0.5 M CaTFSI2/2-MeTHF EXAFS
(R-factor and reduced chi-squares)4 when using solvent-only models vs. using a solvent + anion model. Included Fits
Fit Parameter Solvent + TFSI Solvent (Ca-O & Ca-C) Solvent (Ca-O)
R-factor 0.007 0.024 0.032
Figure S6. a-b) Raman spectra of the v(C-O)/v(C-C) region of calcium salts dissolved in G1 (a) or G3 (b)
containing ~0.5 M CaX2, where X = TFSI or BHFIP. Yellow highlighted regions indicate the location of
solvent:Ca2+ coordination features. The magnitudes of features suggest that G1 fully solvates Ca2+ in the
CaBHFIP2 solution but not in the CaTFSI2 solution, whereas G3 fully solvates Ca2+ in either solution. The
CaBHFIP2 solution spectra also contain additional features from BHFIP (*); a sharp feature at 801 cm-1 and
weak features at 840 cm-1 and 875 cm-1 that partially alter the apparent solvent line shapes. c) The spectrum
of a 0.4 M CaBHFIP2 solution in THF more clearly demonstrates the 840 cm-1 and 875 cm-1 features. The
large peak at 914 cm-1 is from THF.
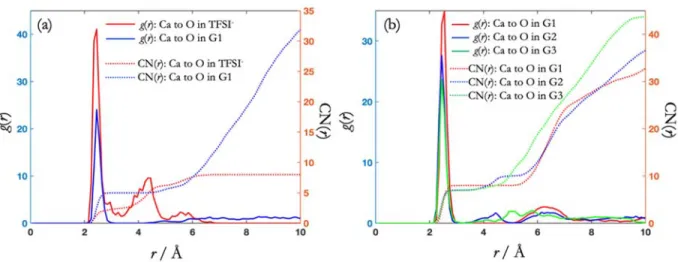
Figure S7. AIMD simulation results obtained using the structures from Figure S4 as initial configurations: (a) Radial distribution function and CN as a function of distance from Ca2+ to the O in TFSI and G1 with
an ion pair initial configuration. (b) Radial distribution function and CN as a function of distance from Ca2+
to the O in glyme with fully solvated Ca2+ initial configurations. The bin size is 0.1 Å.
Additional details concerning Figure S7: After the AIMD run of 25 ps, the initial solvation structures, obtained from CMD simulations, were maintained for all four systems. For the G1 system with an ion pair
configuration, the bond distance from Ca to O in both TFSI and G1 is ~2.45 Å, as shown in Figure S7a. For the fully solvated G1:Ca2+ configuration, a significantly longer Ca – O distance of ~2.55 Å is obtained.
However, the fully solvated Ca2+ structure in G2 and G3 exhibits a Ca – O distance of ~2.45 Å, noticeably
shorter than in G1 as shown in Figure S7b, consistent with the coordination strength trends.
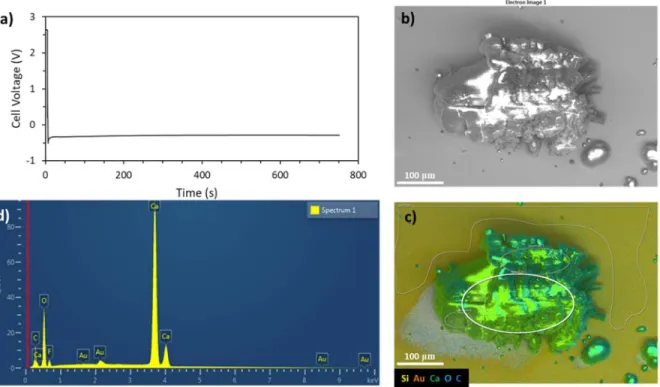
Figure S8. a) Chronopotentiometric response for Ca deposition on Au from 0.2 M CaBHFIP2/G1 in a Au/Ca
cell at 1 mA/cm2 to a capacity of 0.2 mAh/cm2. b) Scanning electron micrograph and c) energy dispersive
X-ray spectroscopy elemental map of the resulting localized Ca deposit. d) EDS spectrum acquired from the elliptical area of interest demonstrating the predominance of Ca with low levels of O, C and F.
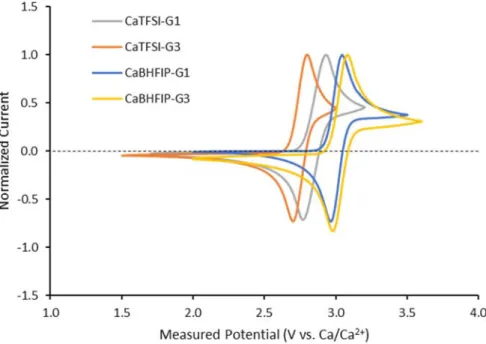
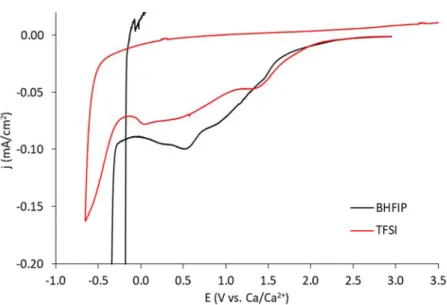
Figure S9. 1st cycle CV comparison (scan rate = 50 mV/s) of CaTFSI
2 and CaBHFIP2 in G1 on Au in a
three-electrode cell with magnified current scale to highlight the background reductive currents. The Ca0
nucleation onset is clearly present at -0.4 V for CaBHFIP2 but not for CaTFSI2, which exhibits only limited,
irreversible reduction processes.
Figure S10. Initial chronopotentiometric cycling behavior of a Ca/Ca symmetric cell comparing the calcium anode cycling ability of three electrolytes as a function of anion and solvent differences. Cycling was performed at 0.2 mA/cm2 with voltage cutoffs of ± 2 V and a capacity of 0.1 mAh/cm2. Even under these
modest conditions the CaBHFIP2/G1 electrolyte was the only one capable of cycling against calcium metal
with low cell polarization (< 0.25 V). The CaTFSI-G1electrolyte supports cathodic current only at high cell polarization (-1.3 to -2V) during the first deposition cycle and for only a short period (< 0.05 h) at which point the current is on longer supported within the ± 2 V limits. The CaBHFIP-G3 electrolyte cannot support the cathodic current at Ca, does sustain a parasitic anodic current at < 2V cell potential for 0.5 h during first stripping cycle, but cannot support further cycling within the ± 2 V limits. As expected for a modest deposition Coulombic efficiency of 75%, parasitic reactions are present even with the CaBHFIP-G1 electrolyte and drive a gradual increase in cell polarization during subsequent cycles (not shown).
References
1. Fulton, J. L.; Heald, S. M.; Badyal, Y. S.; Simonson, J. M., Understanding the Effects of Concentration on the Solvation Structure of Ca2+ in Aqueous Solution. I: The Perspective on Local Structure from EXAFS and XANES. The Journal of Physical Chemistry A 2003, 107 (23), 4688‐4696. 2. Dang, L. X.; Schenter, G. K.; Glezakou, V.‐A.; Fulton, J. L., Molecular Simulation Analysis and X‐ray Absorption Measurement of Ca2+, K+ and Cl‐ Ions in Solution. The Journal of Physical Chemistry B 2006, 110 (47), 23644‐23654. 3. Hahn, N. T.; Self, J.; Seguin, T. J.; Driscoll, D. M.; Rodriguez, M. A.; Balasubramanian, M.; Persson, K. A.; Zavadil, K. R., The critical role of configurational flexibility in facilitating reversible reactive metal deposition from borohydride solutions. Journal of Materials Chemistry A 2020, 8, 7235‐7244.
4. Stern, E. A.; Newville, M.; Ravel, B.; Yacoby, Y.; Haskel, D., The UWXAFS analysis package: philosophy and details. Physica B: Condensed Matter 1995, 208‐209, 117‐120.