C
OUNCI L O FE
CO NO MICA
DVI SERSI
SSUEB
RI EFJ
ULY2015
MAPPING THE DIGITAL DIVIDE
“Today high speed broadband is not a luxury, it’s a necessity.” – President Obama, January 14, 2015
Introduction
The United States has long been the world leader at creating and deploying the Internet. From the original ARPANET through today’s advanced mobile networks, American engineers, companies, and consumers have pioneered advances in networking, applications, and content. Today, nearly every American can access the Internet, and the United States leads the world in the availability of advanced wireless broadband Internet services, such as 4G LTE.
The benefits of this technological revolution, however, have not been evenly distributed. Millions of Americans still do not regularly use a computer, and research shows that there remain substantial disparities in both Internet use and the quality of access. This “digital divide” is concentrated among older, less educated, and less affluent populations, as well as in rural parts of the country that tend to have fewer choices and slower connections.
Closing the digital divide can increase productivity and open ladders of opportunity, and President Obama has made expanding broadband Internet access a priority of his Administration. Since 2009, investments from the federal government have led to the deployment or upgrading of well over 100,000 miles of network infrastructure, while 45 million additional Americans have adopted broadband. The President’s ConnectED initiative aims to connect 99 percent of American students to high-speed broadband in their classrooms by 2018. And in January of this year, the President announced several steps that the Administration would take to ensure fast and reliable broadband is available to more Americans at lower cost, including efforts to promote community-based broadband and a call for State and local governments to roll back short-sighted regulations that restrict competition.
1 PUMAs are geographic areas defined for statistical use. PUMAs are built using census tracts and counties, nest within States, contain roughly 100,000 residents, and cover the entire United States.
This report examines the state of the digital divide using new data from the Census’ 2013 American Community Survey (ACS), which we link with the most recent version of the National Broadband Map (NBM). The large scale of the ACS allows us to examine Internet use at a level of granularity that was not previously possible. Our most important findings illustrate how the digital divide reflects factors that influence the demand for Internet, such as household income, and also the costs of providing it (e.g. population density). Although we consider several potential explanations for the digital divide, our main goal is not to measure the causal impact of any particular factor, but rather to characterize disparities in Internet access and adoption as they exist today.
Overall, the evidence shows that we have made progress, with the largest gains occurring for those groups that started with the least. While this suggests the beginning of convergence toward uniformly high levels of access and adoption, there is still a substantial distance to go, particularly in our poorest neighborhoods and most rural communities, to ensure that all Americans can take advantage of the opportunities created by recent advances in computing and communications technology.
Mapping the Digital Divide
The digital divide can be measured in many different ways, and we begin by considering the relationship between Internet use and household income across different areas of the entire United States. In Figure 1, each dot represents a single Public Use Microdata Area, or PUMA, containing roughly 100,000 residents.1 The graph plots the share of residents in each PUMA who report that they use the Internet at home against the median household income for the same PUMA.2
2 The specific question item we used to calculate the share of households using the Internet was 2013 ACS question 10, “At this house, apartment, or mobile home—do you or any member of this household access theInternet?” Thus,
The figure shows a strong positive association between median income and Internet use. The most affluent PUMAs generally have home Internet adoption rates of 80 to 90 percent, while the PUMAs with the lowest median incomes have adoption rates of around 50 percent. Estimates from a linear regression suggest that doubling a PUMA’s median household income is associated with a 20.2 percentage point increase in the expected rate of Internet adoption.3 In principle, higher income might lead to more Internet use, or vice versa. However, the fact that nearly all Americans have access to basic Internet service strongly suggests that income disparities are the dominant factor in explaining this relationship.
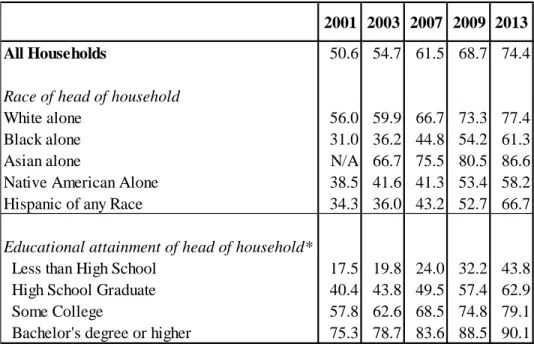
Table 1 uses differences in educational attainment and race, rather than income, to measure the digital divide. In the 2013 ACS, less than half of households headed by someone who did not graduate high school had a home Internet connection, compared to over 90 percent of
we do not include householders that only access the Internet at a public location, such as a school or library, in our measure of Internet adoption. Following the convention that Census uses in its public reports on computer and internet use, group quarters are excluded from these estimates, and a household is only counted as having internet access, if it reports having a subscription.
households headed by a college graduate. Black and Hispanic households are also 16 and 11 percentage points less likely to have an Internet connection than white households, respectively, while Native American households trail white ones by 19 percentage points.
3 If we examine home-computer use rather than home Internet use, the overall pattern is very similar (although average computer adoption rates are higher (most so for the poorest 20% of households), and regression estimates suggest that doubling median household income is associated with a 19.3 percentage point increase in the probability of having a computer at home.
2001 2003 2007 2009 2013
All Households 50.6 54.7 61.5 68.7 74.4
Race of head of household
White alone 56.0 59.9 66.7 73.3 77.4
Black alone 31.0 36.2 44.8 54.2 61.3
Asian alone N/A 66.7 75.5 80.5 86.6
Native American Alone 38.5 41.6 41.3 53.4 58.2
Hispanic of any Race 34.3 36.0 43.2 52.7 66.7
Educational attainment of head of household*
Less than High School 17.5 19.8 24.0 32.2 43.8 High School Graduate 40.4 43.8 49.5 57.4 62.9
Some College 57.8 62.6 68.5 74.8 79.1
Bachelor's degree or higher 75.3 78.7 83.6 88.5 90.1
*Internet access by educational attainment is displayed here for those households where the head of the household is aged 25 or older.
Source: Census, Current Population Survey (2001, 2003, 2007, 2009); Census, American Community Survey (2013); CEA calculations.
However, Table 1 also shows that the digital divide has narrowed considerably since 2001. During that period, the largest increases in Internet adoption occurred for the demographic groups with the lowest initial adoption rate. For example, between 2001 and 2013, home Internet use has increased by 30.3 percentage points among black households, compared to 21.4 percent among white households. Similarly, Internet use grew by 26.3 percentage points among those without a High School education compared to 14.8 percentage points for those with a bachelor’s degree.
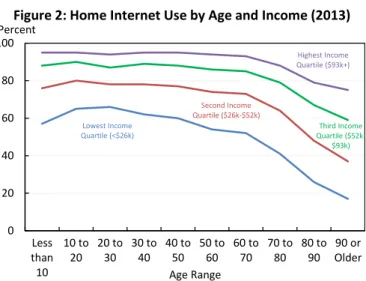
Figure 2 provides a third perspective on the digital divide by graphing the relationship between age and home Internet use in 2013 for persons with different levels of household income.4 While Internet use declines with age, this negative correlation is much stronger for Americans in the lowest quartile of household income. Figure 2 also shows that there is a strong positive relationship between income and Internet use even after accounting for age. For example, a 90 year old in the top quartile of the household income distribution is more likely to have an Internet connection in their home than a person of any age in the bottom quartile of the income distribution.
There are several possible explanations for the patterns in Internet use illustrated above. Perhaps the simplest explanation is that Internet access is costly, and those with more income are more likely to be able to afford it. Indeed, a 2010 FCC survey found that 36 percent of non-adopters cited expense as the primary driver of their decision. However, factors like age and income may also be correlated with the non-monetary costs and benefits that an individual or a household derives from Internet use.5 For example, a recent review of broadband adoption by the Government Accountability Office cited not only affordability but also lack of perceived relevance and lack of necessary computer skills as the primary barriers to broadband Internet adoption. Moreover, if demographically similar households tend to locate close together, correlations between household demographics and Internet adoption may reflect shared variation in costs and prices. The next section of this report sheds some light on this latter possibility by examining the geography of Internet use.
The Geographic Divide
Figure 3 is a map of the United States that illustrates county-level rates of home Internet adoption in 2013.6 The map highlights the digital divide between urban and rural locations that has been documented in previous research. For example, there are large areas of dark green (representing the top quintile of Internet adoption) in the Northeast corridor from Boston to Washington, around Chicago and its suburbs, and along the California coast from San Diego to the San Francisco Bay. The rural South, and those portions of the Southwest that are predominantly home to tribal and Indian lands, all host large numbers of counties that exhibit Internet adoption rates in the lowest quintile for all counties nationwide.
4 Note that a person is counted as using the Internet at home if they live in a household with a subscription, regardless of whether they are the primary user.
5 For example, a 2011 study by the NTIA found that among those who lack home Internet access, 67 percent of the those over age 65 say that they simply lack interest, compared to only 26 percent of those aged 16 to 44 who offer the same explanation.
6 Because the ACS does not provide county-level data, we use the Geographic Correspondence Engine tool developed by the University of Missouri Census Data Center to allocate PUMA-level Internet adoption rates to counties based on each PUMA’s share of a county’s total population. Lowest Income Quartile (<$26k) Second Income Quartile ($26k-$52k) Third Income Quartile ($52k-$93k) Highest Income Quartile ($93k+) 0 20 40 60 80 100 Less than 10 10 to 20 20 to 30 30 to 40 40 to 50 50 to 60 60 to 70 70 to 80 80 to 90 90 or Older Figure 2: Home Internet Use by Age and Income (2013) Percent
Source: American Community Survey, Census
Figure 3: Internet Adoption in United States by County: 2013
While the map in Figure 3 strongly suggests an urban-rural divide, it also reveals several urban-rural areas that have relatively high rates of Internet adoption. Examples include much of the Northern Great Plains and several counties in Montana, Wyoming, North Dakota, Colorado and Utah. This suggests that even though geography is known to have a large impact on costs, other factors can influence Internet adoption even after conditioning on geography.
International comparisons also show relatively high U.S. Internet adoption given geography. In particular, Norway and Switzerland are the only two OECD countries that have both higher rates of Internet use and a larger share of the population living in rural locations.7 Nevertheless, in terms of overall Internet adoption, the United States falls in the middle of the pack of more developed OECD countries, and well behind a group of Nordic countries that have individual Internet adoption rates above 90 percent.
7 This is based on combining data on Internet adoption from the International Telecommunications Union with
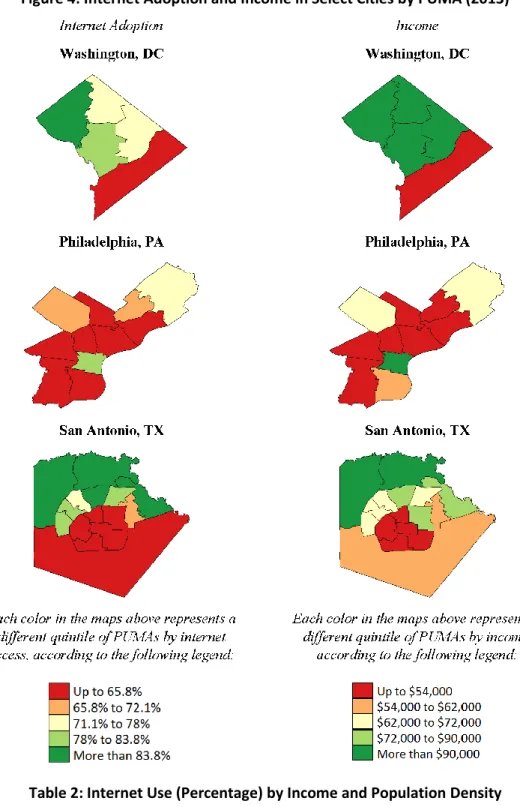
To examine the idea that there may still be an association between income and Internet adoption in the United States, even after conditioning on geography, we can focus on variation within individual cities. Figure 4 presents a series of maps of Washington, DC, Philadelphia, PA and San Antonio, TX. The maps in the left column illustrate the rate of Internet adoption (by quintile) in all of the PUMAs associated with each city, and the maps in the right column show the mean household income (by quintile) for each PUMA.
Overall, the maps illustrate two points: there is substantial within-city variation in Internet adoption, and this variation is strongly correlated with household income. San Antonio provides a good example. Several PUMAs in the central city fall into the lowest quintile of U.S PUMAs for both Internet adoption and household income, while its northern suburbs are in the highest quintile of U.S. PUMAs for both Internet and income. Moreover, because central San Antonio is denser than its northern suburbs, this example suggests that income the share of rural population from the World Development indicators.
Figure 4: Internet Adoption and Income in Select Cities by PUMA (2013)
Table 2: Internet Use (Percentage) by Income and Population Density
<56 56-67 67-85 >85 Total: < 167 61 70 77 82 67 168-551 65 72 79 85 75 552-1,520 62 73 80 86 78 >1,520 62 72 77 86 76 Total: 62 72 78 86 74
S ou rc e : Ce n s u s , Am e ric a n Com m u n ity S u rve y (2013); NT IA/FCC, Na tion a l Broa d b a n d Ma p ; CE A c a lc u la tion s . Pop. Density
(persons/sq. mi.)
(which is closely linked to a host of other socio-economic variables) can be more important than population density (which is really a proxy for the cost of service) for explaining adoption.
Taken together, the national and city-level maps suggest that both income and geography help explain the digital divide. To assess the relative importance of these factors, Table 2 divides all of the country’s PUMAs into 16 categories, based on population density and household income, and examines the rate of home Internet adoption in the 2013 ACS.8
The numbers in the bottom row and the rightmost column of Table 2 show that Internet use increases with both population density and household income. However, there are indications that income explains more of the total variance in Internet adoption. In particular, moving from the bottom to the top quartile in household income is associated with a 24 percentage point change in a PUMA’s average Internet use, compared to a 9 percentage point change as one moves from the bottom to the top quartile in terms of population density. Most of the relationship between population density and Internet use is evident when comparing PUMAs from the lowest quartile of density to the rest of the population. This indicates that the effects of geography are non-linear and are concentrated among the most remote households.9
The Broadband Divide
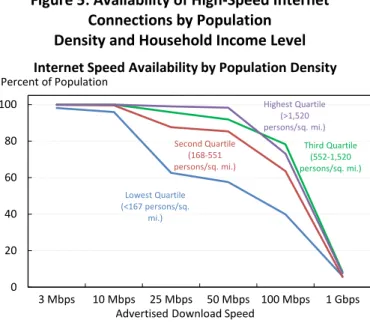
While the digital divide is typically associated with disparities in Internet adoption, it can also be measured in terms of service quality. Data from the National Broadband Map have been used in prior research to highlight disparities in the availability of high-speed Internet connections in different locations. Figure 5 uses data from the NBM to illustrate the share of the U.S. population with access to Internet connections operating at various speeds, based on the maximum advertised download speed in the location where they live.10
8 Because the thresholds used to define these categories are somewhat arbitrary, we used the quartiles of density and income distribution, so there are an equal number of PUMAs in each row and each column of the table (though not necessarily in each cell).
9 Indeed, grouping PUMAs in just four quartiles masks potentially large differences between the most remote
Figure 5: Availability of High-Speed Internet Connections by Population
Density and Household Income Level
Affordability aside, almost all Americans have the option of purchasing an Internet connection with an advertised download speed of 10 Megabits per second (Mbps) – fast enough to stream a high definition movie. Near universal access to 10 Mbps Internet represents a large improvement over past quality of service indicators, and provides a sign that Americans are benefiting from broadband infrastructure investments, both public and private.
households and those closer to the 25th percentile of the density distribution.
10 To link the NBM and ACS data sets, we used the Geographic Correspondence Engine tool developed by the University of Missouri Census data center.
Lowest Quartile (<167 persons/sq. mi.) Second Quartile (168-551 persons/sq. mi.) Third Quartile (552-1,520 persons/sq. mi.)
Source: Census, American Community Survey; NTIA/FCC, National Broadband Map; CEA Calculations Highest Quartile (>1,520 persons/sq. mi.) 0 20 40 60 80 100 3 Mbps 10 Mbps 25 Mbps 50 Mbps 100 Mbps 1 Gbps
Internet Speed Availability by Population Density Percent of Population
Table 3: Population Share Using Fiber Optic Connection by Household Income and Population Density (Availability in Parentheses)
However, the rapid growth of streaming video and the use of many devices within a household means that 10 Mbps is in many cases no longer sufficient. This is why the FCC recently updated its definition of a “broadband” connection to require download speeds of 25 Mbps or greater. At that level, Figure 5 shows that there is still a substantial gap between urban and rural communities, as well as between the wealthiest PUMAs and the least affluent. In 2013, only 63 percent of persons in the lowest population density quartile PUMAs could get 25 to 50 Mbps connections, and just 40 percent could access the Internet at 100 Mbps. There is also a broadband availability gap of roughly 20 percentage points between the wealthiest and least wealthy communities for advertised download speeds of 25 Mbps up to 100 Mbps. Finally, Figure 5 shows that very few Americans have access to the highest download speeds of 1 Gigabit per second (Gbps) or more. However, that end of the market is evolving rapidly, and future expansions of the network may replicate the disparities we currently observe at lower speeds. The only technology presently used to deliver residential Internet download speeds of 1 Gbps is a fiber-optic cable. Some Internet service providers are, however, starting to deploy gigabit-per-second service using cable modems. Table 3 illustrates large disparities in access to and use of consumer fiber. In the least dense and lowest income U.S. communities, just 10 percent of the population has access to a fiber connection, and only 5 percent actually use one. In the wealthiest urban locations, 44 percent of the population have access to
11 Note that the total count of wireless providers includes fixed wireless providers, which consumers typically use in a manner that is more similar to wireline internet. As a
fiber and 21 percent actually purchase fiber access to the Internet.
Table 2 showed how income explains more of the variance in Internet adoption than population density. Here, the relationship is more subtle. In particular, Table 3 shows that moving from the lowest to the highest quartile of population density has a larger effect on the availability of fiber access than moving from the lowest to the highest income quartile. However, these same changes are both associated with a 10 percentage point increase in the use of a fiber optic connection. The fact that population density is more important for explaining access to fiber may reflect differences between the cost of bringing a new fiber optic cable to a consumer and upgrading an existing cable or telephone network. Similarly, differences in pricing (which we do not observe) may explain why only about half of those with access to fiber actually purchase that type of service.
The Competitive Divide
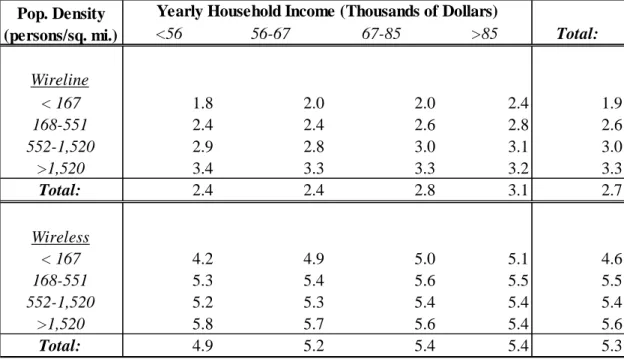
A final way to measure the digital divide emphasizes disparities in competition. Prior research shows that the number of wireline service providers declines rapidly at speeds greater than 25 Mbps. Table 4 shows the average number of wireline and wireless Internet service providers for all U.S. PUMAs by income and population density.11 There is clearly more competition in wireless than wireline access across all markets. Moreover, both wireline and wireless competition increase with population density, but are not strongly influenced by income levels.
result, the number of wireless providers in Table 4 is overestimated from a conceptual perspective, meaning that the number of wireline providers is undercounted.
<56 56-67 67-85 >85 Total: < 167 5 (10) 7 (17) 7 (18) 9 (14) 6 (14) 168-551 6 (14) 6 (15) 8 (18) 10 (19) 8 (16) 552-1,520 8 (24) 10 (25) 13 (32) 16 (34) 13 (30) >1,520 9 (31) 13 (35) 15 (37) 21 (44) 16 (38) Total: 7 (18) 8 (21) 11 (26) 17 (35) 11 (25)
S ou rc e : Ce n s u s , Am e ric a n Com m u n ity S u rve y (2013); NT IA/FCC, Na tion a l Broa d b a n d Ma p ; CE A c a lc u la tion s . Pop. Density
(persons/sq. mi.)
Table 4: Average Number of Wireline and Wireless Service Providers by PUMA
Figure 6 examines the relationship between wireline competition and home Internet adoption. Each orange dot in the Figure represents a PUMA whose population density is below the median for all U.S. PUMAs, and each blue dot a PUMA whose population density is above the median. The separation between the orange and blue dots illustrates the strong positive relationship between population density and wireline competition. However, Figure 6 also shows that there is a positive correlation between the number of wireline competitors and the rate of Internet adoption in less dense PUMAs. For PUMAs with higher levels of population density, there does not appear to be any relationship between wireline competition and Internet adoption. A linear regression analysis confirms that in low-density (orange) PUMAs, each additional wireline competitor is associated with a 6.3 percentage point increase in Internet use, while there is no statistically significant relationship between wireline competition and Internet use in high-density (blue) PUMAs.12
12 We performed the same analysis using the number of wireless rather than wireline service providers, and found a smaller (but still statistically significant) effect in less
Although Figure 6 highlights a statistical link between wireline competition and Internet adoption in rural markets, it is important to recognize that causality in this relationship could run in both directions. In particular, competition can stimulate adoption by leading to lower prices, higher quality, and more choice. At the same time, low levels of demand (or expected adoption)—
dense rural markets, and no statistically significant impact in high density urban markets.
<56 56-67 67-85 >85 Total: Wireline < 167 1.8 2.0 2.0 2.4 1.9 168-551 2.4 2.4 2.6 2.8 2.6 552-1,520 2.9 2.8 3.0 3.1 3.0 >1,520 3.4 3.3 3.3 3.2 3.3 Total: 2.4 2.4 2.8 3.1 2.7 Wireless < 167 4.2 4.9 5.0 5.1 4.6 168-551 5.3 5.4 5.6 5.5 5.5 552-1,520 5.2 5.3 5.4 5.4 5.4 >1,520 5.8 5.7 5.6 5.4 5.6 Total: 4.9 5.2 5.4 5.4 5.3
S ou rc e : Ce n s u s , Am e ric a n Com m u n ity S u rve y (2013); NT IA/FCC, Na tion a l Broa d b a n d Ma p ; CE A c a lc u la tion s . Pop. Density
(persons/sq. mi.)
Yearly Household Income (Thousands of Dollars)
20 40 60 80 100 0 1 2 3 4 5 6 7
Percent Using Internet
Average Number of Wireline Choices
Source: Census, American Community Survey; NTIA/FCC, Broadband Map; CEA Calculations.
Rural
Urban Figure 6: Number of Provider Choices and Internet Use
combined with high costs of service provision—may lead to a dearth of competition.
Conclusion
The Internet can have a dramatic impact on our productivity and quality of life. Internet users have vast amounts of information literally at their fingertips, and an Internet connection allows individuals to communicate, collaborate, and transact on a global scale in ways that were unimaginable only a few years ago. One study by a former Chairman of CEA uses data on the amount of time Internet users spend online to estimate that Internet access produces thousands of dollars of consumer surplus per user each year.
Closing the gap—between those who experience these social and economic benefits from Internet use, and those who do not—will require further efforts to reduce barriers in affordability, relevance, and computer literacy. The President’s broadband agenda tackles each of these challenges in turn, including infrastructure investments and robust competition policy to ensure widespread access to affordable high-quality Internet; spectrum policy to ensure that the dramatic growth in wireless broadband continues; and investments in education and training, especially for children, to remove computer literacy barriers that impede universal access. The digital divide is likely both a cause and a consequence of other demographic disparities, and sorting out the precise impact of closing the divide is more difficult than characterizing the current disparities, as we have done here. Policies that aim to close the divide are pursued in recognition of the fact that the opportunities afforded by Internet access should be accessible to every American, much like other universally available utilities such as water and electricity. Expanding broadband access is an important part of a larger middle-class economic policy agenda, both to support economic growth and to extend access to opportunity to more Americans.
References
Beede, David N. 2014. “Competition Among U.S. Broadband Services Providers.” OCE Issue Brief #01-14.
Beede, David, and Anne Neville. 2013. “Broadband Availability in the Workplace.” NTIA Broadband Brief No. 3.
Caumont, Andrea. 2013. “Who’s not online? 5 factors tied to the digital divide.” Pew Research Center’s Fact Tank.
Darling-Hammond, Linda, Molly B. Zielzinkski, and Shelley Goldman. 2014. “Using Technology to Support At-Risk Students’ Learning.” Stanford Center for Opportunity Policy in Education and the Alliance for Excellent Education.
DiMaggio, Paul, and Eszter Hargittai. 2001. “From the ‘Digital Divide’ to ‘Digital Inequality’: Studying Internet Use as Penetration Increases.” Princeton University Center for Arts and Cultural Policy Studies Working Paper Series, No. 15.
Ericsson, Arthur D. Little, and Chalmers University of Technology. 2013. “Socioeconomic Effects of Broadband Speed.”
Fairlie, Robert W. 2005. “The effects of home computers on school enrollment.” Economics of Education Review, 24(5): 533-547.
Federal Communications Commission. 2015. “FCC Finds U.S. Broadband Deployment Not Keeping Pace.”
Federal Communications Commission. 2014. “FCC to Releases Order to Increase Connect America Rural Broadband Speeds.”
File, Thom and Camille Ryan. 2014. “Computer and Internet Use in the United States: 2013.” American Community Survey Reports, ACS-28. U.S. Census Bureau. Goolsbee, Austan, and Peter J. Klenow. 2006. “Valuing Consumer Products by the Time Spent Using Them: An Application to the Internet.” NBER Working Paper No. 11995.
Greenstein, Shane. 2015. How the Internet Became Commercial: Innovation, Privatization, and the Birth of a New Network. Princeton University Press.
Horrigan, John B. 2010. “Broadband Adoption and Use in America.” OBI Working Paper Series No. 1.
Missouri Census Data Center, MABLE/Geocorr 12, Version 1.2: Geographic Correspondence Engine. Web application accessed May 2015 at: http://mcdc.missouri.edu/websas/geocorr12.html Mowery, David C., and Timothy Simcoe. 2002. “Is the Internet a US invention?—an economic and technological history of computer networking.” Research Policy, 31(8-9): 1369-1387.
National Telecommunications and Information Administration and Economics and Statistics Administration, Department of Commerce. 2013. “Exploring the Digital Nation. America’s Emerging Online Experience.”
National Telecommunications and Information Administration and Federal Communications Commission. 2011. “Broadband Availability in Urban vs. Rural Areas.” Broadband Statistics Report.
National Telecommunications and Information Administration and Federal Communications Commission. 2013. National Broadband Map Analyze Table.
Office of Science and Technology Policy & The National Economic Council. 2013. “Four Years of Broadband Growth.”
US Census Bureau. 2013. American Community Survey 1-year Public Use Microdata Sample (PUMS) files.
United States Government Accountability Office. 2015. “Broadband. Intended Outcomes and Effectiveness of Efforts to Address Adoption Barriers are Unclear.” The White House, Office of the Press Secretary. 2015. “Remarks by the President on Promoting Community Broadband.”
Zickuhr, Kathryn. 2013. “Who’s not online and why.” Pew Research Center’s Internet & American Life Project.