Invoicing and Workflow
Integrating Process Automation to Enhance Operational Performance
May 2011
Scott Pezza
© 2011 Aberdeen Group. Telephone: 617 854 5200
Executive Summary
Research Benchmark Aberdeen’s Research Benchmarks provide an in-depth and comprehensive look into process, procedure, methodologies, and
technologies with best practice identification and actionable recommendations
Paper invoices and manual processing continue to hamper accounts payable operations, keeping suppliers in the dark and failing to give finance the visibility it needs to actively manage the organizations’ cash positions. This study, conducted during March and April of 2011, profiles 130 enterprises at varying stages of AP maturity to identify what differentiates those achieving the greatest results from their less successful peers. The end goal, and the target of their automation efforts, is to drive savings through discount capture, penalty avoidance, and lower labor costs – all while improving the speed with which they can access payables-related information.
Best-in-Class Performance
Aberdeen used the following three key performance criteria to distinguish Best-in-Class companies:
• 3.8 days to process a single invoice
• $3.09 average cost to process a single invoice
• 4.1% year-over-year increase in early payment discount capture
Competitive Maturity Assessment
Survey results show that the firms enjoying Best-in-Class performance shared several common characteristics. When compared to Laggards, for example, they are:
• 2.4-times as likely to have invoices archived in a central, searchable location
• 1.9-times as likely to have automated matching of invoices to purchase orders
• 4.1-times as likely to have dashboards summarizing current AP status and performance
Required Actions
"Ours is an archaic manual system: PO's are generated on spreadsheets, [we use] hand-written receiving reports, and do a paper three-way match before keying invoices into an AP module on a 'patchwork quilt' information system. What is missing? Everything."
~ Finance Manager, North American Food & Beverage Company In addition to the specific recommendations in Chapter Three of this
report, to achieve Best-in-Class performance, companies must:
• Quantify the potential impact of automating AP processes to make the business case for investment
• Focus on strategies for maximizing supplier collaboration through incentives, facilitating technologies, and effective on-boarding • Look beyond accounts payable to maximize benefits by integrating
with procurement, finance, and other back-end systems
This document is the result of primary research performed by Aberdeen Group. Aberdeen Group's methodologies provide for objective fact-based research and represent the best analysis available at the time of publication. Unless otherwise noted, the entire contents of this publication are copyrighted by Aberdeen Group, Inc.
© 2011 Aberdeen Group. Telephone: 617 854 5200
Table of Contents
Executive Summary...2
Best-in-Class Performance...2
Competitive Maturity Assessment...2
Required Actions...2
Chapter One: Benchmarking the Best-in-Class...4
Business Context ...4
The Maturity Class Framework...5
The Best-in-Class PACE Model ...5
Best-in-Class Strategies...6
Chapter Two: Benchmarking Requirements for Success...10
Competitive Assessment...11
Capabilities and Enablers...12
Chapter Three: Required Actions ...17
Laggard Steps to Success...17
Industry Average Steps to Success ...17
Best-in-Class Steps to Success...18
Appendix A: Research Methodology...20
Appendix B: Related Aberdeen Research...22
Figures
Figure 1: Top Pressures Driving AP Improvement Focus ...4Figure 2: Top Strategies for AP Improvement ...7
Figure 3: Comparative Maturity of AP Improvement Initiatives ...13
Figure 4: Technology Choices of the Best-in-Class ...14
Figure 5: Current and Future Network Adoption...16
Tables
Table 1: Top Performers Earn Best-in-Class Status...5Table 2: The Best-in-Class PACE Framework ...6
Table 3: More Details of Best-in-Class Performance ...7
Table 4: AP Improvement - Benefits and Difficulty...8
Table 5: The Competitive Framework...11
Table 6: The PACE Framework Key ...21
Table 7: The Competitive Framework Key ...21
Table 8: The Relationship Between PACE and the Competitive Framework ...21
Chapter One:
Benchmarking the Best-in-Class
Business Context
Fast Facts
√ 35% of AP staffers' time is spent fielding inquiries (internal and suppliers)
√ 77% of incoming invoices are paper-based
Accounts Payable (AP) is still a paper-heavy business function. For companies responding to Aberdeen's latest AP survey, nearly 77% of all incoming invoices were still paper-based. This is an area still maturing in terms of process automation and technology adoption, with great (and as of yet untapped) potential for driving savings to the bottom lines of every organization. This study provides an overview of the current state of accounts payable automation, with a focus on best practices for handling the receipt and approval of incoming invoices.
As a starting point, it is helpful to answer one foundational question: why is AP automation on organizations' radar screens to begin with? For this year's respondents, the story looks quite familiar to what we have seen in the past: cost concerns and a lack of visibility continue to drive organizational interest in AP automation. Even for the Best-in-Class that have achieved levels of performance far beyond their peers, the top-down pressure to continually reduce costs has not abated. In the AP arena, though, this challenge is not insurmountable: automation can provide additional data which, when analyzed, can help to create a virtuous cycle of improvement as processes are refined, new data is collected, and the steps are repeated.
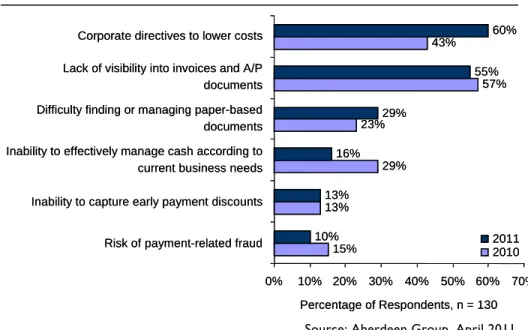
Figure 1: Top Pressures Driving AP Improvement Focus
15% 13% 29% 23% 57% 43% 10% 13% 16% 29% 55% 60% 0% 10% 20% 30% 40% 50% 60% 70% Risk of payment-related fraud
Inability to capture early payment discounts Inability to effectively manage cash according to current business needs Difficulty finding or managing paper-based documents Lack of visibility into invoices and A/P documents Corporate directives to lower costs
Percentage of Respondents, n = 130 2011 2010 15% 13% 29% 23% 57% 43% 10% 13% 16% 29% 55% 60% 0% 10% 20% 30% 40% 50% 60% 70% Risk of payment-related fraud
Inability to capture early payment discounts Inability to effectively manage cash according to current business needs Difficulty finding or managing paper-based documents Lack of visibility into invoices and A/P documents Corporate directives to lower costs
Percentage of Respondents, n = 130 2011 2010
Source: Aberdeen Group, April 2011 When examining the pressures illustrated in Figure 1 the second and third items are truly interrelated. A lack of visibility into invoice and AP
documents captures the day-to-day struggles enterprises face in providing an accurate accounting (to both internal and external parties) of invoice
© 2011 Aberdeen Group. Telephone: 617 854 5200 processing and payment status. The difficulty finding and managing
paper-based documents captures the challenges organizations face all along the lifecycle of an invoice - from initial receipt, through approval, and finally storage and archival. The necessity of ready access to invoices and supporting documentation does not end when a check is issued [or an Automated Clearing House (ACH) transaction is executed, in a less costly example]. Access to, and analysis of historical information can be critical to improvement efforts, future negotiations by counterparts in procurement, and in support of potential internally- and externally-conducted audits. Information is the key, and when it is bound to paper documents, the potential for actual or constructive loss is a notable pressure in itself.
The Maturity Class Framework
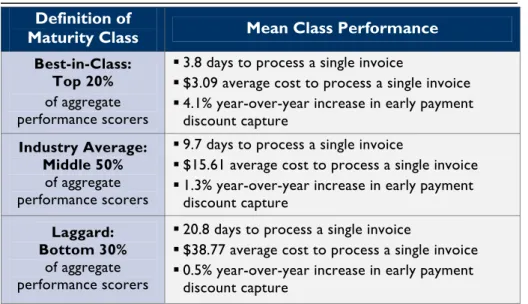
Aberdeen used three key performance criteria to distinguish the Best-in-Class from Industry Average and Laggard organizations. This definition captures not only current performance for invoice processing time and cost, but also year-over-year improvements in an area that represents one of the main benefits of efficient operations: the ability to capture early payment discounts.
Table 1: Top Performers Earn Best-in-Class Status Definition of
Maturity Class Mean Class Performance
Best-in-Class: Top 20%
of aggregate performance scorers
3.8 days to process a single invoice
$3.09 average cost to process a single invoice 4.1% year-over-year increase in early payment
discount capture
Industry Average: Middle 50%
of aggregate performance scorers
9.7 days to process a single invoice
$15.61 average cost to process a single invoice 1.3% year-over-year increase in early payment
discount capture
Laggard: Bottom 30%
of aggregate performance scorers
20.8 days to process a single invoice
$38.77 average cost to process a single invoice 0.5% year-over-year increase in early payment
discount capture
Source: Aberdeen Group, April 2011
The Best-in-Class PACE Model
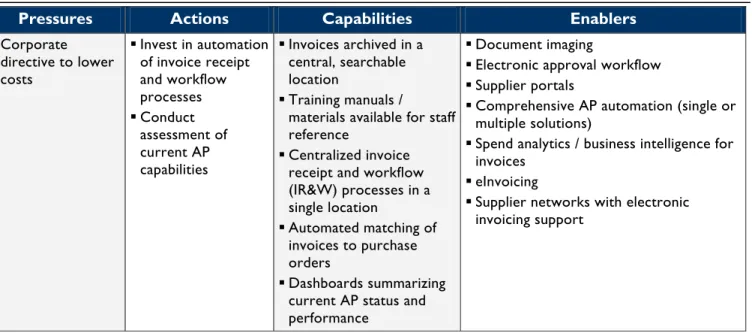
Maximizing the value derived from accounts payable automation requires a combination of strategic actions, organizational capabilities, and enabling technologies that can be illustrated by examining the elements that define the Best-in-Class. Table 2 reflects the main pressures, strategies, and current capabilities that set the highest-performing enterprises apart from their peers.
Table 2: The Best-in-Class PACE Framework
Pressures Actions Capabilities Enablers
Corporate directive to lower costs Invest in automation of invoice receipt and workflow processes Conduct assessment of current AP capabilities Invoices archived in a central, searchable location Training manuals /
materials available for staff reference
Centralized invoice receipt and workflow (IR&W) processes in a single location Automated matching of invoices to purchase orders Dashboards summarizing current AP status and performance
Document imaging
Electronic approval workflow Supplier portals
Comprehensive AP automation (single or multiple solutions)
Spend analytics / business intelligence for invoices
eInvoicing
Supplier networks with electronic invoicing support
Source: Aberdeen Group, April 2011
Best-in-Class Strategies
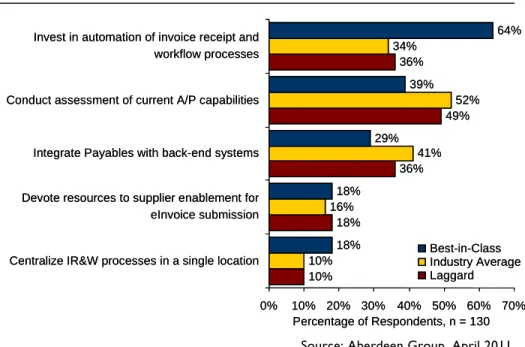
What is immediately apparent when examining the strategies of responding companies is the role that maturity plays in the choices they make. For lower-performing organizations, there is a large focus on taking stock of their current state: analyzing current practices and technologies to begin planning for future improvement. The Best-in-Class, however, have already laid the groundwork, and are in a position to devote resources to the automation of AP processes. In this regard, strategy is informed by current AP maturity, rather than being dictated by a single "correct" approach. The intention here is to begin with careful crafting of the underlying processes first, before automating them. Ultimately, the goal is to do the right things better, and not simply the same (potentially bad) things more quickly.
© 2011 Aberdeen Group. Telephone: 617 854 5200 Figure 2: Top Strategies for AP Improvement
10% 18% 36% 49% 36% 10% 16% 41% 52% 34% 18% 18% 29% 39% 64% 0% 10% 20% 30% 40% 50% 60% 70% Centralize IR&W processes in a single location
Devote resources to supplier enablement for eInvoice submission Integrate Payables with back-end systems Conduct assessment of current A/P capabilities Invest in automation of invoice receipt and workflow processes Percentage of Respondents, n = 130 Best-in-Class Industry Average Laggard 10% 18% 36% 49% 36% 10% 16% 41% 52% 34% 18% 18% 29% 39% 64% 0% 10% 20% 30% 40% 50% 60% 70% Centralize IR&W processes in a single location
Devote resources to supplier enablement for eInvoice submission Integrate Payables with back-end systems Conduct assessment of current A/P capabilities Invest in automation of invoice receipt and workflow processes
Percentage of Respondents, n = 130 Best-in-Class Industry Average Laggard
Source: Aberdeen Group, April 2011 What differentiates Best-in-Class enterprises from the others is not limited to performance in the specific metrics mentioned previously. As will be profiled in Chapter Two, there are some key qualitative areas
(organizational, process, and technology-related) where there are notable differences between maturity classes. As a precursor to that discussion, Table 3 sets out some quantitative attributes that set the Best-in-Class apart from Industry Average and Laggard organizations. Importantly, they receive a higher percentage of invoices electronically and capture a greater volume of early payment discounts while minimizing two sources of time-consuming manual intervention: inaccuracies and exceptions.
Table 3: More Details of Best-in-Class Performance
Metric Best-in-Class Industry Average Laggard
Electronic Invoices (percent of total) 35.8% 23.8% 10.9%
Early payment discount capture rate 31% 24% 15%
Error Rate (incoming invoices with inaccuracies) 6% 11% 12% Exception Rate (invoices flagged for management review) 12% 17% 30%
Source: Aberdeen Group, April 2011 Choosing a starting point is an exercise in identifying which areas offer the
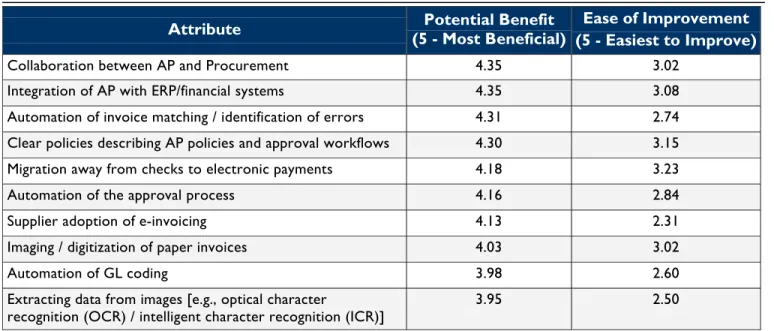
greatest potential for improvement, and balancing them against the difficulty and cost of achieving that potential. Table 4 provides a summary of how current respondents judged various aspects of AP, in precisely these terms. Both benefits and difficulty were asked on a five-point scale, where a low score coincides with low perceived benefit, or low ease of improvement (i.e., high degree of difficulty) and a high score denotes great potential
benefit or great ease of improvement. The ideal case, then, would be a high score in both categories.
Table 4: AP Improvement - Benefits and Difficulty
Attribute (5 - Most Beneficial) Potential Benefit Ease of Improvement (5 - Easiest to Improve)
Collaboration between AP and Procurement 4.35 3.02
Integration of AP with ERP/financial systems 4.35 3.08 Automation of invoice matching / identification of errors 4.31 2.74 Clear policies describing AP policies and approval workflows 4.30 3.15 Migration away from checks to electronic payments 4.18 3.23
Automation of the approval process 4.16 2.84
Supplier adoption of e-invoicing 4.13 2.31
Imaging / digitization of paper invoices 4.03 3.02
Automation of GL coding 3.98 2.60
Extracting data from images [e.g., optical character
recognition (OCR) / intelligent character recognition (ICR)] 3.95 2.50
Source: Aberdeen Group, April 2011 "We have started to demand that all suppliers should send their invoices through a 'message broker' to enable us to get all invoices electronically. We leave it to our suppliers to decide the level of integration (automation) with the message broker. In the future we might integrate some high transaction volume suppliers directly with our ERP-system."
~ AP Staffer, European Paper Products Manufacturer It is interesting to note that the two attributes tied at the top of the list are
both focused on bringing related entities together: functional groups for one, and technological systems for the other. This helps to emphasize that when it comes to AP, no function (or solution) lives in a vacuum. The prices and payment terms negotiated by procurement are ultimately enforced only to the extent that AP can identify where invoices deviate from what was agreed upon. The focus is on providing access to information across areas to ensure that the goals of the greater enterprise are met. The same sentiment is shown in the concern for integration of business systems: without integration, manual processes are introduced to bridge the gap, and the quality of (and visibility into) data is compromised.
© 2011 Aberdeen Group. Telephone: 617 854 5200 Strategies for Supplier Enablement
With the discussion of AP automation intimately tied to the form
invoices take when sent from suppliers, getting their buy-in can be key to success. This year's respondents offered their views on how to approach this effort, relating varying strategies that can be summarized into a few main categories (which may be pursued individually or in combination):
• Mandated supplier adoption of electronic invoices. For buyers with significant negotiating leverage, the potential loss of business can be a persuasive influence on suppliers. This is a more confrontational, and less collaborative, approach to the issue and care should be taken to monitor pricing and
product/service quality to ensure that gains in one area are not offset elsewhere.
• Inclusion of suppliers in the design and scoping of the project. Especially for strategic / high-volume suppliers, this approach gives them a say in how the effort is designed and rolled-out. On its own, it would still require a sell-side business justification, but does not threaten supplier relationships to the same degree as a unilateral mandate.
• Exchange of beneficial terms for cooperation. This strategy appeals directly to the suppliers' financial concerns. For one respondent, this has led to negotiated payment terms where traditional invoices are set at Net 45, but a move to electronic will gain suppliers a change to Net 30.
• Outsourcing of enablement efforts. For some respondents, it is better to contract for enablement services rather than attempt to handle things in-house. This approach engages a solution provider or third-party services firm to tackle supplier prioritization, outreach, education, and on-boarding.
• Shouldering of the burden by AP. The final strategy is premised on making the transition as easy as possible for suppliers, by having the buyer's organization do all the legwork (and potentially absorb the costs). As with any solution
implementation, if the expected benefits outweigh the incurred costs, the additional burden will nonetheless prove ultimately beneficial.
In the next chapter, we will see what choices the Best-in-Class have made that help to support their performance edge over their peers.
Chapter Two:
Benchmarking Requirements for Success
For enterprises focusing on AP improvement, there are numerous options to consider, including which stages to address, which deployment model to choose, or even whether to turn to business process outsourcing rather than in-house implementation. The foundation for these decisions, and the focus of this study, is an understanding of the benefits, costs, and
organizational requirements necessary to find the best fit for each individual enterprise.
Finding the Right Formula: AP Improvement in Chemicals For one North America-based chemical products company, accounts payable has taken on a more strategic role in the enterprise. With a global footprint of nearly 20,000 employees in over 30 countries, the scope and complexity of its AP operations is impressive. As with many of its peers, cost is the dominant pressure that has been driving their improvement efforts. For the company's AP Director, the personal motivation is well-aligned with that of the corporation; "A drive to automate transactions with the goal of increasing productivity."
To continue their improvement efforts, which they have been pursuing as part of an initiative for over five years, the focus is on automation and supplier enablement. They are currently receiving electronic invoices over a procurement network (for approximately 25% of the overall volume), and supplementing those efforts with document imaging of paper invoices and a portal for the remainder of suppliers. "We're offering a choice in terms of Purchase Order (PO) receipt and invoice channels, with hubs, EDI, portals, etc.," says the director. "The portal is the most difficult, though, due to log-on and manual data entry." Already boasting performance on-par with the Best-in-Class, their current efforts have netted the company year-over-year improvements in both processing time and cost (in the 5% to 10% range), on top of a slight increase in the percentage of early payment discounts captured. But they are not planning to rest on their laurels. Their plan is to replace the remainder of currently-manual processes with automation, by introducing data extraction from invoice images, implementing an electronic
workflow tool to guide the approval process, and adding dash-boarding capabilities to track AP performance in real-time.
Although internal support and supplier enablement have posed the biggest challenges to date, the company's track record of success in AP initiatives and multi-faceted approach to supplier interaction should position them well for continued improvement in the years to come.
Fast Facts
√ Best-in-Class respondents are 72% more likely than all others to have centralized IR&W in a single location
√ Best-in-Class enterprises process invoices 81% faster
© 2011 Aberdeen Group. Telephone: 617 854 5200
Competitive Assessment
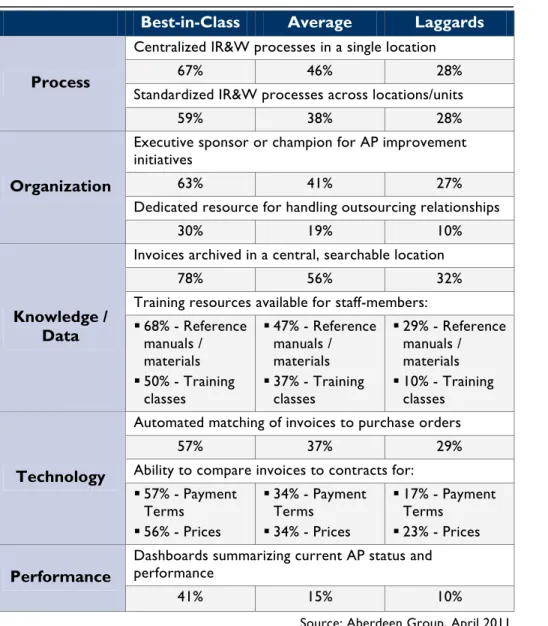
Aberdeen Group analyzed the aggregated metrics of surveyed companies to determine whether their performance ranked as Best-in-Class, Industry Average, or Laggard. In addition to having common performance levels, each class also shared characteristics in five key categories: (1) process (the approaches they take to execute daily operations); (2) organization (corporate focus and collaboration among stakeholders); (3) knowledge management (contextualizing data and exposing it to key stakeholders); (4) technology (the selection of the appropriate tools and the effective deployment of those tools); and (5) performance management (the ability of the organization to measure its results to improve its business). These characteristics (identified in Table 5) serve as a guideline for best practices, and correlate directly with Best-in-Class performance across the key metrics.
Table 5: The Competitive Framework
Best-in-Class Average Laggards Centralized IR&W processes in a single location
67% 46% 28%
Standardized IR&W processes across locations/units Process
59% 38% 28%
Executive sponsor or champion for AP improvement initiatives
63% 41% 27%
Dedicated resource for handling outsourcing relationships Organization
30% 19% 10%
Invoices archived in a central, searchable location
78% 56% 32%
Training resources available for staff-members: Knowledge /
Data 68% - Reference manuals / materials 50% - Training classes 47% - Reference manuals / materials 37% - Training classes 29% - Reference manuals / materials 10% - Training classes Automated matching of invoices to purchase orders
57% 37% 29%
Ability to compare invoices to contracts for: Technology 57% - Payment Terms 56% - Prices 34% - Payment Terms 34% - Prices 17% - Payment Terms 23% - Prices Dashboards summarizing current AP status and performance
Performance
41% 15% 10%
Capabilities and Enablers
"For AP we prefer in-house installations for ownership and continuance of operations. For travel and expense
reimbursement modules, we are leaning more towards software-as-a-service applications. "
~ AP Manager, North American Healthcare Services Company Based on the findings of the Competitive Framework and interviews with
end users, Aberdeen’s analysis of the Best-in-Class demonstrates that there are several characteristics of these high-performing enterprises that serve to differentiate them from their lower-performing peers.
Process
Location, location, location. Whether your concern is real estate value or AP performance, the message is the same: location can have a great impact on results. In the AP sphere, the centralization of IR&W processes in a single location is a defining characteristic of the Best-in-Class, which report this capability nearly 50% more often than the Industry Average and 2.4-times as often as Laggard respondents. Here, enterprises are streamlining operations by directing all incoming invoices to a centralized mailbox, scanning and indexing documents, and using a single team for reconciliation and discrepancy resolution. At present, most respondents that have centralized have done so within a corporate AP department, though a growing minority has begun shifting operations to shared service centers which support consolidation of additional business functions.
Organization
The conceit that executive sponsorship is a necessity for successful improvement efforts is as cliché as it is accurate. Solution implementations and process redesign efforts consume resources, and resource allocation is the province of executive management. Executives can also set the tone for the organization's overall receptivity to prospective change. For this year's respondents, a lack of internal support is far-and-away the most frequently cited barrier to improvement efforts (chosen at a rate nearly twice that of the second-most often cited challenge, the difficulty integrating AP with other enterprise systems). Best-in-Class firms are those that have been more successful in this area, noting executive sponsorship of improvement initiatives 54% more often than the Industry Average, and nearly 2.5-times as often as Laggard companies.
Another area that helps to differentiate the Best-in-Class from their peers is deceptively simple: they have been more active in pursuing improvement initiatives. As illustrated in Figure 3, 85% of the Best-in-Class have a current initiative, as compared to 64% of other respondents. Why is this important? As just one example, respondents who have just begun (those with an initiative in place less than one year) report invoice processing times 4-days (27%) faster than those without an initiative in place. As a group, those who have been active for more than five years have shaved an additional two days off the average processing time, outpacing all other length-based groups. The key takeaway here is that the question to ask is not whether to start an improvement initiative - but where to begin. Chapter Three will provide some targeted recommendations to that end.
© 2011 Aberdeen Group. Telephone: 617 854 5200 Figure 3: Comparative Maturity of AP Improvement Initiatives
Best-in-Class 29% 11% 18% 29% 15%
More than five years Between three and five years Between one and two years Less than one year No Initiative All Others 16% 15% 18% 16% 36% n = 130 Best-in-Class 29% 11% 18% 29% 15%
More than five years Between three and five years Between one and two years Less than one year No Initiative All Others 16% 15% 18% 16% 36% Best-in-Class 29% 11% 18% 29% 15%
More than five years Between three and five years Between one and two years Less than one year No Initiative Best-in-Class 29% 11% 18% 29% 15%
More than five years Between three and five years Between one and two years Less than one year No Initiative All Others 16% 15% 18% 16% 36% All Others 16% 15% 18% 16% 36% n = 130
Source: Aberdeen Group, April 2011
Knowledge Management
It may not garner the same attention as electronic workflow, or carry the same cache as OCR, but effective document archival can help to both save time when retrieving historical documents and keep compliant with financial document retention regulations. The value is not lost on the Best-in-Class, which have established centralized, searchable invoice archives more than 40% more often than the Industry Average, and nearly 2.5-times as often as Laggard companies. With proper indexing, such archives allow for quick retrieval to support timely response to inquiries from internal stakeholders and external partners (or governmental authorities).
While processes and technologies tend to dominate discussions of AP automation, the integral role played by individual staff-members should not be overlooked. In order to realize the potential benefits of process redesign and technology implementation, enterprises must ensure that new policies are communicated and followed, and that employees are knowledgeable enough to take full advantage of available features and functionality. Best-in-Class respondents have outpaced their peers in addressing these needs by providing both reference materials (an on-demand, self-service approach) and training classes (an interactive approach) far more often than lower-performing companies. Specifically, the Best-in-Class are 70% more likely to provide reference materials and 92% more likely to provide access to training classes than all other respondents.
Technology
When it comes to AP improvement, process automation is where the rubber hits the road. For PO-based invoices, ensuring that there is agreement between invoiced items, quantities, prices and terms and the original purchase order is incredibly valuable - and also quite
time-consuming. Comparing tens or hundreds of line-items across thousands of invoices can be a daunting task. But this is another area where the
Best-in-Class are leading the way on the path of automation. In an area that truly defines Best-in-Class operations, they have automated the matching of invoices to POs 54% more often than the Industry Average and nearly twice as often as Laggards.
Continuing their leadership, top-performers are also much more likely to have tied AP to contract management, allowing for line-level matching of incoming invoices to negotiated pricing (87% more often than others) and payment terms (111% more often than others). This helps to provide comprehensive coverage of incoming invoices, covering non-PO-based purchases under blanket contracts that do not raise individual POs. Facilitating matches of these items also ensures that the efforts (and time) expended by colleagues in procurement during sourcing and negotiations do not go to waste. Without proper comparison, AP could process and pay invoices containing higher prices and/or less advantageous payment terms than the enterprise deserves.
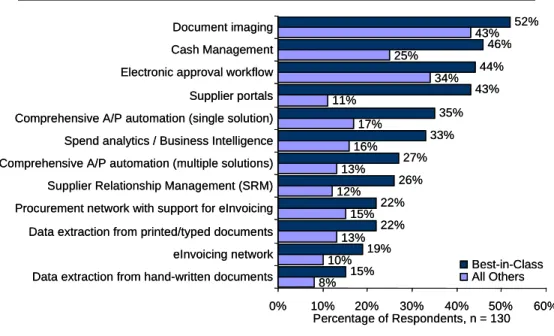
Figure 4: Technology Choices of the Best-in-Class
8% 10% 13% 15% 12% 13% 16% 17% 11% 34% 25% 43% 15% 19% 22% 22% 26% 27% 33% 35% 43% 44% 46% 52% 0% 10% 20% 30% 40% 50% 60% Data extraction from hand-written documents
eInvoicing network Data extraction from printed/typed documents Procurement network with support for eInvoicing Supplier Relationship Management (SRM) Comprehensive A/P automation (multiple solutions) Spend analytics / Business Intelligence Comprehensive A/P automation (single solution) Supplier portals Electronic approval workflow Cash Management Document imaging Percentage of Respondents, n = 130 Best-in-Class All Others 8% 10% 13% 15% 12% 13% 16% 17% 11% 34% 25% 43% 15% 19% 22% 22% 26% 27% 33% 35% 43% 44% 46% 52% 0% 10% 20% 30% 40% 50% 60% Data extraction from hand-written documents
eInvoicing network Data extraction from printed/typed documents Procurement network with support for eInvoicing Supplier Relationship Management (SRM) Comprehensive A/P automation (multiple solutions) Spend analytics / Business Intelligence Comprehensive A/P automation (single solution) Supplier portals Electronic approval workflow Cash Management Document imaging
Percentage of Respondents, n = 130 Best-in-Class All Others
Source: Aberdeen Group, April 2011 As is evident in Figure 4, there is no shortage of available solutions to address enterprises' desire to improve AP performance. Document imaging tackles the problem of paper invoices by converting them into digital images through a scanning solution. These digitized documents can be passed directly to an electronic workflow (which follows business rules to ensure that it is shared with the right reviewers to evaluate and approve for payment), or they can be first processed by data extraction tools like OCR to transform them into importable data. Invoices that do not come in via postal mail or fax can be transmitted over facilitating networks, whether dedicated specifically to invoices or to addressing additional functions such as purchasing/requisitioning via supplier networks. To provide another layer of options, these solutions can be operated by the enterprise's own staff, or
© 2011 Aberdeen Group. Telephone: 617 854 5200 by outsourced providers that handle the full range of incoming invoice
formats, so that the client receives a direct data transmission regardless of the form an invoice took when sent by a supplier.
Performance Management
When managing AP operations, there are two main reasons to stay on top of the current state of invoice processing: to ensure that invoices are flowing efficiently from receipt through payment, and to quickly address outstanding issues as they occur. Here, the Best-in-Class have employed performance dashboards to a much higher degree than their competitors: specifically, 2.7-times as often as the Industry Average, and over 4-times as often as Laggards. These tools provide a high-level overview of items such as outstanding invoice volumes, current exceptions (and exception type), and process bottlenecks (i.e., individual reviewing managers with multiple invoices in queue). Most solutions also offer the ability to dig into the underlying data, moving from the high-level summary view down into individual transactions.
Fulfilling the True Promise of P2P
In the market, there is a bit of discontinuity in the use of the P2P label, whether it is cited as Procure-to-Pay or Purchase-to-Pay. On one side, the moniker is inclusive of the requisitioning and purchase order
processes; on the other, P2P picks up beginning with invoice receipt, and does not carry backwards into the procurement realm. Though this is of debatable importance at present, some current trends may point to a convergence within solutions that will put the issue to rest once and for all with the convergence of procurement and AP.
That solution providers that have traditionally focused on procurement are expanding forward in the P2P cycle - and those that began in AP are looking back - should not be a surprise. Current respondents viewed collaboration between AP and procurement as one of the most promising areas for driving benefit for the enterprise (see Table 4 in Chapter One). One area to keep on the radar as time progresses is the influence of collaborative networks on the ability to bring these functions together.
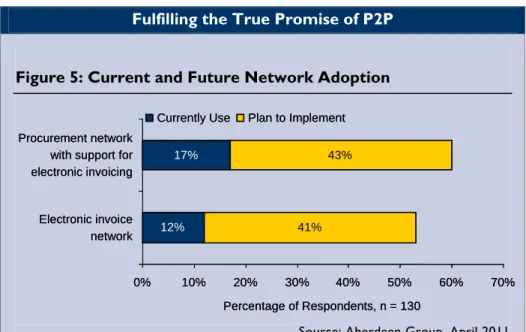
Fulfilling the True Promise of P2P Figure 5: Current and Future Network Adoption
Currently Use 12% 17% 41% 43% 0% 10% 20% 30% 40% 50% 60% 70% Electronic invoice network Procurement network with support for electronic invoicing
Percentage of Respondents, n = 130 Plan to Implement
Currently Use Plan to Implement
12% 17% 41% 43% 0% 10% 20% 30% 40% 50% 60% 70% Electronic invoice network Procurement network with support for electronic invoicing
Percentage of Respondents, n = 130
Source: Aberdeen Group, April 2011 As illustrated in Figure 5, current respondents reported significant
interest in expanding their usage of networks for receiving electronic invoices from suppliers. Though by only a slight margin, interest in procurement/supplier networks that also facilitate electronic invoicing outpaces interest in networks dedicated solely to e-invoicing. Of course, current preferences can change, and with the differences in associated functionality, solutions, and pricing models between different network providers the future is anything but certain.
© 2011 Aberdeen Group. Telephone: 617 854 5200
Chapter Three:
Required Actions
Fast Facts
√ 72% of Best-in-Class enterprises have a central, searchable archive for invoices
√ 62% of the Best-in-Class have comprehensive AP automation in place (via single or multiple solutions) Whether a company is trying to move its invoicing processing performance
from Laggard to Industry Average, or Industry Average to Best-in-Class, the following actions will help spur the necessary performance improvements:
Laggard Steps to Success
• Standardize your invoice receipt and approval processes across locations and business units. Those who have done so report exception rates (invoices requiring management intervention) 30% lower than other respondents. Not only is there a direct impact on organizational performance, but such standardization also lays a common foundation for inter-unit sharing of best practices and eases the path for future centralization, if desired.
• Centralize important IR&W processes, such as initial receipt, discrepancy resolution, and final payment. Depending on the nature of each individual business, not all aspects of invoice processing are well-suited for centralization. But consolidating activities such as receipt and discrepancy resolution can help drive efficiency by eliminating redundant operations and capitalizing on economies of scale. In fact, responding companies that have centralized IR&W processes report invoice processing times 43% lower than their decentralized peers.
• Quantify the benefits of AP automation to secure
executive support. If your AP department does not already have an executive championing your cause, take advantage of
benchmarking information (such as provided in Chapter One) and available ROI calculation tools to put a dollar figure on potential improvements. Enterprises with such executive sponsorship are 40% less likely to have a lack of internal support pose a challenge for their improvement efforts.
Industry Average Steps to Success
• Enable the automated matching of invoices to purchase orders. This is where automation can begin to drive tangible benefits by allowing you to reduce manual processing and focus on exception management. Companies with automated matching of invoices to POs report processing costs 36% lower than other firms.
• Integrate AP with contract management to enable
comparison of invoices to negotiated payment terms and pricing. Unlike PO matching, doing the legwork to compare contract pricing and terms to what was invoiced may not occur at all in a manual environment - and whatever beneficial items had been negotiated by
Procurement initially may be lost if not checked and enforced. Respondents that check invoices against contracted payment terms secure early payment discounts at a rate more than twice that of their peers (35% vs. 16% of total invoices), and those that compare pricing are able to ensure this item-level accuracy at a cost 48% lower than other enterprises.
• Maintain a centralized, searchable archive for invoices to ensure ease of accessibility after the initial approval process is complete. The value of electronic invoices does not cease after they are processed and suppliers are paid. They contain data on vendors, items, prices, and terms that can benefit procurement during subsequent negotiations - and finance itself in the face of a potential audit. With an eye toward AP operations, responding enterprises with an archive in place report achieving good to real-time visibility into supplier performance at a rate over 5-times that of all others (36% vs. 7%).
Best-in-Class Steps to Success
• Pursue comprehensive AP automation to drive continued performance improvement. Even for the highest-performing enterprises, there is room for improvement. Maximizing the impact of automation on all AP processes, from receipt to scanning and approval workflow through payment, is the end goal. Respondents that have completed this picture (whether through a single solution, or by combining multiple solutions) report invoice processing costs 21% lower than others, while also securing early payment discounts on more than twice the number of transactions.
• Integrate AP with your back-end ERP or financial systems to eliminate manual re-keying of data and reduce the chance of inconsistencies between solutions. With hand-offs between systems at different stages of the procure-to-pay process, visibility can be compromised. Tying these systems together can help address this concern, as responding enterprises that have integrated report good or real-time visibility into both payment status (78% vs. 38%) and the potential for duplicate invoices (64% vs. 29%) at rates more than twice that of others.
• Develop or implement performance dashboards to distill large volumes of transaction information into a simple and accessible display. Continuous improvement calls for insight into current operations, including numbers of outstanding invoices, errors (and error types), and bottlenecks in the system. Those enterprises that have put such performance dashboards in place report year-over-year improvements in both processing times (75% greater than others) and early discount capture (1.75-times greater than others) that truly highlight how visibility can help drive
© 2011 Aberdeen Group. Telephone: 617 854 5200 Paper in AP: The Song Remains the Same
For this year's group of enterprises, paper-based invoices still make up a large majority of the overall volume, at just over 76%. The Best-in-Class have been able to drive that figure down a bit, but are still receiving more than 60% of their invoices in physical form. Based on the market's
current maturity and the limitations inherent in dealing with smaller, less sophisticated suppliers on the long-tail of enablement efforts, it is safe to say that we will not see a truly paperless AP environment for a long time to come. This is why it is so important to take a portfolio (rather than one-size-fits-all) approach to the paper predicament.
With the dominant pressures being cost reduction and lack of visibility, the key is to ensure that invoices are efficiently input into a management system - regardless of whatever form they took when originally
submitted. The ideal form is, of course, direct data transmission via Electronic Data Interchange (EDI), eXtensible Markup Language (XML) files, or similar formats. But for email attachments, there is either document management (keeping them in image form with header-level indexing) or data extraction via technologies like OCR. For lower-volume suppliers, there is the manual data entry of a supplier portal. For the long-tail, there are scanning options that can be completed in decentralized or centralized environments - or via Business Process Outsourcing (BPO) to reduce internal resource requirements and capitalize on a provider's scale. In all of these scenarios, the goal is to work with invoices in an electronic form, driving down costs and processing times by streamlining operations, automating previously-manual processes, and managing by exception - rather than by default.
Regarding deployment options: "Typically we prefer whichever is financially the better decision. We have internal staff to support in house installations when that makes the most sense financially."
~ AP Manager, North American Food & Beverage company
Appendix A:
Research Methodology
Between March and April 2011, Aberdeen examined the use, the experiences, and the intentions of 130 respondents managing accounts payable in a diverse set of enterprises.
Study Focus
Responding executives and professionals completed an online survey that included questions designed to determine the following:
√ The degree to which AP automation is deployed in their operations and the financial implications of the technology
√ The structure and
effectiveness of existing AP automating implementations
√ Current and planned use of supporting technologies to aid in AP improvement
√ The benefits, if any, that have been derived from AP automation initiatives The study aimed to identify emerging best practices for AP automation usage across industries, and to provide a framework by which readers could assess their own management capabilities. Aberdeen supplemented this online survey effort with interviews with select
survey respondents, gathering additional information on accounts payable automation strategies, experiences, and results.
Responding enterprises included the following:
• Job title: The research sample included respondents with the following job titles: Executive (CEO,CFO, CIO, President, etc.) (16%); EVP / SVP / VP / Controller (23%); Director (14%); Manager (30%); Consultant (7%); and other (10%).
• Department / function: The research sample included respondents from the following departments or functions: Accounts Payable (23%); Finance & Administration (21%); Procurement (16%); IT (8%)l Operations (7%); and other (25%).
• Industry: The research sample included respondents from a broad selection of industries, including: IT (11%); Financial Services (9%); Software (9%); Healthcare (9%); Industrial Manufacturing (6%); Education (5%); Retail (5%); Utilities (4%).
• Geography: The majority of respondents (79%) were from North America. Remaining respondents were from Europe (16%), the Asia-Pacific region (2%), South and Central America (2%), and the Middle East and Africa (1%).
• Company size: Thirty-eight percent (38%) of respondents were from large enterprises (annual revenues above US $1 billion); 27% were from midsize enterprises (annual revenues between $50 million and $1 billion); and 35% of respondents were from small businesses (annual revenues of $50 million or less).
• Headcount: Fifty-five percent (55%) of respondents were from large enterprises (headcount greater than 1,000 employees); 23% were from midsize enterprises (headcount between 100 and 999 employees); and 22% of respondents were from small businesses (headcount between 1 and 99 employees).
© 2011 Aberdeen Group. Telephone: 617 854 5200 Table 6: The PACE Framework Key
Overview
Aberdeen applies a methodology to benchmark research that evaluates the business pressures, actions, capabilities, and enablers (PACE) that indicate corporate behavior in specific business processes. These terms are defined as follows:
Pressures — external forces that impact an organization’s market position, competitiveness, or business operations (e.g., economic, political and regulatory, technology, changing customer preferences, competitive)
Actions — the strategic approaches that an organization takes in response to industry pressures (e.g., align the corporate business model to leverage industry opportunities, such as product / service strategy, target markets, financial strategy, go-to-market, and sales strategy)
Capabilities — the business process competencies required to execute corporate strategy (e.g., skilled people, brand, market positioning, viable products / services, ecosystem partners, financing)
Enablers — the key functionality of technology solutions required to support the organization’s enabling business practices (e.g., development platform, applications, network connectivity, user interface, training and support, partner interfaces, data cleansing, and management)
Source: Aberdeen Group, April 2011 Table 7: The Competitive Framework Key
Overview The Aberdeen Competitive Framework defines enterprises as falling into one of the following three levels of practices and performance:
Best-in-Class (20%) — Practices that are the best currently being employed and are significantly superior to the Industry Average, and result in the top industry performance.
Industry Average (50%) — Practices that represent the average or norm, and result in average industry
performance.
Laggards (30%) — Practices that are significantly behind the average of the industry, and result in below average performance.
In the following categories:
Process — What is the scope of process standardization? What is the efficiency and effectiveness of this process?
Organization — How is your company currently organized to manage and optimize this particular process?
Knowledge — What visibility do you have into key data and intelligence required to manage this process?
Technology — What level of automation have you used to support this process? How is this automation integrated and aligned?
Performance — What do you measure? How frequently? What’s your actual performance?
Source: Aberdeen Group, April 2011 Table 8: The Relationship Between PACE and the Competitive Framework
PACE and the Competitive Framework – How They Interact
Aberdeen research indicates that companies that identify the most influential pressures and take the most transformational and effective actions are most likely to achieve superior performance. The level of competitive performance that a company achieves is strongly determined by the PACE choices that they make and how well they execute those decisions.
Appendix B:
Related Aberdeen Research
Related Aberdeen research that forms a companion or reference to this report includes:
• Supply Chain Finance: Gaining Control in the Face of Uncertainty; January 2011
• Operational Cash Management: Streamlining Processes to Unlock Liquidity; November 2010
• The E-Payables Solution Selection Report: A Buyer's Guide to Accounts Payable Optimization; October 2010
• E-Payables 2010: The Strategic Value of Accounts Payable Automation; August 2010
• Invoicing and Workflow: Transforming Process Automation into Operational Cost Control; April 2010
Information on these and any other Aberdeen publications can be found at
www.aberdeen.com.
Author: Scott Pezza, Senior Research Associate, Financial Management & GRC, ([email protected])
For more than two decades, Aberdeen's research has been helping corporations worldwide become Best-in-Class. Having benchmarked the performance of more than 644,000 companies, Aberdeen is uniquely positioned to provide organizations with the facts that matter — the facts that enable companies to get ahead and drive results. That's why our research is relied on by more than 2.5 million readers in over 40 countries, 90% of the Fortune 1,000, and 93% of the Technology 500.
As a Harte-Hanks Company, Aberdeen’s research provides insight and analysis to the Harte-Hanks community of local, regional, national and international marketing executives. Combined, we help our customers leverage the power of insight to deliver innovative multichannel marketing programs that drive business-changing results. For additional information, visit Aberdeen http://www.aberdeen.com or call (617) 854-5200, or to learn more about Harte-Hanks, call (800) 456-9748 or go to http://www.harte-hanks.com.
This document is the result of primary research performed by Aberdeen Group. Aberdeen Group's methodologies provide for objective fact-based research and represent the best analysis available at the time of publication. Unless otherwise noted, the entire contents of this publication are copyrighted by Aberdeen Group, Inc. and may not be reproduced, distributed, archived, or transmitted in any form or by any means without prior written consent by Aberdeen Group, Inc. (2011a)