Research Report
Early prediction of long-term tactile object
recognition performance after sensorimotor stroke
Eugenio Abela
a,b, John H. Missimer
c, Manuela Pastore-Wapp
a,
Werner Krammer
a,d, Roland Wiest
aand Bruno J. Weder
a,*aSupport Centre for Advanced Neuroimaging (SCAN), Institute for Diagnostic and Interventional Neuroradiology, Inselspital, Bern University Hospital, University of Bern, Bern, Switzerland
bDivision of Neuroscience, Institute of Psychiatry, Psychology and Neuroscience, King's College London, United Kingdom
c
Laboratory of Biomolecular Research, Paul Scherrer Institute, Villigen, Switzerland dNeurology Department, St. Gallen, Switzerland
a r t i c l e i n f o
Article history: Received 11 September 2018 Reviewed 24 October 2018 Revised 20 November 2018 Accepted 10 January 2019 Action editor David Carey Published online 7 February 2019 Keywords:Cortical sensorimotor stroke Tactile object recognition (TOR) Multi-voxel pattern analysis Prediction
Neuronal network for shape recognition
a b s t r a c t
Until now tactile agnosia has been reported only in small, but detailed cross-sectional case studies. Here we show that multi-voxel pattern analysis (MVPA) of early diffusion-weighted lesion maps can be used to accurately predict long-term recovery of tactile ob-ject recognition (TOR) in 35 subob-jects with varying hand skill impairment and associated specific daily activity limitation after cortical sensori-motor stroke. Multiple regression analysis revealed the essentially dysfunctional subprocesses for object recognition in the specifically impaired subjects, i.e., grasping as determined by a subtest of Jebsen Taylor hand function test, and perception of macrogeometrical object properties. The Gaussian process regression of MVPA represents a function that relates a selection of lesioned voxels as input variables to TOR performance scores as target variables. On the behavioural level, patients fell into three recovery subgroups, depending on TOR performance over the observation period. Only baseline motor hand skill and shape discrimination were signif-icantly correlated with the TOR trajectories. To define functionally meaningful voxels, we combined information from MVPA of lesion maps and a priori knowledge of regions of interest derived from a data bank for shape recognition. A high significance for the pre-dicted TOR performances over nine months could be verified by permutation tests, leading us to expect that the model generalises to larger patient cohorts with first cortical ischemic stroke. The lesion sites of the persistently impaired subjects exhibited an overlap with critical areas related to the MVPA prediction map in the cytoarchitectonic areas PFt of
*Corresponding author. Support Centre for Advanced Neuroimaging (SCAN), Institute for Diagnostic and Interventional Neuroradiology, University Hospital, Inselspital, Bern, Switzerland.
E-mail addresses: [email protected] (E. Abela), [email protected] (J.H. Missimer), [email protected]
(M. Pastore-Wapp),[email protected] (W. Krammer),[email protected] (R. Wiest),[email protected], bruno.weder@
insel.ch(B.J. Weder).
Available online at
www.sciencedirect.com
ScienceDirect
Journal homepage:www.elsevier.com/locate/cortex
https://doi.org/10.1016/j.cortex.2019.01.018
0010-9452/©2019 The Authors. Published by Elsevier Ltd. This is an open access article under the CC BY-NC-ND license (http://creativeco
inferior parietal lobule and OP1 of parietal operculum which are associated with higher order sensory processing. This ultimate check corroborated the significance of the MVPA map for the prediction of tactile object recognition. The clinical implication of our study is that neuroimaging data acquired immediately after first stroke could facilitate individual forecasting of post-stroke recovery.
©2019 The Authors. Published by Elsevier Ltd. This is an open access article under the CC
BY-NC-ND license (http://creativecommons.org/licenses/by-nc-nd/4.0/).
1.
Introduction
Epidemiological data suggest that up to 50 percent of stroke survivors older than 65 years of age suffer from some residual hemiparesis (Go et al., 2013). Persistent sequelae and their impact, e.g., on upper extremity function, might be charac-terised in four dimensions, i.e., loss of body functions and structures, activity limitations, participation restrictions and contextual factors (Miller et al., 2010; Veerbeek, Kwakkel, van
Wegen, Ket,&Heymans, 2011).
As to body function, the severity of initial upper limb impairment correlates highly with future functional outcome, and could thus serve as a parsimonious indicator of recovery
potential in clinical practice (Chen&Winstein, 2009; Krakauer
&Marshall, 2015; Kwakkel, Kollen, Van der Grond,&Prevo,
2003).Kwakkel et al. (2003)found in 62 percent of cases
pre-senting flaccid upper limb post-stroke that no signs of dex-terity reappeared after six months. This outcome was heralded by lack of voluntary leg control and no emergence of arm synergies in the first month. However, marked variability in long-term sensorimotor outcomes hinders accurate indi-vidual predictions, particularly in severely affected
in-dividuals (Stinear, 2010; Stinear, Byblow, Ackerley, Barber,&
Smith, 2017).
As to activity limitations, preserved partial dexterity and perceived participation after moderate and mild stroke have
been shown byEkstrand, Rylander, Lexell, and Broga˚rdh (2016)
to be specifically important resources for further rehabilita-tion of the upper extremity. In particular, manual dexterity includes motor control during active touch such as the grasping of objects, which is characterized by finger move-ments that are both partly independent and temporally
syn-chronized (Ekstrand et al., 2016; Teremetz, Colle, Hamdoun,
Maier,&Lindberg, 2015).
Tasks required to discriminate somatosensory stimuli seem to be very vulnerable to ischemic stroke during both
acute and chronic phases of disease (Carey&Matyas, 2011;
Kim&Choi-Kwon, 1996). In the study ofCarey and Matyas (2011), 47 percent of subjects exhibited tactile discrimina-tion impairment in the contralesional hand, mostly of se-vere degree, after a mean of 50 days post-stroke. Also, persistent somatosensory impairments are associated with poor functional outcome, longer recovery trajectories, and
increased rates of dependence (Han, Law-Gibson,&Reding,
Abbreviations
DWI diffusion-weighted imaging
FDR false-discovery rate
FLAIR fluid attenuated inversion recovery
GPR Gaussian process regression
hIP1, hIP2 subareas hIP1 and hIP2 within intraparietal sulcus
ifg inferior frontal gyrus
ins insula
ipl inferior parietal lobule
ips intraparietal sulcus
LOSO leave-one-subject-out
MAC discrimination of macrogeometrical object
properties
MIC discrimination of microgeometrical object
properties
MNI Montreal Neurological Institute
MRI magnetic resonance imaging
mRS modified Rankin scale
MSE mean squared error
MVPA multi-voxel pattern analysis
N/R Normal/Recovered group
OP1 subarea OP1 of the parietal operculum
OP4 subarea OP4 (SII, see below) of the parietal
operculum
PC principal components
PCA principal component analysis
PI Persistently Impaired group
pop parietal operculum
PPC posterior parietal cortex
PPT pressure perception threshold
PR Partially Recovered group
pr/pocg pre- and postcentral gyrus
PSO picking small objects (subtest of Jebsen Taylor
hand function test)
SI Somatosensory Cortex I
SII Somatosensory Cortex II
smg supramarginal gyrus
spl superior parietal lobule
TA tactile agnosia
TOR tactile object recognition
VPL/VPI ventral posterolateral and ventroposterior inferior nuclei of thalamus
2002; Smith, Akhtar, & Garraway, 1983; Tyson, Hanley,
Chillala, Selley, & Tallis, 2008; Welmer, Holmqvist, &
Sommerfeld, 2008). The present study focused on the re-covery after a cortical sensori-motor stroke of tactile object recognition (TOR) in subjects exhibiting the whole range of mild to severe motor hand skill impairment, an aspect of activity limitation as assessed by specific functional scales.
Differences in brain structures and associated functions, as assessed by lesional and functional neuroimaging studies, might provide insight into this heterogeneity and lead to refined predictive models (Marshall et al., 2009; Rehme et al., 2015; Stinear et al., 2017). Addressing this aim to describe activity limitations depends on determining a measure of recovery that reflects everyday use of the human hand to manipulate, explore and recognise objects
with complex physical properties (Jones&Lederman, 2006).
Primarily we had to develop a measure for recovery of TOR, without visual input employed in the investigation of
pa-tients with tactile agnosia (TA) (Bohlhalter, Fretz,&Weder,
2002; H€omke et al., 2009). TOR requires accurate integration
of multidimensional object characteristics in parallel and hierarchical processing streams that begin in the post-central gyrus and converge to multimodal regions of the intraparietal sulcus (areas hIP1, hIP2), posterior parietal cortices and secondary somatosensory areas of the parietal operculum (OP1, OP4) (Bohlhalter et al., 2002; Dijkerman and De Haan, 2007; Eickhoff, Paus, et al., 2007; Grefkes,
Weiss, Zilles, &Fink, 2002; Hsiao, 2008; Kurth et al., 2010;
Reed, Klatzky,&Halgren, 2005).
In order to predict recovery of higher order sensory pro-cessing underlying TOR in individuals, we relied on a method, multi-voxel pattern analysis (MVPA) of lesion maps using diffusion weighted MRI post-stroke, which provides a regression function derived from a training data set to model performance trajectory of sensorimotor hand function. In our study the Gaussian process regression of MVPA yields such a function, relating a selection of lesioned voxels as input variables to TOR performance scores as target vari-ables. We hypothesized that (i) lesions to premotor and pa-rietal regions contribute most strongly to the classification according to TOR performance trajectories of a cohort of patients with cortical ischemic sensorimotor stroke, (ii) multivariate lesion patterns predict TOR trajectories in these patients, providing a structural network of significant cortical neuronal nodes underlying TOR performance and its recovery, and (iii) lesion matching with the structural network might uncover specific lesion sites disrupting tactile information processing in a persistently and severely impaired subgroup, most likely to represent specific aper-ceptive tactile agnosia.
2.
Material and methods
In the sections below, we report how we determined our sample size, all data exclusions, all inclusion/exclusion criteria, whether inclusion/exclusion criteria were established prior to data analysis, all manipulations, and all measures in the study.
2.1. Participants
We recruited stroke patients from two comprehensive stroke centres in Switzerland (Department of Neurology, Kant-onsspital St. Gallen, and University Department of Neurology, Inselspital, Bern). Inclusion criteria were: (1) first ever ischemic stroke, (2) clinically significant hand plegia or paresis as leading symptom, and (3) involvement of the pre- and/or postcentral gyri confirmed on diffusion-weighted (DWI) and fluid attenuated inversion recovery (FLAIR) magnetic reso-nance imaging (MRI). Additional involvement of frontal, pa-rietal and opercular regions was accepted but not selected for. Exclusion criteria were: (1) aphasia or cognitive deficits severe enough to preclude understanding the study purposes or task instructions, (2) prior cerebrovascular events, (3) occlusion of
the carotid arteries on MReangiography, (4) purely subcortical
stroke b/c not directly related to cortical functions, and (5) other medical or neurological conditions interfering with task performance. These criteria were established prior to data analysis. The study received ethical approval from the insti-tutional review boards of both research sites. All participants gave written informed consent before enrolment, according to the Declaration of Helsinki (World Medical Association, 2013). We enrolled 44 patients. Of these, 8 dropped out (3 with-drew consent, 2 were too frail for repeated testing, 2 were lost to follow-up, 1 was shown to have no cortical stroke after enrolment). The final cohort size was 36. Additionally, we recruited 24 age-matched controls from the local population without history of neurological or psychiatric disease. 2.2. Methods
2.2.1. Overview
We conducted a prospective, observational longitudinal study that consisted of three main visits: a baseline behavioural investigation during the first two weeks after stroke and follow-up examinations at 3 and 9 months. We additionally performed monthly control visits to monitor sensori-motor hand recovery. Healthy controls for comparison of baseline data were investigated in two visits one month apart. For the present analysis, we used DW-MRI data that were acquired at baseline in the acute stage, and used structural MRI data ac-quired at 3 and 9 months for quality control purposes
(Appendix Fig. A1summarises study time-line and analysis
methods). Lesion maps relying on DW-MRI data were used to predict TOR trajectory over the observation period of nine months. Sample size was determined by the available data (Abela et al., 2012). No part of the study procedures or analyses was pre-registered prior to the research being undertaken. Study data, digital study materials and analysis code accom-panying this manuscript are deposited in a publicly accessible repository (https://osf.io/rgsbj/). This also includes the orig-inal project description, as accepted by Swiss National Foun-dation SNF (grant number 118018). A lay summary has been published by SNF and registered in the SNF database (http:// p3.snf.ch/project-118018).
2.2.2. Behavioural data
We assessed stroke severity using the NIH Stroke Scale (Brott et al., 1989), syndrome severity using the modified Rankin
scale (mRS) (van Swieten, Koudstaal, Visser, Schouten,&van Gijn, 1988), and disability with the Barthel Index (Lai,
Studenski, Duncan,&Perera, 2002).
We next assessed sensorimotor functions of both hands. We measured fine motor skill using the Jebsen-Taylor Hand
Function test (Jebsen, Taylor, Trieschmann, Trotter, &
Howard, 1969). As reported in previous analyses, we found the picking small objects (PSO) subtest to be the most infor-mative with respect to residual motor skill in grasping, the precondition for exploring objects (Abela et al., 2012). PSO re-quires the patient to pick six small objects consisting of 2 paper clips, 2 bottle caps and 2 coins with one hand, and drop them as fast as possible into an empty can in front of them. Performance was measured in seconds.
We quantified cutaneous pressure perception threshold (PPT) with graded monofilaments as described in (Dyck,
O'Brien, Kosanke, Gillen, & Karnes, 1993) and measured
micro- and macrogeometrical discrimination (MIC and MAC, respectively), as previously reported (Bohlhalter et al., 2002;
H€omke et al., 2009; Weder, Nienhusmeier, Keel, Leenders,&
Ludin, 1998). MIC was determined by presenting the blind-folded subject with two grated plastic surfaces with different degrees of roughness, and asking them to choose which was rougher. For MAC, we presented two aluminium parallelepi-peds of differing oblongness, and asked participants to judge which was longer. For both tasks, we presented 24 counter-balanced pairs of objects, and quantified performance as the proportion of correct decisions. Differences in roughness and oblongness were fixed at a threshold that yielded 90% correct decisions in healthy controls (Weder et al., 1998).
To investigate TOR performance, we presented partici-pants with 30 common everyday objects, which they explored with one hand while blindfolded (Bohlhalter et al., 2002). Ob-jects were empirically chosen from household items that could be easily grasped, held and explored with one hand (see Appendix Table A.1). We sequentially presented each object to
the patient's palmar part of exploring fingers, allowing a
maximum of 10 seconds for manual exploration and object recognition and 5 seconds pause after each presentation. One run was performed per hand. Object presentations and order of hands were pseudorandomized over subjects and visits.
Missing data of behavioural tests in a few cases (n ¼4) at
baseline, due to severe paresis, have been replaced by the
mean cohort's value at that time.
2.2.3. Neuroimaging data
At baseline scanning was carried out in the first 9 cases at 1.5 Tesla on a clinical whole-body MR scanner (SIEMENS Magne-tom Vision) using the standard head coil; in the residual cases MRI studies were performed at 3 Tesla on a clinical whole-body MR scanner (SIEMENS Trio). All follow-up scans were carried out at 3 Tesla on the whole body MR scanner (SIEMENS Trio). The T1-weighted (T1w) and diffusion-weighted images (DWI) from both centres were processed as described below.
One patient's raw DWI data (study ID: p46) were corrupted and
could not be recovered. This patient was excluded from lesion-based analyses reported below. MRI acquisition
pa-rameters are summarised inappendix Table A.2.
Lesions were manually traced by one author (EA) on DWI scans using MRIcron (https://www.nitrc.org/projects/mricron/),
resulting in binary lesion masks in individual anatomical space. DWI images and binary lesion masks were co-registered to T1w
images using SPM12 (http://www.fil.ion.ucl.ac.uk/spm/
software/spm12/) for MATLAB (R2016b, The MathWorks, Inc., Natick, Massachusetts, United States). Next, we segmented and normalized the T1w images into Montreal Neurological Insti-tute (MNI) space using unified segmentation-normalisation
(Ashburner& Friston, 2005). We used cost-function masking
to exclude damaged areas from the calculation of the
normal-isation parameters (Andersen, Rapcsak,&Beeson, 2010; Brett,
2001). We then applied these parameters to warp lesion masks into MNI space. These steps were accomplished using
the Clinical Toolbox for SPM12 (ChristopherRorden, Bonilha,
Fridriksson, Bender, & Karnath, 2012). Lesion masks were
further smoothed with an isotropic 4 mm3Gaussian kernel to
compensate for interpolation errors (Abela et al., 2012). Left-sided lesions were flipped onto the right hemisphere to in-crease statistical power. Neuroanatomical localisation was
done with the SPM Anatomy Toolbox (Version 2c.c,http://www.
fil.ion.ucl.ac.uk/spm/ext/#Anatomy). 2.3. Data analysis and statistics
2.3.1. Analysis of behavioural data
Behavioural data were analysed blinded to lesion mapping results. We compared baseline demographic and clinical data between patients and controls using the Chi-square test for proportions and unpaired t-test for normally distributed data. All behavioural data were converted to z-scores using gender-and hgender-and-matched data from the healthy control group, such that more negative scores indicated increased impairment. To test for statistically significant impairment at study entry, we performed Wilcoxon signed-rank tests on baseline z-scores.
We characterised TOR performance in two ways. To obtain a continuous measure of TOR performance, we computed a principal component analysis (PCA) of longitudinal TOR per-formance data (3 visits, 36 patients) using the MATLAB func-tionprincomp.m. This resulted in three principal components (PC), including time course, variance and 36 patient scores for
each PC. These scores summarise each patient's longitudinal
performance and represent our main outcome measure. We then classified patients into performance groups, based on the number of correctly identified objects at the end of the study: the Normal/Recovered group (N/R) included patients who attained TOR performance within the limits of healthy
con-trols, i.e., 26e30 objects; the Partially Recovered group (PR)
included patients who attained the lower bound of controls
and achieved at least 50% correct recognitions (15<n<26);
and the Persistently Impaired group (PI) consisted of patients
who achieved less than 50% (n<15). Intersubject Mahalonobis
distances in the multidimensional vector space of TOR per-formance have been calculated, as well as their Gaussian mixture distribution in one dimension.
We used a multiple linear regression model of all subjects to test if baseline demographic and clinical characteristics,
lesion volume, and sensorimotor functions predicted patients'
PCA-derived TOR scores. We implemented the model with the
MATLAB functionfitlm.m, using robust regression via
itera-tively reweighted least-squares fitting (Holland & Welsch,
2.3.2. Lesion-based prediction of tactile object recognition performance
To predict individual TOR performance from lesion maps we implemented a MVPA pipeline using the Pattern Recognition
for Neuroimaging Toolbox (PRONTO, version 2.0, http://
www.mlnl.cs.ucl.ac.uk/pronto/). Specifically, we applied Gaussian process regression (GPR) to predict TOR perfor-mance from voxel-wise lesion maps. A GPR model provides a way to learn a regression function from training data set
D¼{X, y}, wereXis a matrix of input feature vectors (in our
case a selection of lesioned voxels) andya vector of target
variables (TOR performance scores). Our goal is then to
pre-dict a new target valuey*from a new samplex*, using this
function. GPR is a Bayesian extension of linear regression that can be used to solve supervised pattern recognition problems; the Gaussian process is a multivariate normal distribution that defines a prior over the regression functions
one wishes to evaluate (Rasmussen & Nickisch, 2010). A
detailed treatment of this class of models can be found in
(Seeger, Rasmussen, & Williams, 2004; Rasmussen &
Williams, 2006), examples of their application to neuro-imaging data in (Marquand et al., 2010; Young et al., 2013).
2.3.3. A priori voxel selection related to tactile information
processing
A critical issue for MVPA is the selection of the data to which the algorithm is applied, because including irrele-vant voxels can degrade model performance (Norman,
Polyn, Detre, & Haxby, 2006). One way to pre-select data
is to use regions defined by functional criteria (Haxby, 2001). The criterion we defined was that voxels to which MVPA be applied should correspond to regions that are functionally relevant for healthy tactile performance. To identify these regions in a data-driven way, we performed a meta-analysis of functional MRI data using the Neurosynth database (http://www.neurosynth.org). This framework al-lows users to synthesise the results of a multitude of functional MRI studies into maps that display voxels selectively related to particular search terms (Yarkoni,
Poldrack, Nichols, Van Essen, & Wager, 2011). We used
the search term“tactile”and eliminated all studies that did
not use 3T MRI, did not investigate somatosensory pro-cesses, or reported results of patient populations; the final sample consisted of 45 studies (appendix figure A.2). Syn-thesis of these studies yielded a bi-hemispheric map of
activations uniquely associated with the term“tactile”. The
significance threshold of this map was z ¼ 3.89,
corre-sponding to a false-discovery rate (FDR) of q<.01 (results
are available at https://osf.io/n97cb/). From this map, we
identified 8 activation clusters that were located on the right hemisphere and affected in at least 3 patients. These clusters were binarised at the FDR threshold and used as an analysis mask in PRONTO.
Note that the 8 activation clusters represented now the reference landmarks both for the MVPA map as well as the cytoarchitectonic maps. In order to obtain proper localisation, we verified identical overlap between the activation clusters and the cortical fields, including cytoarchitectonically defined areas, in both hemispheres.
2.3.4. Evaluation of model performance
To evaluate model performance, we used a leave-one-subject-out (LOSO) cross-validation procedure in which the GPR function was repeatedly trained with 34 subjects and then applied to predict the TOR score of the withheld subject. Since LOSO cross-validation can lead to biased estimates in small
sample sizes (Arlot&Celisse, 2010), we repeated this
proced-ure leaving out k¼7 subjects and training the model on the
remaining 28 (Varoquaux et al., 2018). We used Pearson's
correlation coefficient and the mean squared error (MSE) be-tween actual and predicted TOR trajectory scores to assess goodness-of-fit. Significance was derived via permutation
testing (Golland&Fischl, 2003; Schrouff, Rosa, et al., 2013).
2.3.5. Model weight maps and local inference
We represented model results as a weight map recording the relative contribution of each voxel to the model prediction. To allow for local inference, we summed and normalised the
weights (NWcluster) within each cluster (Schrouff, Cremers,
et al., 2013), such that: NWCluster¼
P
v2ClusterjWClusterj
nvCluster
whereWClusteris the matrix of classifier weights per ROI and
nvCluster the number of voxels per cluster. This value thus
provides an estimate of the importance of each cluster to the model.
In the perspective of functionally characterizing the involved brain regions we integrated the weighted maps into a probabilistic cytoarchitectonically based atlas, which is su-perior in this respect to traditional atlases (Eickhoff, Paus, et al., 2007). A quality criterion, i.e., the ratio between mean observed probability for an area within an area [p(obs)] versus overall mean probability of that same area across the brain as expected [p(exp)], assures proper localization within a cytoarchitectonically defined area (Eickhoff et al., 2005).
2.3.6. Reliability of MVPA in predicting lesion maps of
impaired subjects
To check for reliability of the MVPA lesion map in predicting lesioned areas in the case of the PI group, we performed a standard univariate voxel-behaviour analysis, comparing the
N/R group (n¼22 patients) with the PI group (n¼7) using the
Liebermeister measure (Bates et al., 2003; Chris; Rorden,
Karnath, & Bonilha, 2007), as implemented in NiiStat
(https://www.nitrc.org/projects/niistat). As above, signifi-cance was assessed via permutation testing. Results were masked with the meta-analytic clusters identified above, allowing direct comparison with MVPA results. Furthermore, common lesions across subgroups N/R, PR and PI, and overlap with meta-analytic clusters were explored.
2.3.7. Assessing effects of different scanner field strengths
The use of different magnetic field strengths during data
acquisition (see section2.2.3) could lead to erroneous lesion
segmentations, because DWI contrast appears to be lower at 3T compared to 1.5T (Rosso et al., 2010). This in turn could bias MVPA results. To address this, we performed three additional analyses. First, we overlaid lesion maps from patients
scanned at 1.5T with their corresponding follow-up scans acquired at 3T, to visually confirm that lesions overlapped the chronic infarct core. Second, we compared lesion volumes between patients acquired at 1.5T and 3T, using a
ManneWhitney test. Third, we performed a MVPA using a
Gaussian process classifier in PRONTO, to test whether scan-ner field strength could be predicted from lesion maps alone. We used the area under the curve (AUC) and balanced accu-racy as performance measures. Equal lesion volumes and failure to distinguish scanner type using MVPA would militate against a biasing effect of magnetic field strength.
3.
Results
3.1. Tactile object recognition performance
Clinical, demographic and behavioural characteristics are
listed inTable 1. All patients were significantly affected in all
behavioural tests compared to healthy controls. Concerning
TOR, patients identified on average 19 (range 0e30) objects at
baseline (mean time post-stroke 6.2 days, SD 4.0 days) with
their affected hand, 22 (0e30) objects after three months, and
24 (0e30) objects after nine months. Plots of TOR performance
against time revealed highly variable individual trajectories, which we divided into three subgroups using clinical criteria (Fig. 1A). The 22 patients of the N/R) group performed equally well as healthy controls or recovered to that level; the 7 pa-tients of the PI group remained impaired; and the 6 papa-tients of the PR group showed steep trajectories that did not exceed the lower bound of healthy controls. At baseline 31 patients, out of the cohort of 35 finally included into the study, were able to perform tactual exploration of objects presented for TOR. Four subjects exhibited plegic fingers at baseline, and were there-fore unable to explore the objects actively. Based on PSO three of them had recovered at month 1 and the fourth at month 2 sufficiently for active touch underlying TOR. Two of these subjects turned out to represent transient pseudo tactile ag-nosias related to the initial hand plegia and, thus, have been allocated to the N/R group; from the remaining two one has allocated to the PR group and one to the PI group.
Longitudinal PCA of TOR performance indicated that the first PC explained 93.2% of variance in TOR data over time. We
therefore used each patient's score on the first PC as the TOR
performance score characterising his behavioural trajectory over time (Fig. 1B). Typically, negative scores indicated poor and positive scores favourable trajectories over time (Fig. 1B).
Corroborating the clinical classification, the KruskaleWallis
test revealed a statistically significant difference between
the performance scores of each subgroup (c2¼26.06,p<.001).
And finally, a probabilistic model calculating intersubject Mahalonobis distance related to individual TOR performance revealed an almost perfect discrimination between groups (Fig. 1C).
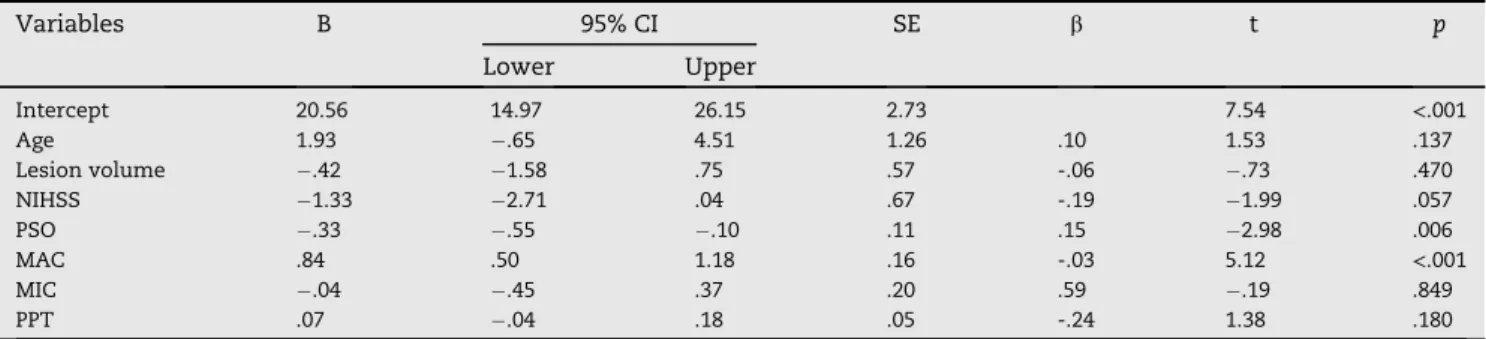
We next used multiple linear regression to test the influ-ence of baseline clinical and behavioural variables on TOR
recovery scores. AsTable 2shows, this analysis indicated that
a model including two baseline predictors, MAC and fine motor skill as quantified by PSO, explained almost 90% of the variance in TOR recovery scores at the level of significance,
p < .001. Importantly, lesion volume was not significantly
associated with TOR performance.
3.2. Lesion-based prediction of tactile object recognition performance
Displayed inFig. 2A is the lesion overlap map. As per our
se-lection criteria, the centre of this map lay within the central sulcus (MNI coordinates x/y/z: 32/-25/47 mm); the lesions of 25 of the 35 patients intersected at this location. The functional meta-analysis map relevant to our prediction model is
dis-played inFig. 2B. The map shows eight clusters representing
brain areas whose activation is uniquely associated with tactile fMRI tasks. These clusters include a number of fronto-parietal regions, including notably the postcentral gyrus, pa-rietal operculum and intrapapa-rietal sulcus, known from previ-ous lesion studies to be involved in tactile perception
(Bohlhalter et al., 2002; H€omke et al., 2009).
The results of applying MVPA to predict TOR performance scores from the tactile-constrained patient binary lesion maps
are presented inFigs. 3A and 4B.Fig. 3A shows a multivariate
map of voxel-wise model weights. This map codes for the contribution of each voxel to model prediction: higher values indicate greater contribution and lower values less. The
nor-malised sums of weights per voxel cluster (NWCluster) allow for
regional inference. Using LOSO cross-validation to derive the map and testing its significance using permutation tests, we found that MVPA achieved satisfactory prediction of individ-ual TOR performance scores.
Fig. 4 summarises model statistics. Fig. 4A displays the
significant correlation between predicted and actual scores;
the Pearson's coefficient, r ¼ .79, corresponds to a
permutation-based significance level, p < .01, and a
para-metric level,p<1.4104. Relying on no-overlap in predicted
TOR performance we found an accuracy of 93% in discrimi-nating between the N/R and PI group. Correction for disparity of group sizes yielded a balanced accuracy of 94% (95%
con-fidence interval, CI 78e96%) (Brodersen, Ong, Stephan, &
Buhmann, 2010). Due to the divergent degree of recovery in the PR group accuracy in distinguishing N/R and combined PR and PI groups decreased to 89% (balanced accuracy 86%, CI
84e88%). Most importantly,Fig. 4B shows the comparison of
the MVPA model prediction with the permuted distribution; the mean squared error of 133.69 corresponded to a
permutation-based significance ofp<.001.Fig. 4C presents
analysis of the model prediction errors, clearly showing the discrimination of N/R patients from the PR or PI patients. One
N/R patient deviated by more than1.96 standard deviations
(95% CI) from the mean difference and one PI patient by more
thanþ1.96 standard deviations; these deviations are
consis-tent with a normal distribution of prediction errors. The clinical subgroup classification is also satisfactory. The sub-jects with initial hand plegia as detailed in Results have been predicted correctly with respect to task performance over nine months. As a quality control check for cross-validation sta-tistics, we repeated the GPR analysis with 7-fold cross-validation. This procedure resulted in more conservative,
but still highly significant predictions, i. e. Pearson's r¼.64
and MSE¼70.75, implying a permutation-based significance
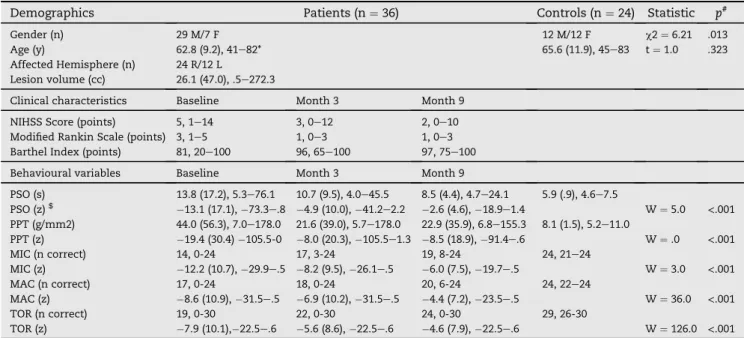
Table 1eDemographic, clinical and behavioural characteristics of stroke patients and controls.
Demographics Patients (n¼36) Controls (n¼24) Statistic p#
Gender (n) 29 M/7 F 12 M/12 F c2¼6.21 .013
Age (y) 62.8 (9.2), 41e82* 65.6 (11.9), 45e83 t¼1.0 .323 Affected Hemisphere (n) 24 R/12 L
Lesion volume (cc) 26.1 (47.0), .5e272.3
Clinical characteristics Baseline Month 3 Month 9 NIHSS Score (points) 5, 1e14 3, 0e12 2, 0e10 Modified Rankin Scale (points) 3, 1e5 1, 0e3 1, 0e3 Barthel Index (points) 81, 20e100 96, 65e100 97, 75e100 Behavioural variables Baseline Month 3 Month 9
PSO (s) 13.8 (17.2), 5.3e76.1 10.7 (9.5), 4.0e45.5 8.5 (4.4), 4.7e24.1 5.9 (.9), 4.6e7.5 PSO (z)$ 13.1 (17.1),73.3e.8 4.9 (10.0),41.2e2.2 2.6 (4.6),18.9e1.4 W¼5.0 <.001 PPT (g/mm2) 44.0 (56.3), 7.0e178.0 21.6 (39.0), 5.7e178.0 22.9 (35.9), 6.8e155.3 8.1 (1.5), 5.2e11.0 PPT (z) 19.4 (30.4)105.5-0 8.0 (20.3),105.5e1.3 8.5 (18.9),91.4e.6 W¼.0 <.001 MIC (n correct) 14, 0-24 17, 3-24 19, 8-24 24, 21e24 MIC (z) 12.2 (10.7),29.9e.5 8.2 (9.5),26.1e.5 6.0 (7.5),19.7e.5 W¼3.0 <.001 MAC (n correct) 17, 0-24 18, 0-24 20, 6-24 24, 22e24 MAC (z) 8.6 (10.9),31.5e.5 6.9 (10.2),31.5e.5 4.4 (7.2),23.5e.5 W¼36.0 <.001 TOR (n correct) 19, 0-30 22, 0-30 24, 0-30 29, 26-30 TOR (z) 7.9 (10.1),22.5e.6 5.6 (8.6),22.5e.6 4.6 (7.9),22.5e.6 W¼126.0 <.001 (*) Numbers are given as mean (standard deviation), range. Standard deviation is omitted for counts, ordinal data and percentages. (#)p-values are two-tailed. ($) z-scores were calculated using the mean and standard deviation of healthy control data. Negative values indicate greater impairment. Wilcoxon signed-rank tests were computed to test for significant baseline impairment (significance threshold with Bonferroni correction: .05/5¼.01). Abbreviations: NIHSS, National Institutes of Health Stroke Scale, M/F, male/female; R/L, right/left; cc, cubic centimeters; y, years; PSO, picking small objects; PPT, pressure perception threshold; MIC, microgeometrical discrimination; MAC, macrogeometrical discrimination; t, T-Statistic; TOR, tactile object recognition; W, Wilcoxon signed rank statistic.
Fig. 1eTactile object recognition performance after stroke: trajectories and subgroups. (A) Raw longitudinal TOR data for
each patient, in number of correctly identified objects (n) over time (d, days post-stroke). Transparent dots and lines represent individual TOR trajectories, and each column summarises one trajectory subgroup, defined empirically by TOR trajectory endpoints at 9 months: normal and recovered patients (N/R, blue) who either retain, or return to, TOR performance
levels at and above the lower cut-off of healthy controls (n¼26 objects); patients with partial recovery (PR, green), who
recognise n¼16e25 objects at the end of the study, and persistently impaired (PI, red) patients, who show either no or only
marginal improvement (n<16). Solid lanes and transparent areas indicate subgroup means and 95% bootstrapped
confidence intervals (CI, 200 samples), respectively. (B) TOR performance scores (expression coefficients) for each patient subgroup. Scores were derived from a principal component analysis (PCA) across all longitudinal data presented in A. TOR
performance scores thus encapsulate each patient's trajectory after stroke (higher scores indicate more favourable
trajectories). Solid dots correspond to subgroup means, black bars represent the associated 95% bootstrapped CI, as above. (C) Probabilistic model calculating intersubject Mahalonobis distance related to TOR performance in the continuum of all individuals, with no overlap between N/R, PR and PI groups. The latter has been confirmed by the calculation of Gaussian mixture distribution of the three groups in one dimension. The outlier marked by a star (*) has been allocated to the N/R group according to complete recovery in the follow-up, however, the overlap with the PR group reflects the dynamics in this subject with large recovery from initially low TOR performance (see 1A). The inset image shows the distribution of TOR performance of the N/R group, not discernible in the overview.
Because data had been acquired at different magnetic field strengths (see Materials and Methods), we performed control analyses to rule out a confounding influence of scanner type on results. We visually confirmed that lesion maps from pa-tients scanned at 1.5 T overlapped with the chronic infarct core seen on follow-up 3T MRIs. Furthermore, we assessed whether lesion volumes were systematically different
be-tween patients scanned at 1.5T (n¼9) and 3 T (n¼26), but this
was not the case (U¼89.5,p¼.25). Also, a MVPA classification
model failed to identify scanner type from lesion maps alone
(AUC¼.5, balanced accuracy 53.4%,p¼.29).
3.3. Regional contributions to prediction and relationship to poor TOR performance
We found six significant areas out of the eight meta-analytic clusters, covering the lesion overall map (Fig. 2A). These six areas, explaining 62.9% of classifier weights in the meta-analytic network, contributed essentially to prediction of
TOR performance. Sorted inTable 3by their relative
contri-bution and localised according to the probabilistic cytoarchi-tectonical Ju¨lich atlas (Eickhoff et al., 2005), these include: inferior posterior functional sub-area described recently by Clos, Amunts, Laird, Fox, and Eickhoff (2013), Area 4a of pre-central gyrus, Area 1 of postpre-central gyrus, area hIP2 of intra-parietal sulcus, area PFt of supramarginal gyrus and Area OP1 (SII) of parietal operculum.
Areas 1 of postcentral gyrus, PFt of supramarginal gyrus and OP1 (SII) of parietal operculum were more severely lesioned in PI than in N/R group according to the Liebermeister measure (Fig. 3B) and yielded peak effects above the
signifi-cance threshold for each cluster (z¼3.98,p<.05, permutation
test). These areas matched exactly those of the MVPA pre-diction map labelled supramarginal gyrus and parietal oper-culum. The PR group was not distinguished from the other
groups by a specifically circumscribed lesion load (seeTable 3).
Controlling for lesion overlays showed uniform patterns within the groups defined according to TOR classification. These showed an extending common lesion in the infrapar-ietal lobule for subjects of the PI group, common lesional areas in pre- and postcentral gyrus of similar size for those of the PI
Table 2eMultiple linear regression of tactile object recognition performance scores against age, lesion volume, stroke
severity, and behavioural variables.
Variables B 95% CI SE b t p Lower Upper Intercept 20.56 14.97 26.15 2.73 7.54 <.001 Age 1.93 .65 4.51 1.26 .10 1.53 .137 Lesion volume .42 1.58 .75 .57 -.06 .73 .470 NIHSS 1.33 2.71 .04 .67 -.19 1.99 .057 PSO .33 .55 .10 .11 .15 2.98 .006 MAC .84 .50 1.18 .16 -.03 5.12 <.001 MIC .04 .45 .37 .20 .59 .19 .849 PPT .07 .04 .18 .05 -.24 1.38 .180
Model fit: R2¼.89, adj. R2¼.86, F
(8,28)¼32.1,p<.001.; Abbreviations: B indicates regression coefficient; CI, confidence interval; SE, standard error;
b, standardised regression coefficient; t, t-statistic (¼b/SE), NIHSS, National Institutes of Health Stroke Scale; PSO, picking small objects; MAC/ MIC, macro/microgeometrical discrimination; PPT, pressure perception threshold.
Fig. 2eBaseline structural and meta-analytic functional
data. (A) Lesion overlap map of all patients, as
reconstructed from baseline diffusion-weighted imaging scans. The lesion core (25/35 patients) was located in the depth of the central sulcus (*). (B) Meta-analytic map of 45 functional magnetic resonance imaging (fMRI) studies on tactile performance in healthy volunteers. This map represents voxel-wise z-scores corresponding to the
probability that the termtactileis used in a study, given the
presence of an fMRI activation at that location; it displays voxels that are selectively related to tactile tasks (corrected for multiple comparisons using a FDR criterion of .01). On the right hemisphere, we identified eight clusters that were affected by stroke lesions it at least 3 subjects (i.e., ifg, opercular part of the inferior frontal gyrus; ins, insula; prcg, precentral gyrus; pocg, postcentral gyrus; spl, superior parietal lobule; ips, intraparietal sulcus; smg, anterior division of supramarginal gyrus; pop, parietal operculum). Maps in both panels are displayed on the ICBM 152 brain template in MNI space (neurological convention, left hemisphere is on the left of the image; x/y/z coordinates are in mm).
or PR groups, and small and varying lesions with minimal overlap for those of the N/R group.
4.
Discussion
In this prospective study we show that MVPA of DWI lesion maps can be used to accurately predict long-term recovery of TOR after stroke. The subjects of the study cohort were impaired to varying degree in exploring objects by grasping finger movements. In a multivariate regression analysis of TOR recovery related to baseline data, only the ability to discriminate differences in the long axis of a cube, a macro-geometrical object property, and the PSO subtest of JTT proved to be of significance. In the long-term performance comparing the respective trajectories, the sensory recovery leading to TOR and precision grip of fingers occurred independently, as has been shown recently (Abela et al., 2014), and are thus complementary. From the point of view or behavioural
specificity (Mauguiere& Isnard, 1995), we describe here
re-covery of tactile object recognition depending specifically on shape perception extracted by adapted tactile finger trajec-tories. Pseudo tactile agnosias were only transient at baseline in a few cases and are unlikely in the definite classification since all subjects with disturbed TOR recovered early and sufficiently, regarding PSO, to explore actively real objects as verified by close monitoring.
The strength of our study is twofold: First, MVPA, as applied here, overcomes the shortcomings of univariate voxel-based lesion symptom mapping, which carries the risk of localisation bias due to overlap of brain vasculature and
functional architecture (Mah, Husain, Rees,&Nachev, 2014;
Nachev, 2015). Second, incorporating meta-analytic fMRI maps focuses the analysis on regions that are functionally relevant to the behaviour of interest and aids the identifica-tion and ranking of critical regions, providing a fine-grained representation of neuroanatomical predictors. This is essen-tial for functional interpretation since MVPA is based purely on the statistical characteristics of the data; agnostic to the functional organisation of the brain, it can implicate regions irrelevant to specific brain function (Smith, Clithero, Rorden, &Karnath, 2013).
Our results are consistent with previous findings. Behav-ioural studies show that initial conditions, e.g., baseline post-stroke motor performance and anatomical lesion load, are strongly related to later gains (Byblow, Stinear, Barber, Petoe, &Ackerley, 2015; Marshall et al., 2009; Winters, van Wegen,
Daffertshofer, & Kwakkel, 2015). Moreover, recent
cross-sectional and longitudinal neuroimaging studies have shown that recovery of motor function can be predicted from structural and functional data acquired in the same patients
(Rehme et al., 2015; Rondina, Filippone, Girolami, & Ward,
2016). The MVPA prediction map described above deter-mined four key cortical areas predicting TOR performance over nine months. The areas are related specifically to the
patients'behavioural pattern of disturbed object exploration
by active finger movements: somatosensory cortex (subarea 1), opercular parietal cortex (Area OP1), inferior parietal lobule (subarea PFt) and inferior frontal gyrus (pars opercularis, BA 44). A subgroup of the cohort with persistent and severe aperceptive tactile agnosia exhibited structural lesions in subareas 1 of the postcentral gyrus, OP1 and PFt. Specific prediction maps such as ours could elucidate syndromes re-ported until now only in small, but highly detailed cross-sectional case studies (Bohlhalter et al., 2002; Crutch,
Warren, Harding, & Warrington, 2005; Nakamura, Endo,
Sumida,&Hasegawa, 1998; Platz, 1996; Reed&Caselli, 1994;
Reed, Caselli, & Farah, 1996; Saetti, De Renzi, & Comper,
1999; Veronelli, Ginex, Dinacci, Cappa,&Corbo, 2014).
4.1. Key neuroanatomical areas predicting TOR performance related to a-priori weighted MVPA lesion map
4.1.1. Somatosensory cortex I (subarea 1)
The postcentral gyrus is prominent in this study, especially subarea 1 with a high weight in the MVPA map. Based on neurophysiological studies in monkeys, the hierarchical structure of sensory information processing in a sequential network became evident many years ago. In the classical
Fig. 3eVoxel-wise statistical results of lesion-based
prediction and subgroup comparisons. (A) Results of lesion-based prediction of TOR performance scores using multi-voxel pattern analysis (MVPA). Colour encodes the weight of each voxel in the predictive model, i.e., its contribution to overall model performance. All voxels together represent a multivariate predictive map which was generated by averaging over 35 leave-one-out cross-validation folds. (B) Results of standard (mass-univariate) voxel-based lesion-symptom mapping. This analysis compared Persistently Impaired (PI) patients against those in the Normal/Recovered (N/R) subgroup using the Liebermeister test for binary data. Colour encodes voxels in which PI patients had a statistically significant higher lesion frequency compared to N/R patients. Only voxels that survived a 5% permutation-based threshold are displayed. Abbreviations: ifg, opercular part of the inferior frontal gyrus; ins, insula; pr/pocg, pre-postcentral gyrus; spl, superior parietal lobule; ips, intraparietal sulcus; smg, anterior division of supramarginal gyrus; pop, parietal operculum.
view, the structure is characterized by increased complexity along the sagittal axis showing the single digits functional surface in BA 3a and 3b and multi-digit surface in BA 1 and 2 (Hsiao, 2008). Area 3 b may represent an area of intermediate processing information related to texture and shape by facil-itating some features and inhibiting others (DiCarlo, Johnson, &Hsiao, 1998; Thakur, Bastian,&Hsiao, 2008). The complexity of receptor fields increases as features provided by afferents to subareas 3a and 3b, e.g., proprioceptive and cutaneous inputs, converge in areas 1 and 2. The receptor fields in area 1 are more complex, responding with sensitivity to motion and a higher degree of feature selectivity (Hsiao, 2008). Area 2 fa-cilitates 3D object recognition in combining cutaneous and
proprioceptive inputs (Randolph& Semmes, 1974). In
com-parison to the N/R group incomplete recovery in the PR group has been determined exclusively by the involvement of the postcentral gyrus.
4.1.2. Opercular parietal cortex (Area OP1)
The opercular parietal cortex of non-human primates is con-nected extensively with the SI cortex. Ablation experiments on rhesus monkeys verified this pathway, providing evidence for parallel modality-specific information transfer from
sub-areas 3a, 3b, 1 and 2 (Pons, Garraghty,&Mishkin, 1992; Pons,
Garraghtyt, & Mishkin, 1988). This pathway is likely to be
irrelevant to our study, since microgeometrical aspects reflecting texture proved not to be of significance.
In humans, Eickhoff et al. (2006) applied quantitative cytoarchitectonic analysis to segregate the opercular parietal
cortex into four cytoarchitectonic sub-areas (termed OP 1e4).
These coincide with functional inhomogeneities of the area observed in neuroimaging studies. Relying on somatotopic arrangements and responses in fMRI experiments they could classify the subareas OP 1, 3 and 4 as human homologues of known primate areas SII, PV and CS (Eickhoff, Grefkes, Zilles, &Fink, 2007). Statistical analysis of anatomical and functional connectivity showed significantly more connections of OP1
with the anterior inferior parietal cortex and thalamus (VPL/ VPI nuclei), while OP4 connected preferentially with the postcentral gyrus, primary motor cortex, premotor cortex and
Broca's area (Eickhoff et al., 2010). This is consistent with their
functional profiles. OP1 seems to support complex informa-tion processing demanded during tactile working memory, stimulus discrimination, and perceptual learning, while OP 4 plays a role mainly in basal sensorimotor integration pro-cesses (Eickhoff et al., 2010). Aspects of this functionality are
attention to sensory stimuli (Burton, Sinclair,&McLaren, 2008;
Burton, Sinclair, Wingert,&Dierker, 2008), cognition during
active toucheexemplified by grasping during object
manipu-lation (FBinkofski et al., 1999; Reed et al., 2005), and
recogni-tion of complex structuresenecessitating the coding of tactile
and proprioceptive sensations (Fitzgerald, Lane, Thakur, &
Hsiao, 2004).
4.1.3. Inferior parietal lobule (subarea PFt)
Based on cytoarchitectonic analysis, the human inferior pa-rietal lobule (IPL) can be subdivided into seven compartments, five of which represent a rostral group comprising subareas PFt, PFop, PFm, PF, PFcm (Caspers et al., 2006, 2008). In the macaque monkey, the rostral regions were shown to be con-nected reciprocally with premotor, somatosensory and
supe-rior parietal areas (Gregoriou, Borra, Matelli,&Luppino, 2006).
This distributed network substantiated the significance of the rostral IPL in macaques as an important relay node in the
sensorimotor control of ongoing actions (Rizzolatti&Fogassi,
2014).Fogassi& Luppino (2005)found at this site a neuron
population selectively active during grasping. The reciprocal linkage between frontal motor areas and the posterior parietal cortex (PPC) suggests combined processing of action and
perception (Fogassi & Luppino, 2005; Rizzolatti & Fogassi,
2014). In humans, Caspers et al. found using probabilistic tractography distinct patterns of connectivity among five sub-areas in the posterior parietal cortex (Caspers et al., 2011). Specifically, this study discovered substantial connectivity of
Fig. 4eAssessment of prediction model performance. (A) Correlation between actual and predicted TOR performance
scores. Each dot represents one patient. The black line indicates a perfect correlation. R denotes the Pearson's correlation
coefficient andPthe corresponding two-tailedp-value. (B) Permutation test result: actual model mean-squared error (MSE,
black line) and associated highly significantp-value, derived from an empirical null-distribution (grey histogram). (C)
Prediction errors, i.e., the difference of predicted minus actual scores for each patient colour coded as inFig. 1. The solid line
indicates the mean of the differences, the dashed lines the upper and lower approximate 95% confidence interval (CI) in standard deviation (SD) units. The distribution of difference values shows a clear separation between Normal/Recovered patients (blue), and those that recovered partially (green), or were persistently impaired (red). The differences of all except 2 cases fall within the 95% CI.
PFt with parietal opercular cortex OP1, the I motor and
so-matosensory cortex, ips (hIP 1e3) and the superior parietal
lobule. Based on meta-analysis, Caspers et al. delineated a network consisting of areas BA 44 and hIP 3/PFt and activated during both observation and imitation. The authors concluded that these regions represent human homologues of the ma-caque ventral premotor area F5 and rostral inferior parietal
areas PFG and PF (Fogassi&Luppino, 2005), which are
func-tionally related to a mirror neuron network (Kelly et al., 2010).
4.1.4. Inferior frontal gyrus (pars opercularis, BA 44)
A critical area with respect to TOR performance is the part of BA 44 that overlaps with the posterior inferior sub-area of the inferior frontal gyrus (pars opercularis) described recently by Clos et al (2013). Multiple studies have confirmed the impor-tance of this sub-area during the observation and perfor-mance of skilled motor tasks. In fMRI experiments, observation and imitation of actions as well as imagination or observation of motion were accompanied by involvement of
the dorsal and inferior part of Broca's area (FBinkofski et al.,
2000; FerdinandBinkofski&Buccino, 2004). A study of
hand-motor deficit compensation revealed local grey matter vol-ume increase precisely in this subarea (Abela et al., 2015). In-creases of rCBF in PET and BOLD activity in fMRI within the opercular part of right inferior frontal gyrus have been found by Seitz and Roland during learning of motor finger sequences
(Seitz&Roland, 1992). In another fMRI study, Toni et al. found
increased activity in the opercular part of the right inferior frontal gyrus in a contrast comparing a visual motor learning task with a spatial visual-motor control task (Toni, Ramnani,
Josephs, Ashburner, & Passingham, 2001). Ehrsson et al.
described bilateral activations in the inferior part of precentral
gyrus and ventral premotor cortex/Broca's area in tasks
requiring precision grip (Ehrsson, Fagergren, & Forssberg,
2001). Smaller grip forces elicited stronger activations, most likely because manipulation of small and delicate objects
re-quires better control of precision grip (Westling&Johansson,
1984). Therefore, the sub-area of BA44 described by Clos
et al. (2013) appears crucial in learning and adapting hand
actions to specific needs.
4.2. The perspective of neuronal networks and recovery A number of fMRI studies confirms the importance of the tactile network nodes we identified above. Bodegard et al. found that tasks requiring passive and active tactile discrim-ination evoked BOLD responses in a hierarchical fashion: areas 3b and 1 of the primary somatosensory cortex were activated by all types of stimuli, area 2 by shape stimuli, and the supramarginal gyrus and intraparietal sulcus (ips) by
shape discrimination (Bodega˚rd, Geyer, Grefkes, Zilles, &
Roland, 2001). Recognition and discrimination of non-real objects activated a dorsal somatosensory pathway that included prefrontal and premotor areas and intraparietal
sulcus (Reed, Shoham,&Halgren, 2004; Stoeckel et al., 2003;
Van De Winckel et al., 2012). A TOR study combining the grasping of objects together with stroking of their texture, revealed a bilateral pattern involving the postcentral gyrus/IPL and SI/SII as well as left inferior frontal gyrus (BA 44) (Reed et al., 2004). Contrasting TOR with the direct localisation of
Table 3 e Sta tistics of clus ters provi ded by MVPA map guided by me ta-an alytic fMRI da ta. Region label Reg ion w eight s deri ved from MVPA (NW Cluster ) * Compa rison of PI vs N/ R group (peak z-sco re) Reg ion size (vox els) Ce ntre of Gravity Cytoar chitectonic Area $ Fun ctional A re a Ove rlap (%) # P(ob s)/p(exp) þ xy z prcg 21.1 e 202 41 14 60 not applicable Dorsal premotor cortex ee ins 16.0 e 69 38 2 2 not applicable Insula ee ifg 15.4 e 55 59 11 23 BA 44 Inf. post. segment of BA 44 84.5 1.86 pocg 12.5 e 14 34 31 71 Area 4a Primary motor cortex 41.1 1.05 spl 10.9 e 33 36 43 64 Area 1 Primary sensory cortex 59.1 1.46 ips 9.8 4.1 68 40 41 44 Area hIP2 Intraparietal sulcus 26.7 1.21 smg 8.4 4.8 248 52 24 57 Area 1 Primary sensory cortex 48.4 1.43 Area PFt Ant. inferior parietal lobule 20.1 1.02 pop 5.9 2.1 417 55 19 19 Area OP1/SII Parietal operculum 41.4 1.23 Abbreviations: ifg, opercular part of the inferior frontal gyrus; ins, insula; prcg, precentral gyrus; pocg, postcentral gyrus; spl, superior pari etal lobule; ips, intraparietal sulcus; smg, anterior division of supramarginal gyrus; pop, parietal operculum. x/y/z, coordinates in MNI space (mm). N/R, normal and recovered patients. PI, persistently impaired patients. (*) Lesion-based prediction model: NW Cluster ,normalised sum of prediction model weights for cluster of interest ( ¼ sum of all absolute weights across all voxels in each cluster divided by cluster size in voxels). ( ) Liebermeister test; any z-score above the overall map threshold of z ¼ 3.98 ( p < .05, permutation test). Dash indicates not available. (#) Percent of cluster covering area. Dash indicates not available.( þ ) Ratio between mean observed probability for an area within a cluster [p(obs)] versus overall mean probability of that same area across the brain as expected [p(exp)]. Va lues > 1 indicate central location of the cluster on that area, values < 1 peripheral location (omitted).($) According to a probabilistic Ju¨ lich atlas ( Eickhoff et al., 2005 ).
objects, Reed et al. found the same pattern described in their previous paper involving IPL and part of the ventrolateral, multimodal somatosensory pathway (Reed et al., 2005). Stilla et al. observed an overlapping activation zone within the anterior, posterior and ventral parts of the ips in a study of shape-selective regions and activation by haptic and visual
stimuli (Stilla&Sathian, 2008). These authors also observed
bilateral haemodynamic responses in area 3b after tactual exploration of both texture and shape but not beyond this site, suggesting divergent pathways for these object features in the further course. The pathway for shape appeared to traverse dorsally and converge to PPC, which is consistent with the network delineated in our study.
The distinct roles of the ventral pathway in the recognition of real objects, and of the dorsal pathway in identification of the spatial characteristics of non-real objects and motion,
have been termed as“what”and“where”dissociation (Reed
et al., 2005). This dissociation suggests an analogy to visual pathways in that the dorsal somatosensory pathway mediates spatial information related to objects and the ventral so-matosensory pathway that related to identification of real
objects (Goodale&Milner, 1992; Reed et al., 2005). This concept
has been modified byGoodale and Milner (1992)regarding the
visual pathways andDijkerman and De Haan (2007)regarding
the somatosensory pathways (Dijkerman and De Haan, 2007). In the case of somatosensory pathways transformation of spatial information into sensory guided actions has been more weighted, hence characterizing the dissociation rather
as“what (somatosensory processing for perceptual
recogni-tion)”versus “how” (somatosensory processing for action)”.
They stress two features of their concept: that external and internal stimuli should be differentiated, and that the two pathways are not independent. Multivariate regression anal-ysis in our patients cohort indicates deficient processing of external stimuli at an intermediate level, as shown by impaired perception of macrogeometrical aspects of a cuboid (MAC) concurrent with impairment of exploratory hand movements (PSO). On the anatomical level, our MVPA has demonstrated that recovery of TOR depends crucially on specific lesions of the IPL subarea PFt and parietal operculum, where complex somatosensory information finally converges
(Bonda, Petrides,&Evans, 1996). In the subjects with
persis-tent aperceptive tactile agnosia, sensory information output from these higher order cortices to the inferior frontal gyrus seems to be definitely disrupted, impairing the adoption of hand actions to specific needs.
The central role of IPL may explain its role both in TOR as well in maintaining adequate exploratory actions. Subjects like those of the PI subgroup, who exhibit disturbed higher order sensory function, are prone to forget repeatedly motor skill performance since they are unable to sense errors with their affected hand (Raghavan, 2016).
4.3. Limitations
The results discussed above must be viewed in the context of the following caveats.
First, our sample size is small compared to other studies using lesion-based MVPA to predict further behavioural course (Smith et al., 2013; Zhang, Kimberg, Coslett, Schwartz,
&Wang, 2014). Despite this limitation, the analyses yielded highly significant results, which have been validated by per-mutation tests, leading us to expect that the model general-ises to larger patient cohorts with first cortical ischemic stroke. The weight of additional subcortical lesions was not in the focus of the study. Second, the TOR task is an empirical test which has not been subjected to extensive psychometric
validation (Bohlhalter et al., 2002; H€omke et al., 2009). In
addition, due to the limited number of TOR stimuli presented,
a ceiling effect (cf. Fig. 1A) may have occurred, impeding
discrimination among strong TOR performances. However, recovery from poor performance is of more immediate inter-est regarding the return to daily activities of stroke patients.
Regarding neuroimaging data acquisition, the use of different scanner field strengths in the first 9 patients is certainly suboptimal, but our additional analyses failed to reveal any differences in lesion volumes between patients investigated at 1.5T and 3T, and a MVPA model was unable to differentiate between these groups. Also, we note that pre-dictions of these patients (Fig. 4C) were well within the range of the rest of the cohort. Therefore, it seems unlikely that our results were biased by data acquisition procedures. A further concern related to neuroimaging data analysis is the cancel-lation of possible lateralisation effects after flipping lesions to one hemisphere. However, results from previous studies suggest that TOR performance does not depend on which
hand is used (Craddock&Lawson, 2009; Yamashita, 2015). At
the stage of encoding and forming a definite percept, the contralateral hemisphere is mainly involved, with final bilat-eral activation of SII after unilatbilat-eral input (Chung et al., 2014; Taskin et al., 2006). In the later stage of associative TOR the issue of laterality is not definitely resolved (Nakamura et al., 1998). Moreover, we had no indication of associative tactile
agnosia in our subjects (cf.Platz, 1996; Veronelli et al., 2014).
5.
Conclusions
This study presents a novel model predicting the course from acute to early chronic stages of tactile object recognition after cortical sensorimotor stroke. Multiple regression analysis revealed essential subprocesses for object recognition, i.e., grasping, as determined by PSO, and perception of macro-geometrical object properties, as measured by MAC. In a combined approach using MVPA of lesion maps and meta-analysis to select relevant regions, we delineated a struc-tural neuronal network critical for recovery. Crucial regions for recovery versus persistent aperceptive tactile agnosia are
sub-areas PFt, OP1 and inferioreposterior compartment of
Broca's area; these reflect interdependence of exploratory
ac-tion and percepac-tion (Dijkerman and De Haan, 2007). The clinical implication of our study is that neuroimaging data acquired immediately after first stroke could facilitate indi-vidual forecasting of post-stroke recovery as related to specific activity limitations.
Declarations of interest
None.Open Practices
The study in this article earned Open Materials and Open Data badges for transparent practices. Materials and data for the
study are available athttps://osf.io/rgsbj/.
Acknowledgements
We are grateful to our patients and their caregivers for sup-porting our research. We thank our MR technicians for help with image acquisition and data management. This work was funded by Swiss National Science Foundation (SNSF) grants 3118018 and 160107.
Supplementary data
Supplementary data to this article can be found online at https://doi.org/10.1016/j.cortex.2019.01.018.
r e f e r e n c e s
Abela, E., Missimer, J., Wiest, R., Federspiel, A., Hess, C., Sturzenegger, M., et al. (2012). Lesions to primary sensory and posterior parietal cortices impair recovery from hand paresis
after stroke.PLos One, 7(2), e31275.https://doi.org/10.1371/
journal.pone.0031275.
Abela, E., Rummel, C., Hauf, M., Weisstanner, C., Schindler, K., & Wiest, R. (2014). Neuroimaging of epilepsy: Lesions, networks,
oscillations.Clinical Neuroradiology.https://doi.org/10.1007/
s00062-014-0284-8.
Abela, E., Seiler, A., Missimer, J. H., Federspiel, A., Hess, C. W., Sturzenegger, M., et al. (2015). Grey matter volumetric changes related to recovery from hand paresis after
cortical sensorimotor stroke.Brain Structure &Function,
220(5), 2533e2550.
https://doi.org/10.1007/s00429-014-0804-y.
Andersen, S. M., Rapcsak, S. Z., & Beeson, P. M. (2010). Cost function masking during normalization of brains with focal
lesions: still a necessity?Neuroimage, 53(1), 78e84.https://doi.
org/10.1016/j.neuroimage.2010.06.003.
Arlot, S., & Celisse, A. (2010). A survey of cross-validation
procedures for model selection.Statistics Surveys, 4, 40e79.
https://doi.org/10.1214/09-SS054.
Ashburner, J., & Friston, K. J. (2005). Unified segmentation. Neuroimage, 26(3), 839e851.https://doi.org/10.1016/j. neuroimage.2005.02.018.
Bates, E., Wilson, S. M., Saygin, A. P., Dick, F., Sereno, M. I., Knight, R. T., et al. (2003). Voxel-based lesion-symptom
mapping.Nature Neuroscience, 6, 448e450.https://doi.org/10.
1038/nn1050.
Binkofski, F., Amunts, K., Stephan, K. M., Posse, S., Schormann, T., Freund, H. J., et al. (2000). Broca's region subserves imagery of motion: a combined cytoarchitectonic
and fMRI study.Human Brain Mapping, 11(4), 273e285.
Binkofski, F., & Buccino, G. (2004). Motor functions of the Broca's
region.Brain and Language, 89(2), 362e369.https://doi.org/10.
1016/S0093-934X(03)00358-4.
Binkofski, F., Buccino, G., Posse, S., Seitz, R. J., Rizzolatti, G., & Freund, H. (1999). A fronto-parietal circuit for object
manipulation in man: evidence from an fMRI-study.The
European Journal of Neuroscience, 11(9), 3276e3286.
Bodega˚rd, A., Geyer, S., Grefkes, C., Zilles, K., & Roland, P. E. (2001). Hierarchical processing of tactile shape in the human brain. Neuron, 31(2), 317e328.https://doi.org/10.1016/S0896-6273(01) 00362-2.
Bohlhalter, S., Fretz, C., & Weder, B. (2002). Hierarchical versus parallel processing in tactile object recognition: a
behavioural-neuroanatomical study of aperceptive tactile agnosia.Brain A
Journal of Neurology, 125(Pt 11), 2537e2548.https://doi.org/10. 1093/brain/awf245.
Bonda, E., Petrides, M., & Evans, A. (1996). Neural systems for
tactual memories.Journal of Neurophysiology, 75(4), 1730e1737.
https://doi.org/10.1152/jn.1996.75.4.1730.
Brett, M. (2001). Spatial normalization of brain images with focal
lesions using cost function masking.Neuroimage, 14(2),
486e500.https://doi.org/10.1006/nimg.2001.0845.
Brodersen, K. H., Ong, C. S., Stephan, K. E., & Buhmann, J. M. (2010). The balanced accuracy and its posterior distribution. In ProceedingseInternational Conference on Pattern Recognition(pp.
3121e3124).https://doi.org/10.1109/ICPR.2010.764.
Brott, T., Adams, H. P., Olinger, C. P., Marler, J. R., Barsan, W. G., Biller, J., et al. (1989). Measurements of acute cerebral
infarction: a clinical examination scale.Stroke, 20(7), 864e870.
https://doi.org/10.1161/01.STR.20.7.864.
Burton, H., Sinclair, R. J., & McLaren, D. G. (2008). Cortical network
for vibrotactile attention: a fMRI study.Human Brain Mapping,
29(2), 207e221.https://doi.org/10.1002/hbm.20384.
Burton, H., Sinclair, R. J., Wingert, J. R., & Dierker, D. L. (2008). Multiple parietal operculum subdivisions in humans: tactile
activation maps.Somatosensory&Motor Research, 25(3),
149e162.https://doi.org/10.1080/08990220802249275.
Byblow, W. D., Stinear, C. M., Barber, P. A., Petoe, M. A., & Ackerley, S. J. (2015). Proportional recovery after stroke
depends on corticomotor integrity.Annals of Neurology.
Carey, L. M., & Matyas, T. A. (2011). Frequency of discriminative sensory loss in the hand after stroke in a rehabilitation
setting.Journal of Rehabilitation Medicine, 43(3), 257e263.https://
doi.org/10.2340/16501977-0662.
Caspers, S., Eickhoff, S. B., Geyer, S., Scheperjans, F., Mohlberg, H., Zilles, K., et al. (2008). The human inferior parietal lobule in
stereotaxic space.Brain Structure&Function, 212(6), 481e495.
https://doi.org/10.1007/s00429-008-0195-z.
Caspers, S., Eickhoff, S. B., Rick, T., von Kapri, A., Kuhlen, T., Huang, R., et al. (2011). Probabilistic fibre tract analysis of cytoarchitectonically defined human inferior parietal lobule
areas reveals similarities to macaques.Neuroimage, 58(2),
362e380.https://doi.org/10.1016/j.neuroimage.2011.06.027.
Caspers, S., Geyer, S., Schleicher, A., Mohlberg, H., Amunts, K., & Zilles, K. (2006). The human inferior parietal cortex:
Cytoarchitectonic parcellation and interindividual variability. Neuroimage, 33(2), 430e448.https://doi.org/10.1016/j.
neuroimage.2006.06.054.
Chen, S. Y., & Winstein, C. J. (2009). A systematic review of voluntary arm recovery in hemiparetic stroke: Critical predictors for meaningful outcomes using the international
classification of functioning, disability, and health.Journal of
Neurologic Physical Therapy, 33(1), 2e13.https://doi.org/10.1097/ NPT.0b013e318198a010.
Chung, Y. G., Han, S. W., Kim, H.-S., Chung, S.-C., Park, J.-Y., Wallraven, C., et al. (2014). Intra-and inter-hemispheric effective connectivity in the human somatosensory cortex
during pressure stimulation.BMC Neuroscience, 15, 43.http://
www.biomedcentral.com/1471-2202/15/43.
Clos, M., Amunts, K., Laird, A. R., Fox, P. T., & Eickhoff, S. B. (2013).
Tackling the multifunctional nature of Broca's region