© The author(s).
This is an Open Access article distributed under the terms of the Creative Commons Attribution Share-Alike License (http://creative-commons.org/licenses/by-sa/4.0/).
Correspondence to: Dr. M. Cunha,Faculdade de Ciências da Universidade do Porto, Rua do Campo Alegre, Porto 4169-007, Portugal. E-mail: [email protected]
Estimation of grapevine predawn leaf water potential based on
hyperspectral
reflectance data in Douro wine region
R. Tosin1), 4), i. Pôças1), 2), 3), 4), i. Gonçalves5) and M. Cunha1), 2), 4) 1) Faculdade de Ciências da Universidade do Porto, Porto, Portugal
2) Geo-Space Sciences Research Centre, (CICGE), Porto, Portugal
3) Linking Landscape, Environment, Agriculture and Food (LEAF), Instituto Superior de Agronomia, Universidade de Lisboa, Lisboa,
Portugal
4) Institute for Systems and Computer Engineering, Technology and Science (INESC TEC), Campus da Faculdade de Engenharia da
Universidade do Porto, Porto, Portugal
5) Associação para o Desenvolvimento da Viticultura Duriense, Edifício Centro de Excelência da Vinha e do Vinho Parque de Ciência
e Tecnologia de Vila Real, Régia Douro Park, Portugal
Summary
Hyperspectral data collected through a handheld spectroradiometer (400-1010 nm) were tested for as-sessing the grapevine predawn leaf water potential (ѱpd) measured by a Scholander chamber in two test sites of Douro wine region. The study was implemented in 2017, being a year with very hot and dry summer, conditions prone to severe water shortage. Three grapevine culti-vars, 'Touriga Nacional', 'Touriga Franca' and 'Tinta Barroca' were sampled both in rainfed and irrigated vineyards, with a total of 325 plants assessed in four post-flowering dates. A large set of vegetation indices computed with the hyperspectral data and optimized for the ѱpd values, as well as structural variables, were used as predictors in the model. From a total of 631 possible predictors, four variables were selected based on a stepwise forward procedure and the Wald statistics: irrigation treatment, test site, Anthocyanin Reflectance Index Optimized (ARIopt_656,647) and Normalized Ratio
In-dex (NRI711,700). An ordinal logistic regression model was
calibrated using 70 % of the dataset randomly selected and the 30 of the remaining observations where used in model validation. The overall model accuracy obtained with the validation dataset was 73.2 %, with the class of
ѱpd corresponding to the high-water deficit presenting a positive prediction value of 79.3 %. The accuracy and operability of this predictive model indicates good per-spectives for its use in the monitoring of grapevine water status, and to support the irrigation tasks.
K e y w o r d s : handheld spectroradiometer; ordinal logis-tic regression; spectral vegetation indices; vineyard; grapevine water status.
Introduction
The severe hydric water stress affects the quantity and quality of wine grapes. Therefore, in regions where precipitation is scarce and concentrated in a short period
of the year, as in the Mediterranean regions, irrigation has been increasingly considered to regulate grapevine yield and quality (e.g. Chaves et al. 2010). An example of this
increasing irrigation trend can be observed in Douro wine region, a worldwide known wine region (Cunha and RiChTeR
2016). However, in the context of foreseen warming and dry climate scenarios and the increasing competition for water among different economic sectors, a correct irriga-tion management is essential to ensure the sustainability of Mediterranean irrigated areas (Cunha and RiChTeR 2016,
MedRano et al. 2015).
The grapevine irrigation scheduling is often based on ecophysiological measures of vine water status. One of the most widely used measures is referred to the
predawn leaf water potential (ѱpd) using a Scholander
chamber (sCholandeRet al. 1965). Despite being a very
reliable technique (MouTinho-PeReiRa et al. 2007, MeRli
et al. 2015, alves et al. 2012), it is a destructive method
(RodRíGuez-PéRez et al. 2018) and depends on the
collec-tion of a large set of measurement points to get a very ac-curate assessment of the target area due to the variability in soil conditions (ouMaR and MuTanGa 2010). Thus, efforts
have been made to find alternative methods capable of pro
-viding accurate information about vine water status, while being easy-to use and non-destructive.
The contribution of remote sensing to improve water
management has increased in recent years. Spectral reflec
-tance obtained through proximity sensors (e.g. handheld spectroradiometers), cameras mounted on drones or sat-ellite imagery has been widely used to estimate and map crop biophysical parameters (zaRCo-Tejada et al. 2013,
BlaCkBuRn 2007), including for estimating and
monitor-ing water status in vineyards (Pôças et al. 2015 and 2017,
RodRíGuez-PéRez et al. 2018). Different zones of the
elec-tromagnetic spectrum have been studied for the monitor-ing of plant water status, includmonitor-ing near and mid infrared, which present wavelengths of strong water absorption of the radiation, and the shortwave infrared due to the rela-tion between canopy temperature and crop water status (BellveRT et al. 2014, CleveRs et al. 2010). Additionally,
acteristics (BlaCkBuRn 2007, jones and vauGhan 2010,
MaRioTTo et al. 2013). Nevertheless, the large amount of
data generated from hyperspectral sensors can result in re-dundancy of the information captured (BlaCkBuRn 2007,
Wu et al. 2008, CaiCedo et al. 2014, RiveRa et al. 2014,
FenG et al. 2017). Thus, the adequate data processing,
cop-ing with dimensionality issues, wavelengths selection and
modelling tools are required for its efficient use.
The hyperspectral reflectance data can be combined
into vegetation indices (VI) frequently at two or three
wavelengths, which can be specifically optimized for vines
water status, and thus only using a small portion of the spectrum (suáRez et al. 2008, zaRCo-Tejada et al. 2013,
Pôças et al. 2015). There is a large set of VI related to
structural, biochemical, and physiological parameters of the vegetation as reported in the literature (jones and
vauGhan 2010, RoBeRTs et al. 2012). The Normalized
Difference Vegetation Index (NDVI) (TuCkeR1979), the
Soil-Adjusted Vegetation Index (SAVI) (hueTe 1988) and
the Enhanced Vegetation Index (EVI) (hueTe et al. 1997)
are among the most frequently used VI, being particularly useful to assess parameters related to the vegetation status
and structure. Additionally, some VI have been specifical
-ly designed to estimate parameters, such as the leaf water content and Chlorophyll concentration. Examples of such indices include the Potential Water Index (PWI) (Peñue -las et al. 1997) and the Photochemical Reflectance Index
(PRI) (GaMon et al. 1992), respectively.
Recently, the techniques of machine learning have been used to cope with the high dimensionality of hyperspectral datasets. Several studies have applied non-parametric re-gression models to estimate the water status in grapevines, (Pôças et al. 2017, RodRíGuez-PéRez et al. 2018). The
ma-chine learning classification methods have also been ap
-plied to hyperspectral data for estimating biophysical and biochemical crop parameters (iM et al. 2009). One of such
classification methods is the ordinal logistic regression
(OLR), which is used to explain a ranking variable (haR -Rell 2015), and has been employed in many
environmen-tal studies (BRanT 1990, RuTheRFoRd et al. 2007, CoPPoCk
2011, noTaRio del Pino and Ruiz-GallaRdo 2015). The
OLR algorithm has been used for modelling the relation-ship between an ordinal response variable and one or sev-eral continuous independent variables, while considering the inherent ordering of the response variable, thus making full use of the ordinal information (kleinBauM and klein
data could be an alternative to estimate grapevine ѱpd,
re-sulting classes of water status. Thus, the main goal of this work is modelling the water status in grapevines through a
classification predictive regression model based on hyper
-spectral data. Specific goals include testing and validating
the model in two different zones of Douro Wine region and considering three cultivars growing under two irrigation regimes.
Material and Methods
S t u d y a r e a : This study was conducted in the Douro Wine Region, Northeast of Portugal (Fig. 1), where 45,613 ha of vineyards dominate the landscape and are es-tablished mainly over terraces and slopes with shale-de-rived soils (IVDP 2018). The Douro region is recognized
worldwide, both by its classification as UNESCO World
Heritage Cultural Landscape and by the exquisite quali-ty of the Porto wine here produced. The region is divid-ed into three sub-regions: Baixo Corgo (vineyard area of 14,582 ha), Cima Corgo (vineyard area of 20,969 ha), and Douro Superior (vineyard area of 10,175 ha), distributed from the western up to eastern part of the region (Fig. 1), all with rigorous climate conditions.
The Douro wine region is one of the most arid regions of Europe where a strong water stress occurs in summer as a consequence of the low soil water content, associated
Fig. 1: Location of the study area, identifying the test sites 1 and 2 in the Douro Wine Region, Northeast Portugal, and the respective sub-regions: Baixo Corgo, Cima Corgo and Douro Superior.
to the low annual rainfall and high gradients of the water vapour pressure between the leaves and the air (jones and
alves 2012, Alves et al. 2013, PRaTa-sena et al. 2018).
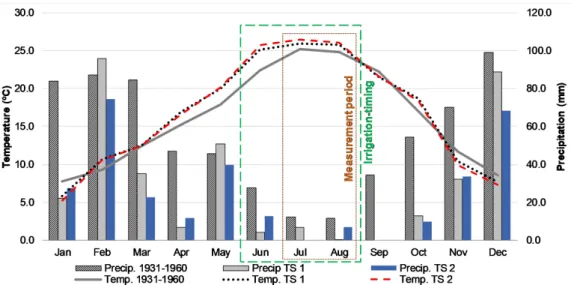
The region has a Mediterranean climate, with high average temperatures during the summer period, ranging between 22.4 °C in Baixo Corgo and 24.1 °C in Douro Superior and Cima Corgo (INMG 1991). In Baixo Corgo the annual precipitation is 856 mm, while in Cima Corgo it is 658 mm and in Douro Superior it is 539 m, with summer precipitation representing 10.3 %, 8.8 % and 7.4 % of the annual precipi-tation, respectively. A detailed characterization of the region and sub-region climate is presented by Pôças et al. (2017).
Fig. 2 compares the climate characterization of the Douro Wine Region in both test sites in the year 2017.
Tw o c o m m e r c i a l v i n e y a r d s w e r e c o n -s i d e r e d f o r t h e -s t u d y ( F i g . 1 ) : (i) Te-st -site 1 (TS1) – Quinta dos Aciprestes (wine company Real Com-panhia Velha) located in Cima Corgo sub-region (Latitude 41.21°N; Longitude 7.43°W; 145 m a.s.l.), and (ii) Test site 2 (TS2) – Quinta do Ataíde (wine company Symington), in Douro Superior (Latitude 41.25°N; Longitude 7.11°W; m a.s.l.).
In test site 1 the cultivars studied were: (i) Touriga Nacional (TN) – two plots, with two replicate ar-eas, including three irrigation treatments: non-irrigated (TN_NI), irrigation treatment 1 (TN_IT1), and irrigation treatment 2 (TN_IT2), and (ii) Touriga Franca (TF) – a single plot and a single treatment (TF_IT). Three cultivars were studied in test site 2: (i) TN – two plots (TN1 and TN2) with two irrigation treatments: irrigated (TN1_IT, TN2_IT) and non-irrigated (TN1_NI, TN2_NI), (ii) TF – one plot with an irrigated treatment (TF_IT) and a non-ir-rigated treatment (TF_NI), and (iii) Tinta Barroca (TB) – one plot with an irrigated treatment (TB_IT).
The vines pruning system is Bilateral Royat in both test sites with planting spacing and vines maximum height respectively of 2.2 m ×1 m and 1.5 m in test site 1 and 2.1 m ×1.1 m and 1.8 m in test site 2.
The irrigation scheduling and the irrigation amounts were managed by each wine company, based on information
of ѱpd regular measurements and aiming to adjust for quality
criteria. Tab. 1 summarizes the irrigation dates and amounts in each test site.
In both test sites, the total irrigation amount in TN is greater than that applied in TF (up to 25 %). TB is the grape variety that received the highest amount of irrigation
(137.6 L∙plant-1).
G r o u n d m e a s u r e m e n t s : The study was
con-ducted in 2017 between post-flowering (end of June) and
the harvest (early September). During this period, the av-erage temperature was 24.6 °C in the test site 1 and 25 °C in the test site 2 and the precipitation in test site 1 was 11.2 mm while for test site 2 it was 19.6 mm (Fig. 2). The year 2017 was characterized by high temperatures and ex-tremely low precipitation during the summer period, forc-ing producers to pick earlier in both test sites.
Ground measurements of ѱpd data and spectral reflec
-tance data were collected at four dates in both test sites:
test site 1 (July 5, July 20, August 3, and August 31) and test site 2 (July 4, July 21, August 4, and September 1). A
minimum of six plants per irrigation treatment and plot were sampled in each test site for ground measurements, resulting in 325 observations (grapevines), 135 in test site 1 and in test site 2 (Tab. 2).
A pressure chamber (sCholandeR et al. 1965)
(PMS600, Albany, OR, USA) was used for measuring
the ѱpd. The measurements were done at predawn, around
6 AM, on one leaf from each vine per block sampled. A large variability both between test sites and within each
test site was recorded in the ѱpd dataset.
The hyperspectral data were measured using a portable spectroradiometer (Handheld 2, ASD Instruments,
Boul-der, CO, USA), with a field-of-view of 25°, a spectral reso -lution < 3 nm at 700 nm, a wavelength accuracy of ± 1 nm. During measurements, the equipment was maintained approximately 30 cm above canopy, which gives a sam-pling footprint of approximately 13.3 cm. Measurements over a white spectralon panel, also called white reference standard, were done prior to measurements over the
tar-get plants aiming to calibrate the level of reflectance. The
Fig. 2: Temperature and precipitation characterization of the Douro wine region for the reference period 1931-1960 (FeRReiRa 1965) and comparison with the temperature and precipitation records in 2017 during study period in the test site 1 (TS 1) and test site 2 (TS 2).
spectroradiometer records reflectance signatures between
325 nm and 1075 nm of the electromagnetic spectrum (cor-responding to visible and NIR), with a wavelength interval
of 1 nm. However, only reflectance data between 400 nm
to 1010 nm were considered due to noise occurrence out-side of these spectral limits. The measurements were done in cloud free days between 11 h to 14 h (local time) to minimize changes in solar zenith angle. Ten repetitions per plant were collected and later averaged to minimize the ef-fect of noise.
Data processing: The hyperspectral and ѱpd data were analyzed by each plant (Tab. 2). A one-way analy-sis of variance (ANOVA) with p-value associated to the
Fischer test was performed to compare the means of ѱpd
between the test sites regarding the 12 irrigation treatment and the cultivars. These statistical analysis were computed in R (R CoRe TeaM 2017) combined with car package (Fox
and WeisBeRG 2011) and agricolae package (MendiBuRu
2017). The hyperspectral data were processed into spectral
vegetation indices (VI). A large 222 diversity of VI, includ-ing two-band indices, represented by simple ratios (SR), normalized indices (NRI) and also other formulations
de-fined in the literature were computed (Tab. 3).
Following previous studies (Pôças et al. 2015 and
2017), a band selection procedure for the two-band vege-tation indices optimization was considered, testing all two-band combinations (for simple ratio indices and normalized indices) within the spectral range of 400 nm and 1010 nm. Additionally, all combinations of bands for smaller sub re-gions of the spectrum (spectral domains) were tested for the normalized difference vegetation index formulation.
In this last case, all combination of bands within specific
combinations of the spectral domains of blue, green, red, red edge, and near infrared were tested. The range consid-ered for each spectral domain was 451-520 nm for blue, 521-570 nm, for green, 571-700 nm for red, 681-740 nm for red edge, and 701-950 nm for near infrared (NIR). A
linear fitting function was used for the band selection opti
-21 July 16 16 16 15 July 16 16 16 19.2 28 July 16 16 16 25 July 16 16 16 16 4 August 0 16 0 31 July 16 16 16 16 11 August 12 12 12 7 August 16 16 16 16 14 August 16 16 13 16 22 August 13 13 Total 92 124 92 128 128 112 137.6
*Drip irrigation system with emitters discharge: Test site 1: 2 Lh-1; Test site 2: 1.6 Lh-1 with spacing between emitters of 1 m (test site 1) and 0.5 m (test site 2).
Ta b l e 2
Number of observations (gapevines) per test site, cultivar and irrigation conditions
Test site Cultivar Irrigated Non-irrigated Total
Test site 1 Touriga Nacional 64 31 95
Touriga Franca 40 0 40
Total Test site 1 104 31 135
Test site 2
Touriga Nacional 68 68 136
Touriga Franca 18 18 36
Tinta Barroca 18 0 18
Total Test site 2 104 86 190
mization, having the ѱpd as the dependent variable. A
cali-bration dataset, corresponding to 70 % of the total obser-vations, and a validation dataset, with the 30 % remaining observations, were used for assessing the best combination of bands. The bands selected for each VI corresponded to the best combinations obtained for both the calibration and validation datasets, expressed through the determination
coefficient (R2). A total of fifteen VI were selected follow
-ing the optimization procedure (Tab. 3).
The VI computation and bands optimization were performed in the HSDAR package (lehneRT et al. 2017),
implemented in software R (R CoRe TeaM 2017) and in
the spectral indices toolbox of Automated Radiative Trans-fer Models Operator (ARTMO) software (veRRelsT et al.
2011, RiveRa et al. 2014).
A time-dynamic variable based on the ѱpd (ѱpd_0) was
also used as predictor aimed at representing crop water
sta-tus dynamics in the post-flowering - harvest period. This
variable is aimed at minimizing the spurious downward
time trend inherent to both ѱpd and hyperspectral data. The
time trend effect was discussed by Pôças et al. (2017). This
ѱpd_0 was computed by integrating, in each measurement
date to be predicted, the information of previous ѱpd
meas-urements. The ѱpd_0 was defined for each measurement
point and measurement date as the ѱpd value corresponding
to the previous measurement. For the first measurement date (test site 2: July 4th; test site 1: July 5th), a presumed
value based on expert knowledge, was considered,
corre-sponding to 70 % of the ѱpd measured in each point.
M o d e l l i n g a p p r o a c h e s : In the modelling
approaches the ѱpd was used as response variable and
631 predictor candidates were considered. These potential predictors originated from both hyperspectral (626) and structural (5) data. The potential predictors relative to
hy-perspectral data were: i) spectral reflectance of 611 wave -lengths in the range between 400 nm and 1010 nm (wave-length interval of 1 nm), ii) 15 vegetation indices (Tab. 3). The potential predictors relative to structural parameters included: i) irrigation conditions (two levels: IT_I – irrigat-ed, IT_NI – non-irrigated), ii) cultivar (tree levels: TN, TF, and TB), iii) test site (two levels: TS_1 and TS_2), iv) the
time-dynamic predictor ѱpd_0 (three levels of the 15
classi-fication: ѱpd_0-1: low ѱpd_0-2: moderate, and ѱpd_0-3: high) and
v) the days after flowering (DAF).
To run the statistical model, the dataset was split into training data (70 % of random observations) and validation data (30 % of the remaining observations) (kuhn and john -son 2013). The training and validation datasets integrate
the pairs of concurrent measurements of the ѱpd and the
corresponding values of the predicting variables.
A stepwise regression procedure was used for selection within the initial 631 predictor candidates. Following this procedure, the predicting variable that most contributes to the model improvement in each step, compared to the model in the previous step, is chosen based on the lowest value of Akaike information criterion (AIC; akaike(1974). The AIC
is based on the maximum likelihood function allowing the comparison of models with different number of predictors. Ta b l e 3
Vegetation indices formulations with bands (b) optimized according to grapevines predawn leaf water potential
Vegetation indexa Formulation Original reference
2-bands - Normalized indices
NRI515,523 NRI515,523 = (b523 - b515)/(b523 + b515) NRI520,701 NRI520,701 = (b520 - b701)/(b520 + b701) NRI520,615 NRI520,615 = (b520 - b615)/(b520 + b615) NRI520,694 NRI520,694 = (b520 - b694)/(b520 + b694) NRI524,615 NRI524,615 = (b524 - b615)/(b524 + b615) NRI535,701 NRI535,701 = (b535 - b701)/(b535 + b701) NRI529,694 NRI529,694 = (b529 - b700)/(b529 + b700) NRI711,700 NRI711,700 = (b711 - b700)/(b711 + b700) NRI718,723 NRI718,723 = (b718 - b723)/(b718 + b723)
-2-bands - Simple ratios
SR718,723a SR718,723 = b723/b718
WI900,970 WI900,970 = b900/b970 (Peñuelas et al. 1993)
2-bands - Other formulations
ARIopt_665,647 ARIopt_665,647 = (1/b647) - (1/b665) (GiTelson et al. 2001b)
MSAVIopt_701,587 MSAVIopt_701,587 = [2 * b701 + 1 - [(2 * b701 + 1)² - 8(b701 - b587)]½]/2 (Qi et al. 1994)
OSAVIopt_745,700 OSAVIopt_745,700 = (b745 - b700)/(b745 + b700 + 0.16 (Rondeaux et al. 1996)
RDVIopt_745,700 RDVIopt_745,700 = (b745 - b700)/[(b745 + b700)½] (Roujean and BReon 1995) a NRI - Normalized Reflectance Index; SR – simple ratio; WI – Water Index; ARI
opt – Anthocyanin Reflectance Index optimized;
OSAVIopt - Optimal Soil Adjusted Vegetation Index optimized; MSAVIopt - Modified Soil Adjusted Vegetation Index optimized;
ter deficit): 0 MPa > ѱpd ≥ -0.25 MPa; (ii) class 2 (moderate
water deficit): -0.25 MPa > ѱpd ≥ -0.5 MPa; and (iii) class
3 (high water deficit): 291 -0.5 MPa > ѱpd.
P r e d i c t i v e m o d e l l i n g a p p l i e d i n c l a s -s i f i c a t i o n m o d e : The OLR was selected for
mod-eling the ordinal response variables ѱpd. The OLR allows
building a predictive model on a probabilistic basis. In the
present study, the OLR was fitted through a proportion -al-odds logit model (MCCullaGh 1980), which is widely
applied to represent ordinal responses (veRWaeRen et al.
2012). The proportional-odds logit model defines a prob
-ability density function over the class labels for a given feature vector x, which belongs to the input space X (MC
-CullaGh 1980, veRWaeRen et al. 2012).
The "polr" function from the MASS library in software R (venaBles and RiPley 2002) was used for (haRRell jR.
2018) applying this methodological approach.
M o d e l p e r f o r m a n c e a s s e s s m e n t : The re-sidual deviance (MCCullaGh, 1980, kleinBauM and klein
2010) and the Akaike information criterion (AIC; akaike
(1974)) were computed for assessing the model's quality. The AIC statistics allows comparing between model's per-formance, with lower AIC values corresponding to simpler models with fewer predictors (kuhn and johnson 2013).
The Wald statistic was also used to assess the significance
of the predictors selected for the model (PenG et al. 2002).
The odds ratios were calculated to analyse the weight of each predictor. Additionally, the positive prediction value by class and the overall model accuracy were computed and organized in a confusion matrix. The overall model accuracy corresponds to the agreement between
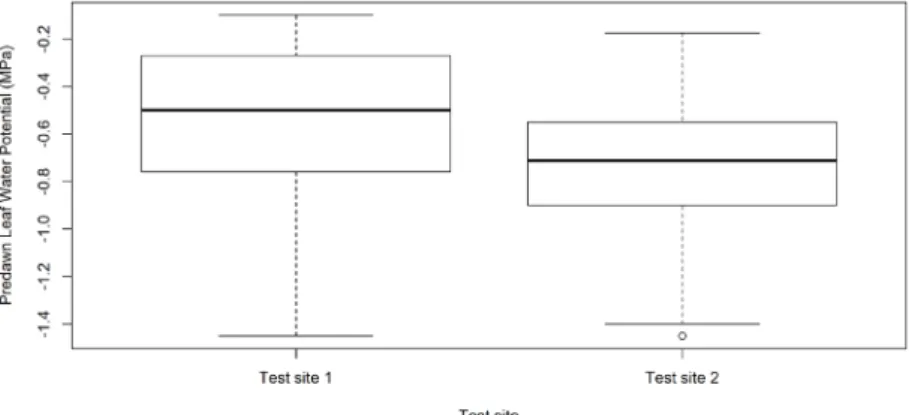
predict-a n d w i t h i n t e s t s i t e s : The impact of irrigation
treatments and cultivars in each test site on the ѱpd is
pre-sented in Tab. 4. The test site 2 consistently prepre-sented
lower ѱpd values (Fig. 3), evidencing that vineyards in this
test site of sub-region of Douro Superior (Fig. 2) are more
likely to present higher water deficit conditions. In both
test sites, the irrigation and the grapes varieties presented a
significant impact on ѱpd values.
The TF present higher ѱpd in both test sites, even with
lower irrigation amounts (Tab. 1), may be an indicator of
better water use efficiency due to the lower amount of wa
-ter required and higher ѱpd when compared to TN (Tab. 4).
Nevertheless, it is important to highlight that only in the
test site 1 the ѱpd values are statically different (TN).
Al-though the TB recorded higher mean values of ѱpd, this
cannot reflect a better water use efficiency of this grape
variety, since it also received higher amounts of irrigation
(Tab. 1). The maintenance of this high ѱpd in TB,
associat-ed to high irrigation amounts, can be justifiassociat-ed by the high
sensitivity (yield and quality) of this grape variety to water stress (IVV 2011).
M o d e l p e r f o r m a n c e : Tab. 5 presents the
statistics of the coefficients included in predictive mod -els (model 1 and model 2) developed for assessing the
grapevine ѱpd. From the potential predictors initially
con-sidered, only nine were selected through the stepwise procedure: i) two qualitative variables: Irrigation treat-ment (IT) and Test site (TS); ii) four vegetation indices: ARIopt_656,647, NRI745,700, NRI711,700, WI900,970; iii) days after
flowering (DAF); iv) ѱpd_0, and iv) one wavelength: R996.
Then, the OLR model was applied to these nine
ing variables selected by the stepwise method (model 1, Tab. 5). This model 1 presented an AIC value of 270.88.
The results of the individual regression coefficients
of Wald statistics for each predictor, showed that only the variables "IT_NI", "TS_2", "ARIopt_656,647" and "NRI711,700"
were statistically significant (p < 0.01) (Tab. 5). These re-sults suggest that an alternative model (model 2)
includ-ing these four statistically significant predictors could be
applied to the data. The model 2, combining the four se-lected variables, presents AIC of 262.06. This AIC value improved when compared to model 1. For the model 2
the results of the odds ratio indicate that the non-irrigation
treatment (IT_NI) has the biggest influence on the assign
-ment of the class, followed by the ARIopt_656,647, test site 2
(TS_2), and the NRI711,700. The model 2 overall accuracy,
assessed through the validation dataset, was 73.2 % and the positive prediction value per class was 33.3 %, 44.4 % and 79.3 %, respectively, for the classes low (1), moderate
(2), and high (3) water deficit (Tab. 6). The variability in
the prediction value per class is likely due to the impact of the imbalanced data set used for validation (10, 20 and 67 cases in class 1, class 2, and class 3, respectively). Ta b l e 4
Statistical results of mean predawn leaf water potential (ѱpd, MPa) for the different irrigation regimes and grape varieties in the test sites studied
Structural
parameters N. Obs Location (ψ
pd, MPa) Mean ψpd
(MPa) ANOVAp-value* Test site 1 Test site 2
Irrigation - No irrigation 117 -0.822 -0.976 -0.936 0.002 - Irrigation 208 -0.434 -0.559 -0.496 0.000 ANOVA F* 0.000 0.000 0.000 ---Grape cultivars T. Nacional (TN) 231 -0.566b -0.781b -0.692b 0.000 T. Franca (TF) 76 -0.423a -0.726b -0.566ab 0.000 T. Barroca (TB) 18 na -0.541a -0.541a ANOVA F* 0.012 0.003 0.003 ---Overall mean 325 -0.523 -0.748 -0.655 0.000
ANOVA p-value*: is the p-value associated to Fischer's test performed in the ANOVA; means with p-value less than 0.05 is considered statistically different. Within columns,
means followed by the same letter are not significantly different according to Duncan's test (α < 5 %). na: no data available
Ta b l e 5
Coefficients determinate by Wald Statistics and odd ratios of the predictors in the models developed to estimated ѱpd
Predictors Model 1 Model 2
Coefficient Odd ratio Coefficient Odd ratio IT_NI 3.06 x 10*** 1.95 x 10¹³*** 1.89 x 10*** 1.68 x 10⁸*** Test site_2 1.10*** 3.01*** 1.35*** 3.86*** ARIopt_656,647 1.92*** 6.83*** 1.77*** 5.86*** DAF -4 x 10⁻³ 9.96 x 10⁻¹ - -NRI745,700 -1.43 2.40 x 10⁻¹ - -NRI711,700 -2.28 x 10*** 0.00*** -1.80 x 10*** 0.00*** WI900,970 9.13 9.26 x 10³ - -ψpd_0 3.63 x 10⁻¹ 1.44 - -R996 -2.05 1.28*10-1 -
-IT_NI: non-irrigation treatment; TS_2: Test site 2; ARIopt_656,647: Anthocyanin Reflectance Index opti
-mized; DAF: days after flowering; NRI: Normalized reflectance index; WI: Water index; R996: reflec
-tance at wavelength 966 nm. ѱpd_0: time-dynamic variable based on ѱpd of the previous measurements;
Discussion
The hyperspectral based predictive model developed
is a valuable tool for predicting grapevine ѱpd because of
the integration of variables relative to agronomic practic-es (Irrigation Treatment, IT) and ecological conditions of grape-growth (Test Site, TS), as well as proxies of biophys-ical features (expressed by the optimized vegetation indi-ces ARIopt_656,647 and NRI711,700).
The selection of a predictor related with the IT is consistent with the differences between irrigation
treat-ment (Tab. 4) resulting in differences on the reflectance
of irrigated and non-irrigated plants (Pôças et al. 2017).
The selection of a variable relative to the test site is like-ly associated to the different climatic conditions between sub-regions of Douro wine region (Fig. 2), with the test site 2 located in a usually warmer and drier zone than test
site 1. Both irrigation and test site variables will influence the canopy reflectance, that will be expressed in the ѱpd
values and consequently in the VI calculated. The selec-tion of these 22 variables allows to see how different the canopy behaves under different climatic conditions and the band combination expressed in the VI works as proxy of the vegetation status.
Following the VI optimization for bands selection, the proposed ARIopt_656,647 integrates wavelengths of the red
spectral domain, close to the red edge domain, instead of the wavelengths of the original formulation in the green and the red edge domains (GiTelson et al. 2001a). The
wavelengths of ARIopt_656,647 are close to those studied by
BlaCkBuRn (2010), the wavelengths of 680 nm and 635 nm,
which are related to the chlorophyll a and chlorophyll b concentrations, respectively. Also, sonoBe et al. (2018)
studied similar bands range to estimate the chlorophyll content. The content of chlorophylls a and b is a potential indicator of vegetation stress (zaRCo-Tejada et al. 2002,
Wu et al. 2008), which includes water stress. As discussed
by these authors, several physiological perturbations in the light-dependent reactions of photosynthesis that occur in plants under stress can be related with changes in chloro-phylls a and b, and assessed through differences in spectral
reflectance. The NRI711,700 combines wavelengths of red
et al. (2017), who reported that stomata conductance (a water status 23 indicator) can be related to spectral bands close to those selected in our study for the optimized VI. Additionally, those authors reported that stomata conduct-ance is strongly related to indicators of chlorophyll content. Although a good accuracy of prediction (73.2 %) was obtained, the model was able to better classify the classes of higher stress, which may be due to the imbalanced num-ber of observations of each class in the data set. As dis-cussed by BRodeRsen et al. (2010), an imbalanced data set
may lead to misleading conclusions about the performance
of a classification predictive model when using an average
accuracy measure.
The analysis of the positive prediction frequency per class, shows a good performance (79.27 % of cases
correct-ly classified) for the class of high-water deficit (class 3; ѱpd
< -0.5 MPa). In Mediterranean regions, where the
grape-vine is frequently conducted under deficit irrigation strate -gies the irrigation schedule often starts when plants are
un-der ѱpd values below -0.5 MPa (van leeuWen et al. 2009,
loPes et al. 2011). Therefore, the good results obtained for
this specific class of ѱpd are particularly interesting to
sup-port grapevine deficit irrigation strategies, aimed at pro -moting grape quality, which are generally implemented in the most technologically advanced grape-growers.
Conclusion
In this study we presented how the ѱpd in vineyards
of Douro wine region could be predicted by a classifica
-tion model based on hyperspectral reflectance data. A large
set of climatic, environmental, and agronomic conditions were sampled to test model's accuracy and robustness. The developed predictive model presented an overall accuracy of 73.2 %. The variables selected provide information of plant physiology relevant for the prediction of the water status in grapevines. Nevertheless, the modelling could be improved if a higher number of samples were assessed in
the field to avoid problems related to imbalanced observa
-tions in the classes.
The use of the classification model to estimate ѱpd
brings a potential application to support irrigation decision in viticulture. Usually, the operational decisions about the
vine's irrigation scheduling are done for ѱpd values
associ-> ѱpd > -0.25 MPa; moderate water deficit, -0.25 MPa > ѱpd > -0.50 MPa; high water deficit, <-0.50 MPa.
ated to the class 3 of this study, where the model obtained good performance. Therefore, the results of the proposed model have potential to be used in support to irrigation
tasks. Moreover, the use of classes of ѱpd instead of
contin-uous values provides easier-to-use information for farmers. The accuracy and operability of this predictive model jus-tify its use to support decision-making processes related to improvement of water productivity in vineyards. This work analyses data obtained on the ground level, while these
results are the first step towards applications using other
sensors mounted on aerial platforms (e.g. drones or satel-lites). This is in line with the high number of forthcoming hyperspectral sensors mounted in aerial platforms, which will allow for the generation of hyperspectral time-series, giving access to spatial and temporal dynamics of crop bi-ophysical parameters. Thus, the results presented in this work can be used to support the development of new tech-nologies based on hyperspectral data for vineyards water status monitoring and mapping.
Acknowledgements
i. Pôças acknowledges the Post-Doctoral grant of the project ENGAGE-SKA POCI-01-0145-FEDER-022217, co-funded by FEDER through COMPETE (POCI-01-0145-FEDER-022217). The authors also thank the wine company "Real Companhia Vel-ha" (and its Coordinator for Viticulture, R. soaRes) and the wine company "Symington Family Estates" (and its R&D Viticulture Manager, F. alves) for the facilities provided for fieldwork, as
well as the "Associação para o Desenvolvimento da Viticultura
Duriense" (ADVID) for funding part of the field-work missions.
This study was implemented under a cooperation protocol inte-grating Faculty of Sciences, University of Porto, ADVID, Real Companhia Velha, and Symington Family Estates.
References
akaike, h.; 1974: A new look at the statistical model identification. IEEE Transact. Autom. Contr.19,716-723.
alves, F.; CosTa, j.; CosTa, P.; CoRReia, C.; Gonçalves, B.; soaRes, R.;
MouTinho-PeReiRa, j.; 2012: Influence of climate and deficit irri -gation on grapevine physiology, yield and quality attributes, of the cv. Touriga Nacional at Douro Region, vol. 2, session 7-20. IXe
Congrès International des Terroirs Vitivinicoles, 25-29 June, 2012.
Dijon-Reims, France.
alves, F.; j, C.; CosTa, P.; CoRReia, C.; Gonçalves, B.; R, s.; MouTinho
PeReiRa, j.; 2013: Grapevine water stress management in Douro Re-gion: Long-term physiology, yield and quality studies in cv. Touriga Nacional. 18th Int. Symp. GiESCO 2013, Faculdade de Ciências, Universidade do Porto, Portugal.
BellveRT, j.; zaRCo-Tejada, P. j.; GiRona, j.; FeReRes, e.; 2014: Map-ping crop water stress index in a 'Pinot-noir' vineyard: comparing ground measurements with thermal remote sensing imagery from an unmanned aerial vehicle. Precis. Agric.15,361-376.
BlaCkBuRn, G. a.; 2007: Hyperspectral remote sensing of plant pigments.
J. Exp. Bot.58,855-867.
BlaCkBuRn, G. a.; 2010: Spectral indices for estimating photosynthetic
pigment concentrations: A test using senescent tree leaves. Int. J.
Remote Sens.19,657-675.
BRanT, R.; 1990: Assessing Proportionality in the proportional odds mod-el for ordinal logistic regression. Biometrics46,1171-1178.
BRodeRsen, k. h.; onG, C. s.; sTePhan, k. e.; BuhMann, j. M.; 2010: The balanced accuracy and its posterior distribution, 3121-3124. 20th Int. Conf. Pattern Recognition, 23-26 August 2010, Istanbul, Turkey.
BuRnhaM, k. P.; andeRson, d. R.; 2002: Information and likelihood the-ory: a basis for model selection and inference, 49-97. In: Model se-lection and multimodel inference: A practical information-theoretic approach,Springer, New York, USA.
CaiCedo, j. P. R.; veRRelsT, j.; Muñoz-MaRí, j.; MoReno, j.; CaMPs
-valls, G.; 2014: Toward a Semiautomatic Machine Learning
Re-trieval of Biophysical Parameters. IEEE J. Selec. Topics Appl. Earth
Observat. Remote Sens.7,1249-1259.
Chaves, M. M.; zaRRouk, o.; FRanCisCo, R.; CosTa, j. M.; sanTos, T.;
ReGalado, a. P.; RodRiGues, M. l.; loPes, C. M.; 2010: Grapevine
under deficit irrigation: hints from physiological and molecular data.
Ann. Bot.105,661-676.
CleveRs, j. G. P. W.; kooisTRa, l.; sChaePMan, M. e.; 2010: Estimating canopy water content using hyperspectral remote sensing data. Int.
J. Appl. Earth Observat. Geoinform.12,119-125.
CoPPoCk, d. l.; 2011: Ranching and multiyear droughts in Utah: Produc-tion impacts, risk percepProduc-tions, and changes in preparedness. Range-land Ecol. Manage.64,607-618.
Cunha, M.; RiChTeR, C.; 2016: The impact of climate change on the wine-grape vineyards of the Portuguese Douro region. Climat. Change
138,239-251.
de Bei, R.; Cozzolino, d.; sullivan, W.; CynkaR, W.; FuenTes, s.; daM -BeRGs, R.; PeCh, j.; TyeRMan, s.; 2011: Non-destructive measure-ment of grapevine water potential using near infrared spectroscopy.
Aust. J. Grape Wine Res. 17, 62-71.
deloiRe, a.; ojeda, h.; zeBiC, o.; BeRnaRd, n.; hunTeR, j. j.; CaRBon -neau, a.; 2005: Influence de l'état hydrique de la vigne sur le style de vin. Progr. Agric. Vitic. 122,455-462.
FanG, M.; ju, W.; zhan, W.; ChenG, T.; Qiu, F.; WanG, j.; 2017: A new spectral similarity water index 505 for the estimation of leaf water content from hyperspectral data of leaves. Remote Sens. Environ.
196,13-27.
FenG, s.; iToh, y.; PaRenTe, M.; duaRTe, M. F.; 2017: Hyperspectral band selection from statistical wavelet models. IEEE Transact. Geosci. Remote Sens.55, 2111-2123.
FeRReiRa, h. a.; 1965: Normais Climatológicas do Continente, Açores e Madeira Correspondentes a 1931-1960.Serviço Meteorológico Na-cional, Lisboa, Portugal.
Fox, j.; WeisBeRG, s.; 2011: An (R) Companion to Applied Regression. Sage Publ, Thousand Oaks (CA), USA.
GaMon, j. a.; Penuelas, j.; Field, C. B.; 1992: A narrow-waveband
spec-tral index that tracks diurnal changes in photosynthetic efficiency.
Remote Sens. Environ.41,35-44.
GiTelson, a. a.; MeRzlyak, M.; zuR, y.; sTaRk, R.; GRiTz, u.; 2001a: Non-destructive and remote sensing techniques for estimation of vegetation status, 205-210. Proc. 3rd Eur. Conf. Precision Agricul-ture, Montpelier, France. Grenier & Blackmore, ed.
GiTelson, a. a.; MeRzlyak, M. n.; Chivkunova, o. B.; 2001b: Optical properties and nondestructive estimation of anthocyanin content in plant leaves. Photochem. Photobiol.74,38-45.
haRRell, F. e.; 2015: Ordinal Logistic Regression. In: Regression mode-ling strategies. With applications to linear models, logistic and ordi-nal regression, and survival aordi-nalysis, 311-325. Springer Internation-al Publ., Cham, Switzerland.
haRRell jR, F. e.; 2018: rms: Regression Modeling Strategies. R Package Version 5,1-2.
hueTe, a. R.; 1988: A soil-adjusted vegetation index (SAVI). Remote Sens. Environ.25,295-309.
hueTe, a. R.; liu, h. Q.; BaTChily, k.; van leeuWen, W.; 1997: A com-parison of vegetation indices over a global set of TM images for EOS-MODIS. Remote Sens. Environ.59, 440-451.
iM, j.; jensen, j. R.; ColeMan, M.; nelson, e.; 2009: Hyperspectral re-mote sensing analysis of short 527 rotation woody crops grown with controlled nutrient and irrigation treatments. Geocarto Int.24, 293-312.
INMG; 1991: O Clima de Portugal. Fascículo XLIX. Normais Clima-tológicas da região de Trás-os-Montes e Alto Douro e Beira Interior Correspondentes a 1951-1980, INMG, Lisboa, Portugal.
IVDP; 2018: Instituto dos Vinhos do Douro e Porto, dados Estatísticos sobre a Produção de Vinho do Douro e Porto na Região Demarcada do Douro. Available online at http://www.ivdp.pt/statistics (accessed 27 May 2019).
IVV; 2011: Catálogo das Castas Para Vinho Cultivadas em Portugal. In-stituto da Vinha e do Vinho, Lisboa, Portugal.
loPes, C. M.; sanTos, T. P.; MonTeiRo, a.; RodRiGues, M. l.; CosTa, j.
M.; Chaves, M. M.; 2011: Combining cover cropping with deficit irrigation in a Mediterranean low vigor vineyard. Sci. Hortic.129, 603-612.
MaiMaiTiyiMinG, M.; GhulaM, a.; Bozzolo, a.; Wilkins, j. l.;
kWasnieWski, M. T.; 2017: Early detection of plant physiological
responses to different levels of water stress using reflectance spec -troscopy. Remote Sens, 9, 745.
MaRioTTo, i.; ThenkaBail, P. s.; hueTe, a.; sloneCkeR, e. T.; PlaTon -ov, a.; 2013: Hyperspectral versus multispectral crop-productivity modeling and type discrimination for the HyspIRI mission. Remote Sens. Environ.139,291-305.
MCCullaGh, P.; 1980: Regression models for ordinal data. Series B
(Methodological). J. Royal Statist. Soc.42,109-142.
MedRano, h.; ToMás, M.; MaRToRell, s.; esCalona, j. M.; Pou, a.;
FuenTes, s.; Flexas, j.; BoTa, j.; 2015: Improving water use effi -ciency of vineyards in semi-arid regions. A review. Agron. Sustain. Dev.35,499-517.
MendiBuRu, F. d.; 2017: agricolae: Statistical Procedures for Agricultur-al Research. R Package Version 1.2-3. (http://CRAN.R-project.org/ package=agricolae).
MeRli, M. C.; GaTTi, M.; GalBiGnani, M.; BeRnizzoni, F.; MaGnanini, e.;
Poni, s.; 2015: Comparison of whole-canopy water use efficiency and vine performance of cv. Sangiovese (Vitis vinifera L.) vines
sub-jected to a post-veraison water deficit. Sci. Hortic.185,113-120.
MouTinho-PeReiRa, j.; MaGalhães, n.; Gonçalves, B.; BaCelaR, e.; BRi -To, M.; CoRReia, C.; 2007: Gas exchange and water relations of three
Vitis vinifera L. cultivars growing under Mediterranean climate.
Photosynthetica45,202-207.
noTaRio del Pino, j. s.; Ruiz-GallaRdo, j. R.; 2015: Modelling post-fire soil erosion hazard using ordinal logistic regression: A case study in South-eastern Spain. Geomorphology232,117-124.
ouMaR, z.; MuTanGa, o.; 2010: Predicting plant water content in
Euca-lyptus grandis forest stands in KwaZulu-Natal, South Africa using
field spectra resampled to the Sumbandila Satellite Sensor. Int. J.
Appl. Earth Observat. Geoinform.12,158-164.
PenG, C. y. j.; lee, k. l.; inGeRsoll, G. M.; 2002: An introduction to
logistic regression analysis and reporting. J. Educ. Res. 96, 3-14.
Peñuelas, j.; Filella, i.; Biel, C.; seRRano, l.; savé, T.; 1993: The reflec
-tance at the 950-970 nm as an indicator of plant water status. I. J.
Remote Sens.14, 1887-1905.
Peñuelas, j.; Pinol, j.; oGaya, R.; Filella, i.; 1997: Estimation of plant
water concentration by the reflectance Water Index WI (R900/ R970). I. J. Remote Sens.18,2869-2875.
Pôças, i.; Gonçalves, j.; CosTa, P. M.; Gonçalves, i.; PeReiRa, l. s.;
Cunha, M.; 2017: Hyperspectral-based predictive modelling of
grapevine water status in the Portuguese Douro wine region. Int. J.
Appl. Earth Observat. Geoinform.58,177-190.
Pôças, i.; RodRiGues, a.; Gonçalves, s.; CosTa, P.; Gonçalves, i.; PeRei -Ra, l.; Cunha, M.; 2015: Predicting grapevine water status based
on hyperspectral reflectance vegetation indices. Remote Sens.7, 16460-16479.
Taylor & Francis Group, Boca Raton, USA.
RodRíGuez-PéRez, j. R.; oRdóñez, C.; González-FeRnández, a. B.; sanz-
aBlanedo, e.; valenCiano, j. B.; MaRCelo, v.; 2018: Leaf water
content estimation by functional linear regression of field spectros -copy data. Biosyst. Engin.165,36-46.
Rondeaux, G.; sTeven, M.; BaReT, F.; 1996: Optimization of soil adjusted vegetation indices. Remote Sens. Environ.55,95-107.
Roujean, J. L.; Breon, F. M.; 1995: Estimating PAR absorbed by vege
-tation from bidirectional reflectance measurements. Remote Sens.
Environ.51,375-384.
RuTheRFoRd, G. n.; Guisan, a.; ziMMeRMann, n. e.; 2007: Evaluating sampling strategies and logistic regression methods for modelling
complex land cover changes. J. Appl. Ecol.44,414-424.
sCholandeR, P. F.; BRadsTReeT, e. d.; heMMinGsen, e. a.; haMMel, h. T.; 1965: Sap Pressure in Vascular Plants. Negative hydrostatic pressure can be measured in plants.Science 148,339-346.
sonoBe, R.; sano, T.; hoRie, h.; 2018: Using spectral reflectance to es -timate leaf chlorophyll content of tea with shading treatments. Bio-syst. Engin.175,168-182.
suáRez, l.; zaRCo-Tejada, P. j.; sePulCRe-CanTó, G.; PéRez-PRieGo, o.;
MilleR, j. R.; jiMénez-Muñoz, j. C.; soBRino, j.; 2008: Assessing canopy PRI for water stress detection with diurnal airborne imagery. Remote Sens. Environ.112,560-575.
TuCkeR, C. j.; 1979: Red and photographic infrared linear combinations for monitoring vegetation. Remote Sens. Environ.8,127-150.
van leeuWen, C.; TReGoaT, o.; Choné, x.; Bois, B.; PeRneT, d.; Gaud -illèRe, j. P.; 2009: Vine water status is a key factor in grape ripening and vintage quality for red Bordeaux wine. How can it be assessed for vineyard management purposes? Oeno One 43, 798.
venaBles, W. n.; RiPley, B. d.; 2002: Modern Applied Statistics with S. 4th Ed.Springer, New York, USA.
veRRelsT, j.; RiveRa, j.; alonso, l.; MoReno, j.; 2011: ARTMO: An Automated Radiative Transfer Models Operator toolbox for auto-mated retrieval of biophysical parameters through model inversion. 7th EARSeL SIG-Imag. Spectrosc. Workshop, 11-13 April 2011, Ed-ingburgh, UK.
veRWaeRen, j.; WaeGeMan, W.; de BaeTs, B.; 2012: Learning partial ordi-nal class memberships with kernel-based proportioordi-nal odds models. Comput. Stat. Data Anal.56,928-942.
Wu, C.; niu, z.; TanG, Q.; huanG, W.; 2008: Estimating chlorophyll con-tent from hyperspectral vegetation indices: Modeling and validation. Agric. For. Meteorol.148,1230-1241.
zaRCo-Tejada, P. j.; González-duGo, v.; WilliaMs, l. e.; suáRez, l.;
BeRni, j. a. j.; GoldhaMeR, d.; FeReRes, e.; 2013: A PRI-based water stress index combining structural and chlorophyll effects: Assess-ment using diurnal narrow-band airborne imagery and the CWSI thermal index. Remote Sens. Environ.138,38-50.
zaRCo-Tejada, P. j.; MilleR, j. R.; MohaMMed, G. h.; noland, T. l.;
saMPson, P. h.; 2002: Vegetation stress detection through chlorophyll
+ estimation and fluorescence effects on hyperspectral imagery. J.
Environ. Qual.31, 1433-1441. Received December 5, 2018 Accepted October 18, 2019