ISSN: 2089-3272, DOI: 10.11591/ijeei.v4i4.232 265
Pixel Classification of SAR Ice Images Using
ANFIS-PSO Classifier
G.Vasumathi*, P.SubashiniDepartment of Computer Science, Avinashilingam University, Coimbatore, India e-mail: [email protected]
Abstract
Synthetic Aperture Radar (SAR) is playing a vital role in taking extremely high resolution radar images. It is greatly used to monitor the ice covered ocean regions. Sea monitoring is important for various purposes which includes global climate systems and ship navigation. Classification on the ice infested area gives important features which will be further useful for various monitoring process around the ice regions. Main objective of this paper is to classify the SAR ice image that helps in identifying the regions around the ice infested areas. In this paper three stages are considered in classification of SAR ice images. It starts with preprocessing in which the speckled SAR ice images are denoised using various speckle removal filters; comparison is made on all these filters to find the best filter in speckle removal. Second stage includes segmentation in which different regions are segmented using K-means and watershed segmentation algorithms; comparison is made between these two algorithms to find the best in segmenting SAR ice images. The last stage includes pixel based classification which identifies and classifies the segmented regions using various supervised learning classifiers. The algorithms includes Back propagation neural networks (BPN), Fuzzy Classifier, Adaptive Neuro Fuzzy Inference Classifier (ANFIS) classifier and proposed ANFIS with Particle Swarm Optimization (PSO) classifier; comparison is made on all these classifiers to propose which classifier is best suitable for classifying the SAR ice image. Various evaluation metrics are performed separately at all these three stages
Keywords: SAR, speckle noise, particle swarm optimization ice images
1. Introduction
SAR processing is widely used for various radar imagery applications. One of its main applications is monitoring sea ice. Sea ice monitoring has been the main mission objectives for satellite programs such as RADARSAT, European Remote Sensing satellite (ERS) and ENVISAT [1]. Since sea ice has an important role in the heat exchange between the ocean and the atmosphere, it has an impact on the water temperature, heat circulation and ecosystem in Polar Regions. Sea ice is a threat to the navigation and oil exploration, because it can make damage to ships and oil platforms in the sea [2]. Sea ice monitor is useful to know the regions around the ice infested area. It covered with many regions which include sea, vegetation, land etc. For route planning in ship navigation classification of sea ice is an important one.
In this paper pixel based classification is performed where three stages are considered in classifying SAR ice images. It includes Preprocessing, Segmentation and Classification. SAR images are affected by speckle noise thus preprocess stage attempts denoising of speckle noise. Various speckle filters from image processing and wavelet family types are compared in which Daubechies method in wavelet family gives better results in removing noise from SAR ice images. Segmentation process is done by comparing the K-means and Watershed algorithm in which K-means clustering algorithm gives best result in segmenting SAR ice images into various regions. Finally at the classification stage, pixel based classification on the SAR ice images is performed using various supervised learning classifiers such as Back Propagation Neural Network, Fuzzy Classifier, Adaptive Neuro Fuzzy Inference Classifier (ANFIS), and ANFIS with PSO (Particle Swarm Optimization). Experiments at various stages are conducted to obtain results.
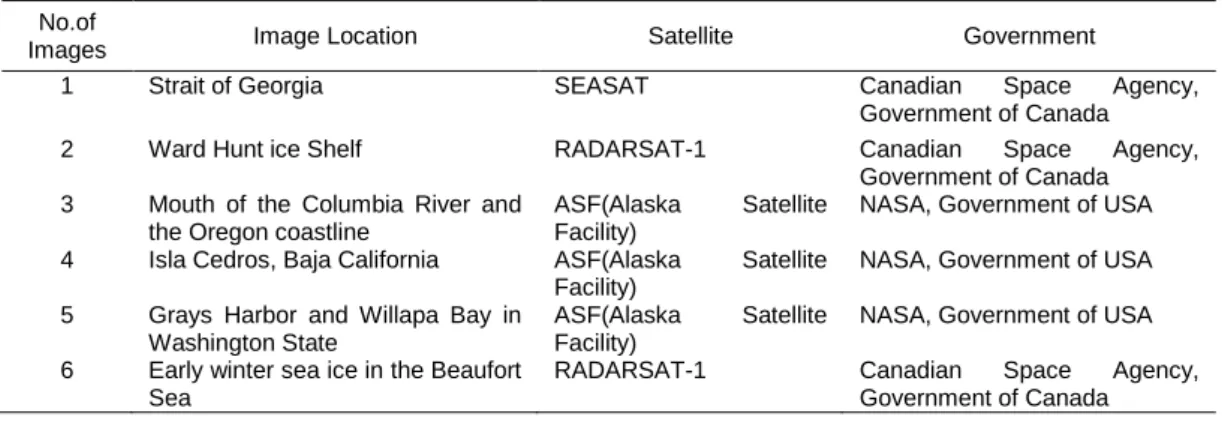
Table 1 show the origin of the dataset collected for the SAR ice classification.
Table 1. Origin of the Dataset No.of
Images Image Location Satellite Government
1 Strait of Georgia SEASAT Canadian Space Agency, Government of Canada 2 Ward Hunt ice Shelf RADARSAT-1 Canadian Space Agency,
Government of Canada 3 Mouth of the Columbia River and
the Oregon coastline
ASF(Alaska Satellite Facility)
NASA, Government of USA 4 Isla Cedros, Baja California ASF(Alaska Satellite
Facility)
NASA, Government of USA 5 Grays Harbor and Willapa Bay in
Washington State
ASF(Alaska Satellite Facility)
NASA, Government of USA 6 Early winter sea ice in the Beaufort
Sea
RADARSAT-1 Canadian Space Agency, Government of Canada
2. Methodology
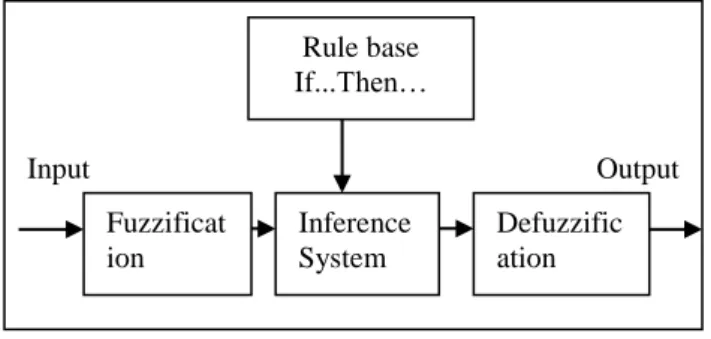
Methodology of SAR ice classification includes three stages. Figure 1 shows the overview of the methodology.
Figure 1. Overview of Methodology
2.1. Preprocessing
SAR images are affected by speckle noise due to the coherent nature of processing the signal [3]. Speckle noise is a coarse noise that is usually evident in and degrades the quality of the active radar and synthetic aperture radar (SAR) images. Speckle noise is commonly observed in radar sensing system and images, although it can be observed in most types of remotely sensed images utilizing coherent radiation. Speckle noise in radar data or images has multiplicative error and must be removed before the data can be used otherwise the noise is merged into and degrades the image quality [4].
In this paper the filters considered are standard speckle removing filters and filter method from wavelet family. This paper involves a comparative method which includes the
Input Image
Preprocessing
Segmentation
Classification
BPN Fuzzy ANFIS ANFIS + PSO
families in wavelet filter. Through the analysis of this comparison, Daubechies (dB) in wavelet family have proved the best in denoising the image when compared to all other filters. All the filter algorithms are evaluated using software tools called ENVI 4.7 and IDL 7.0. Table 2 shows the various filters taken for removing speckle noise in SAR ice images.
Table 2. Speckle Removal Filters S. NO Image processing Filters for
speckle control 1 Median Filter 2 Lee Filter
3 Enhanced Lee Filter 4 Frost Filter
5 Enhanced Frost Filter 6 Gamma Filter 7 Kaun Filter 8 Wavelet Family Symlet Coiflet Haar Daubechies
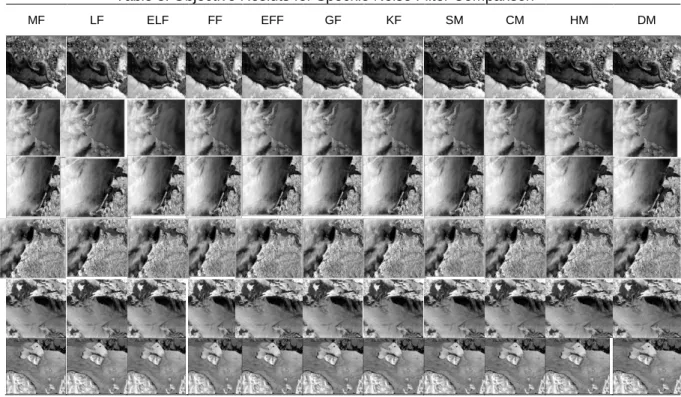
The objective results for the preprocessing are given in Table 3.
Table 3. Objective Resluts for Speckle Noise Filter Comparison
MF LF ELF FF EFF GF KF SM CM HM DM
MF- Median Filter, LF- Lee Filter, ELF- Enhanced Lee Filter. GF- Gamma Filter, KF- Kaun Filter, SM-Symlet Method, CM- Coiflet Method, HM- Haar Method, DM- Daubechies Method.
2.2. Segmentation
Image segmentation plays a very important role in the interpretation and understanding of SAR images. It has received an increasing amount of attention over the last few decades [5]. The segmentation procedure is to find the better positions of the shape points according to the appearance information [6]. The purpose of image segmentation is to cluster pixels of an image into image regions.
To classify the SAR ice image it is first needed to segment the regions, further these segmented regions are then identified in the stage of classification. In this paper segmentation of SAR ice images are done using two algorithms namely K-means algorithm and Watershed algorithm. These two algorithms are most promising in segmenting remote sensing images. Comparison of these two algorithms is performed and the result shows that K-means are more efficient in segmenting the images than watershed algorithm. Some of the drawbacks which are find out in Watershed algorithms during the experiment are:
a. It produces over segmentation. b. It is highly sensitive to the local minima
c. Considerable effort for defining the algorithms takes place for every marking of the watershed.
d. It exhibits the neck line on every region to estimate the number of objects in the given cluster. Errors are produced while exhibits the line on regions.
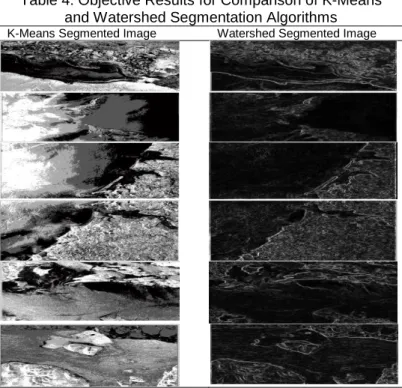
K-means clustering concept gives more advantages in grouping the pixels of an image to the corresponding classes. In this paper, for segmentation comparison is made in terms of segmentation metrics such as True Positive area ratio, False Positive area ratio and Similarity Index area ratio. The Objective result for comparative analysis between these two segmentation algorithms is given in the following Table 4.
Table 4. Objective Results for Comparison of K-Means and Watershed Segmentation Algorithms K-Means Segmented Image Watershed Segmented Image
2.3. Classification
Classification process is the main phase in performing SAR ice classification. Classification helps in finding out the features of the ice images such as water, vegetation, land and ice. In classification the segmented regions are identified and predicted. It groups the features based on supervised learning. This process automatically creates a classification model from a set of records called a training set. Once a model is induced, it can be used automatically to classify records belonging to a small set of class that is predefined called a testing set. Training refers to building a new model by using historical data and testing refers to trying out the model on new, previously unseen data to determine its accuracy [7].
In this paper four supervised learning algorithms are performed in the classification of SAR ice images. The comparative analysis between these four classifiers are performed to predict proposed classifier of ANFIS with PSO which gives best classification result in terms of Accuracy, Validity Index (VI), Network sensitivity, Time complexity and Error complexity. Following section gives brief explanation about the classifiers which are performed in this paper. 2.3.1. Back Propagation Neural Network
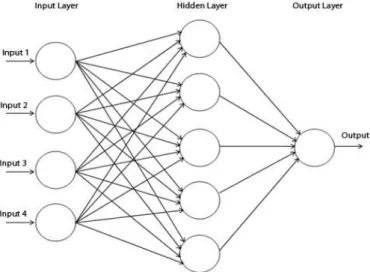
Back propagation neural classifier is the most simple and best classifier from neural network. It is widely applied for all the classification problems in image processing. The Network Structure of ANN should be simple and easy. There are basically two types of structures recurrent and non-recurrent structure. The Recurrent Structure is also known as Auto associative or Feedback Network and the Non Recurrent Structure is also known as Associative or feed forward Network [8]. Figure 2 shows the Architecture of the Back Propagation Network.
Figure 2. Back Propagation Neural Network Architecture
In this paper, 3-layer Back Propagation network classifier with one output unit is used for the classification purpose. The steps performed in both training and testing process includes,
Step 1: Defining a structure Corresponds to the input and output. Step 2: Image pixels are given to the network as an input. Step 3: Assigning the targets according to these inputs.
Step 4: According to the network parameters set, network simulation is performed and an input pixels are trained and store in a file.
Step 5: Target pixels are called and network simulation is presented to the system.
Step 6: During the testing process network simulation is used to compare the test image which is currently selected with the trained pixels.
Step 7: Pixels in a groups are identified if the selected image pixel values are matched with the existing trained pixels.
During the training process image pixels are given to the network as an input. Targets in which each pixel is stored are assigned. After the training process, classification process is preceded with testing the segmented image with the trained pixel. If training process is correctly done it identifies every region according to the pixel values of an image. The Back Propagation Classifier gives a correct classification rate of 77.14% on the test set images. The experimental results for BPN classifier are given in Table 7 to Table 13. Below are some limitations of BPN classifier, they are,
a. It creates the structure for every incoming input. It does not adjust the incoming inputs with existing structure.
b. Larger number of structure gives complexity in structure. Understanding the concepts will be tough because of its complexity.
c. Errors are increased if the structures are getting increased. d. Training the pixels takes more time.
e. Parameters need to be assigned to the network to train. Setting the parameter rate is the biggest deal.
2.3.2. Fuzzy Classifier
To overcome the disadvantages in the BPN classifier and to give a highest accuracy in SAR ice classification Fuzzy classifier is considered. Over the past few decades, fuzzy logic has been used in a wide range of problem domains. Although the fuzzy logic is relatively young theory, the areas of applications are very wide: process control, management and decision making, operations research, economies and, for this paper the most important, pattern recognition and classification. The natural description of problems, in linguistic terms, rather than in terms of relationships between precise numerical values is the major advantage of this theory [9]. There are numerous advantages are noticed in fuzzy classifier during the experiment, those are,
a. Fuzzy classifier does not create a new structure for its every incoming input. It adjusts the previous structure according to the incoming inputs.
b. The complexity is very less compare to the BPN. c. Training taken lesser time compare to BPN.
Fuzzy Inference System diagram is presented in Figure 2.2.
Figure 3. Fuzzy Inferenc System
Fuzzy algorithm steps for SAR ice classification are summarized as follows. a. Step 1: Defining the input is the first step. Here the inputs are the pixel values.
b. Step 2: The rules with IF, THEN condition are defined in this step. These rules are defined logically to the system in which it can be easily find out the need of the user. c. Step 3: Third step is defining the membership function that gives the representation to
input. Membership function allocated in this paper is the targets in which the pixels should be stored.
d. Step 4: Finally during the testing process original segmented images are compared with the rules which are given to the fuzzy system. At the classification stage features are extracted and represented with annotations.
Input Output Fuzzificat ion Defuzzific ation Inference System Rule base If...Then…
SAR ice classification using fuzzy classifier makes use of the rules and produces the result accordingly. Training the fuzzy classifier make use of the pixel values of six images. Testing process uses k-means segmented images. Defining a rule gives a better definition for the need of classification. Thus it provides efficient classification which leads to better accuracy than BPN classifier. Fuzzy classifier for SAR ice gives the accuracy rate of 86.6%. Experimental results of fuzzy classifier are given in the Table 7 to Table 13. Fuzzy classifier has limitation and it is listed below.
a. Defining the rules in linguistic manner is the only problem in fuzzy classifier. b. Wrong rules can lead to wrong classification.
2.3.3. Adaptive Neuro Fuzzy Inference Classifier (ANFIS)
ANFIS classifier combines both BPN and Fuzzy classifiers advantages. It overcomes the limitations and which gives the better accuracy in classifying SAR ice than other two algorithms discussed above. The combination of fuzzy logic with the design of neural network led to the creation of Neuro- Fuzzy systems which has benefit of the feed forward calculation of the output and back propagation learning capability from the neural networks. Because of crisp consequent functions, ANFIS uses a simple form of scaling implicitly. The ANFIS composes the ability of neural network and fuzzy system [10].
There are some numerous advantages found in ANFIS classifier they are,
a. Finding of membership function and appropriate rules in one system can leads to minimize the error.
b. BPN can introduce the learning to the fuzzy system which leads to the efficient classification.
c. When combining these methods fuzzy system will set a rule for its every input vectors which is then used to calculate the output value.
d.
Designing a way such that fuzzy system will gets the learning ability of neural network and optimizes its parameters.
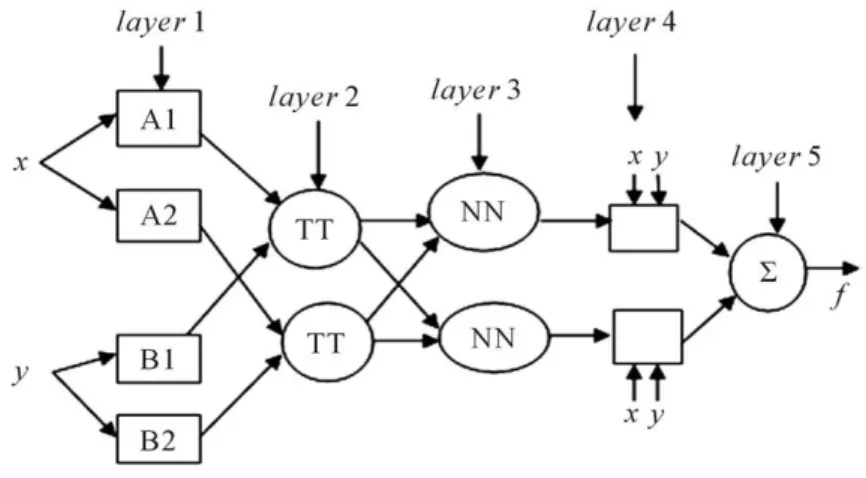
2.3.3.1. ANFIS Structure
Designing the ANFIS structure for the SAR ice classification is the initial step to perform the classification. Defining the inputs, rules, membership functions and output for the system is separated according to the five layers. In this paper structure of the ANFIS consists of six inputs and single output. The six inputs represent different pixel values of the images. Each of this training set forms the fuzzy inference system with rules. In fuzzy inference system, fuzzification will take the rules for every input signal. Defuzzification is used to select one particular output signal to the corresponding selected image. Image will be selected during testing process. The basic structure of the ANFIS classifier is presented in the below Figure 4.
Summarization of these five layers according to the SAR ice classification includes as follows,
a. Layer 1: In Layer 1 fuzzification process are taken place in which an input of pixels are assigned.
b. Layer 2: In Layer 2 execution of the fuzzy rules are taken place. Rules are assigned according to the inputs and its output.
For ex, if the input = 2.354 (image pixel value) then Output = Resultant image (corresponding annotations according to the pixel regions are given).
Here an annotation represents as the color representations.This part is the main one in fuzzy inference system. The rule which is not defined linguistically can lead to wrong output. Layer 3: In Layer 3 normalization of membership functions are performed. Membership functions given here are the targets in which each pixel can be stored.
Layer 4: In Layer 4 execution of the fuzzy rule is performed. Execution of rules with the membership function is taken place here.
Layer 5: In Layer 5 summing up the output of the layer 4th and produces the output for the ANFIS system is taken place. Extraction of the rules according to the test image selected is displayed in the output.
ANFIS training gives better results as it combines both the benefits of neural network and Fuzzy systems. ANFIS classifier gives better performance than other two algorithms namely BPN and Fuzzy classifier in terms of its accuracy and speed to produce the output. It takes less time to generate the result. ANFIS classifier gives accuracy rate of 90% on SAR ice classification. Experimental results of ANFIS classifier is given in the Table 7 to Table 13. ANFIS classifier has some limitations which are listed below.
a. It creates a new structure for every incoming input since it combines the neural network structure.
b. Assigning the targets is another problem in ANFIS classifier. These targets should be analyzed and identified according to the problem which we going to perform.
c. Time which is taken for training the pixels is higher. d. Rules must be linguistically defined.
e. According to the back propagation error rate, weights should be change until no errors are found.
2.3.4. Proposed Adaptive Neuro Fuzzy Inference System (ANFIS) with Particle Swarm Optimization (PSO) Classifier
To overcome the limitations found in the above discussed classifier a new novel method have been developed for SAR ice classification. Proposed method involves optimization technique which is combined with the previous classifier called ANFIS. PSO is an optimization method which is used to search for global optimized solution but time must be uncertain. The work starts with randomly initialized population for every individuals.PSO operates on the social behavior of particle. The global best solution is derived by adjusting each individual position with respect to global best position of particle with the entire population. Each individual is adjusting by altering the velocity with its observation of the particle and by its experience in search space. According to fitness function the new local best position and global best position will be calculated [11]. There are some numerous advantages of ANFIS with PSO classifier during the experimental, these are:
a. Finding fitness function in terms of optimized value: In ANFIS both the neural network and fuzzy classifier are combined. Training process is worked as neural network technique in which targets has to be given to the network. In combination of ANFIS with PSO, PSO will find its fitness function by using its optimized value. Fitness function is further used as the target.
b. Structure: In ANFIS new inputs are added to its network system as its works as neural networks it creates a new structure for its every incoming input. PSO does not create any new structure for newly coming inputs. It is used to update the new one with the same structure itself.
c. Computational Time: PSO will optimize its input according to the computational time; it produces the fitness result according to its optimized value so that the large amount of time will be reduced when training ANFIS.
d. Error : PSO aims to find out optimized vales, when it gets combined with ANFIS there is no possibilities of errors in training a network.
e. Defining Rule: PSO’s optimized fitness value will be given to the rule set for ANFIS system. There is no need to set the rules in a linguistic manner as seen in the fuzzy and ANFIS system. To define a rule to perform the classification, calling fitness out put itself enough. For example, if fitness (1) then output=result.
The summarization of steps performed with ANFIS with PSO is given below.
Step 1: Assigning Inputs: input is taken are the pixel values of an image. There is no need to assign the targets in proposed work.
Step 2: Parameter initialization: PSO training parameters are initialized such as number of iterations, number of particles, number of swarms etc. These are initialized with empty matrices. During the training process the values are gets loaded for each iteration.
Step 3: Fitness function: After the training process over the outputs are produced this is said to be fitness function. This can be assigned as a target to the ANFIS system.
Step 4: Rules: According to the fitness function rules are defined. The great benefit in defining a rule is, is no need to define a rule linguistically. Just calling of fitness function is enough.
For ex, rule can be defined as, If Fitness = 5.235 (image pixel value)
Then output = result (within this annotations are specified)
Step 5: Output: According to this value the output of classified image will be displayed.
In this paper, PSO is added to the ANFIS at the stage of training. Pixel values are given at the fuzzification process in proposed classifier. PSO optimize all these pixel values of SAR ice image and rearrange the membership function called as fitness function (here the optimize value taken are the input pixels). It gives the fitness value result according to the time of execution. The results which are produced from the PSO are given to the fuzzy rule generation, in which efficient manner of defining a rules are taken place. This leads the system to easily generate the output in less time and accurate manner. Compare to all other three classifiers proposed method gives better accuracy rate of 93.33%. The experimental results for ANFIS with PSO classifier is given in the Table 7 to Table 13.
3. Results and Discussion
This paper proposes a new classification algorithm called ANFIS with PSO for SAR ice classification. It has also presented various filter methods, segmentation algorithms and classification algorithms. The comparative study between all these methods is performed and it predicts the best one in all the three stages. The results are presented in the following paragraphs.
3.1. Preprocesing Results
Preprocessing stage aims at removing speckle noise from SAR ice images. There are various filters are performed such as, Median Filter, Lee Filter, Enhanced Lee Filter, Frost filter, Enhanced frost filter, Kaun filter and Gamma filter are from standard image speckle filter category and Symlet, Coiflet, Haar and Daubechies from wavelet family. All these filters performances are evaluated using following metrics.
Signal to noise ratio Mean Absolute Error Root Mean Square Error Universal Image Quality Index
a. Signal to Noise Ratio (SNR) is used to measure the level of original signal affected by the level of back ground noise.
b. Mean Absolute Error (MAE) is used to measure how close the prediction to the actual outcome.
c. Root Mean Square Error (RMSE) is used to measure the difference between the prediction and observed outcome.
d. Universal Image Quality Index (UIQI) is used to measure the quality of an image after removing the noise. Table 5 shows the subjective results for the comparison of speckle filters.
Table 5. Subjective Results or Speckle Filter Comparison
Strait of Georgia Ward Hunt
Filters SNR MAE RMSE UIQI SNR MAE RMSE UIQI Median Filter 7.247 4.275 9.254 0.579 5.272 8.287 9.382 0.124 Lee Filter 8.254 4.457 7.157 0.654 8.242 7.285 7.285 0.698 Enhanced Lee Filter 7.546 8.424 6.247 0.654 4.252 8.285 11.284 0.845 Frost Filter 6.242 4.248 7.257 0.789 7.472 9.385 7.285 0.174 Enhanced Frost Filter 8.245 5.452 8.254 0.657 7.552 7.284 12.524 0.213 Gamma Filter 5.245 8.427 9.475 0.694 7.282 8.274 5.965 0.125 Kaun Filter 4.575 7.427 7.851 0.378 6.274 9.281 9.382 0.368 Symlet Method 5.282 4.462 7.854 0.721 8.392 8.262 7.254 0.542 Coiflet Method 4.122 5.457 8.254 0.324 8.145 6.254 5.282 0.284 Haar Method 8.572 7.152 9.247 0.654 9.261 8.154 5.254 0.896 Daubechies Method 9.204 3.757 5.214 0.854 10.235 5.251 4.282 0.964 SNR- Signal to Noise Ratio, MAE- Mean Absolute Error, RMSE- Root Mean Square Error, UIQI- Universal Image Quality Index.
Daubechies method uses overlapping windows, thus the results reflects changes between its pixel intensities. Daubechies of D4 transform has four scaling coefficients. The sum of all these scaling coefficients is also one, so the calculation is depended over four adjacent pixels. Subjective results have shown that Daubechies from wavelet family has given a low error rate in MAE and RMSE parameters and higher rate in SNR, Universal Image Quality Index (UIQI) parameters.
Early winter sea ice, Beaufort Islo Cedros
Filters SNR MAE RMSE UIQI SNR MAE MSE UIQI Median Filter 5.682 7.145 12.457 0.874 8.987 8.244 8.254 0.874 Lee Filter 7.254 4.857 9.547 0.457 7.214 7.254 8.247 0.745 Enhanced Lee Filter 6.254 6.547 8.254 0.874 7.124 8.214 10.247 0.457 Frost Filter 4.257 7.654 7.254 0.598 8.578 6.214 7.024 0.789 Enhanced Frost Filter 4.896 9.354 7.547 0.578 8.254 9.254 5.456 0.457 Gamma Filter 8.257 5.254 8.574 0.754 3.254 5.254 7.254 0.459 Kaun Filter 6.578 8.254 7.254 0.874 4.256 6.547 11.657 0.687 Symlet Method 8.547 7.254 5.257 0.547 4.257 6.201 8.244 0.784 Coiflet Method 4.578 6.578 6.254 0.654 5.325 7.896 9.217 0.745 Haar Method 8.257 5.254 5.254 0.814 9.254 5.214 7.247 0.852 Daubechies Method 9.945 4.521 4.251 0.995 10.247 3.457 4.478 0.986
Grays harbor and willapa Bay Mouth of Columbia river Filters SNR MAE RMSE UIQI SNR MAE RMSE UIQI Median Filter 7.254 7.245 12.248 0.204 5.245 5.328 6.215 0.457 Lee Filter 8.254 8.576 9.247 0.235 4.247 7.244 7.215 0.587 Enhanced Lee Filter 6.254 7.214 9.244 0.257 6.245 7.248 6.425 0.665 Frost Filter 6.257 6.247 5.241 0.368 5.247 8.245 6.430 0.228 Enhanced Frost Filter 5.254 8.247 8.242 0.345 8.254 9.247 10.412 0.784 Gamma Filter 6.254 8.248 7.245 0.456 7.289 9.244 8.825 0.578 Kaun Filter 5.241 9.248 10.247 0.745 9.235 9.254 7.252 0.874 Symlet Method 9.254 6.254 5.245 0.457 11.287 11.245 12.254 0.247 Coiflet Method 9.954 6.147 5.426 0.425 9.974 11.247 6.212 0.578 Haar Method 10.214 5.247 4.255 0.245 11.987 12.278 5.214 0.784 Daubechies Method 11.247 4.578 3.112 0.894 12.624 5.124 4.024 0.987
3.2. Segmentation Results
Segmentation stage aims at separating the image into various regions. This paper aims at classifying the SAR ice images to know the regions around it. Thus segmentation includes dividing the images into four regions using K-means and Watershed algorithms. The area error segmentation metrics are used to evaluate the performance of these two algorithms is as follows:
a. True Positive Area Ratio b. False Positive Area Ratio c. Similarity Index (SI)
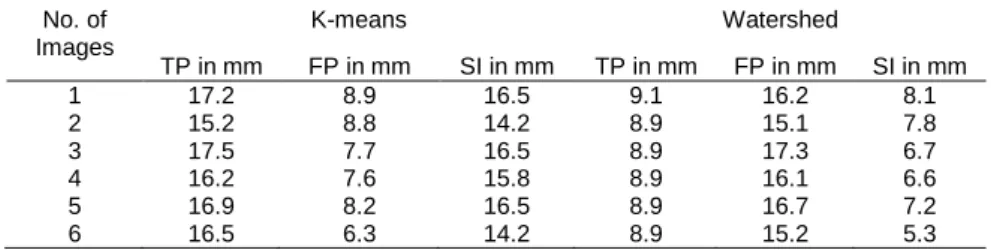
Table 6 Shows the subjective results for comparison of K-means and Watershed segmentation algorithms, True Positive area ratio should be higher and False Positive area ratio should be lower and Similarity Index ratio should be higher in best segmentation algorithm. K-means has proven best in all these evaluation metrics.
Table 6. Subjective Results for K-means and Watershed Comparison No. of Images K-means Watershed TP in mm FP in mm SI in mm TP in mm FP in mm SI in mm 1 17.2 8.9 16.5 9.1 16.2 8.1 2 15.2 8.8 14.2 8.9 15.1 7.8 3 17.5 7.7 16.5 8.9 17.3 6.7 4 16.2 7.6 15.8 8.9 16.1 6.6 5 16.9 8.2 16.5 8.9 16.7 7.2 6 16.5 6.3 14.2 8.9 15.2 5.3 TP- True Positive area ratio, FP- False Positive area ratio, SI- Similarity Index
3.3. Classification Results
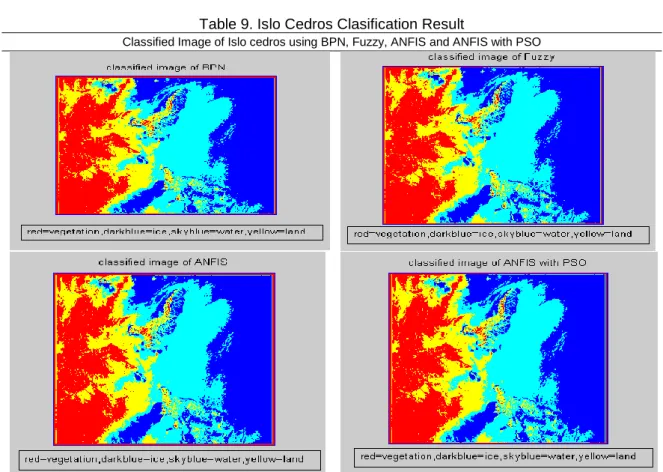
Classification aims in identifying the regions in SAR ice images. The regions which are extracted can be identified as ice, water, vegetation and land. These areas can be represented in color options to know the different between the regions. There are four supervised classifiers such as BPN, Fuzzy classifier, ANFIS and ANFIS with PSO is considered in classification stage. All these classifiers performances are evaluated through following metrics.
a. Accuracy b. Validity Index c. Sensitivity d. Time Complexity
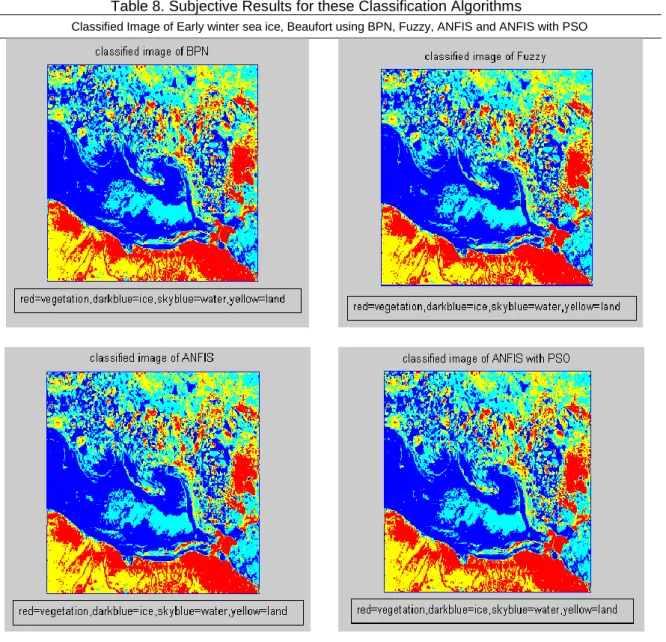
Table 7 shows the subjective results for these classification algorithms.
Table 7. Subjective Results for these Classification Algorithms
Classifiers Accuracy in % Validity Index in % Sensitivity in % Time in Sec
BPN 77.14 0.0514 4.8913 6.11827
Fuzzy 86.6 0.0867 - 5.30179
ANFIS 90 0.0900 5.6604 3.54808
ANFIS +PSO 93.33 0.0933 5.8577 0.27243
Accuracy rate is used to define the overall performance of the classifiers; Validity Index is used to measure the performance of the network. Sensitivity is used to calculate the sensitivity on the parameters when it changes during training. It can be applied for BPN, ANFIS and ANFIS with PSO classifiers since all these classifiers uses network parameters to train a network, it is not suitable for fuzzy classifier since it does not uses parameters for training. Time complexity measure is used to predict the overall time has taken by the classifiers during the training.
Among all other classifiers ANFIS with PSO classifier gives higher rate in Accuracy, Validity Index, and Sensitivity and the lower rate in time complexity. Following Tables shows the classification results for all the classifiers included in SAR ice classification.
Table 8. Subjective Results for these Classification Algorithms
Table 9. Islo Cedros Clasification Result
Classified Image of Islo cedros using BPN, Fuzzy, ANFIS and ANFIS with PSO
Table 10. Grays Harbor and Willapa Bay Classification Result
Table 11. Mouth of Columbia River Classification Result
Classified Image of Mounth of Columbia River using BPN, Fuzzy, ANFIS and ANFIS with PSO
Table 12. Strait of Georgia Classification Result
Table 13. Ward Hunt Classification Result
Classified Image of Ward Hunt using BPN, Fuzzy, ANFIS and ANFIS with PSO
4. Conclusion
In this paper, pixel based classification on SAR ice images using supervised learning classifiers are performed. SAR images are affected by speckle noise due to its backscattering nature of radar signals. This work is initialized with Denoising a speckle noise images using a Daubechies method in wavelet filter with the comparison of all the speckle filters. After the preprocessing stage segmentation is preceded. Comparison of K-means and Watershed algorithm are done and K-means is selected as a best segmented algorithm. Image was divided into the regions after the segmentation process has completed. Four classifiers namely, back propagation neural network (BPN), Fuzzy Classifier, Adaptive Neuro Fuzzy Inference System (ANFIS), and ANFIS with Particle Swarm Optimization (PSO) are performed. Above classifiers are the single classifier used to compare the accuracy of classification in SAR ice. Various regions called Vegetation, Land, water and ice are extracted by these classifiers. In this paper only four classifiers are performed for SAR ice classification, in future, fusion based classification can also be considered. It was focused on performing pixel based classification in future objective based classification can perform in fusion based classification.
References
[1] Natalia Yu. Zakhvatkina, Vitaly Yu. Alexandrov, Ola M. Johannessen, Stein Sandven, and Ivan Ye. Frolov Classification of Sea Ice Types in ENVISAT Synthetic Aperture Radar Images. IEEE
Transactions on Geoscience And Remote Sensing; 51.
[2] Liu Huiying, Guo Huadong, Zhang Lu. Sea Ice Classification using Dual Polarization SAR Data. 35th International Symposium on Remote Sensing of Environment (ISRSE35) IOP Conf. Series: Earth and Environmental Science. 2014; 17.
[3] S. Parrilli, M. Poderico, C.V. Angelino, G. Scarpa, and L. Verdoliva. A non local approach for SAR image Denoising. IEEE. 2010.
[4] Klogo Griffith S., Gasonoo Akpeko and Ampomah K. E. Isaac. On The Performance of Filters for Reduction of Speckle Noise In SAR images off the Coast Of The Gulf of Guinea. International Journal of Information Technology, Modeling and Computing (IJITMC). 2013; 1(4).
[5] Miao Ma, Jianhui Liang, Min Guo, Yi Fan, Yilong Yin. SAR Image Segmentation based on Artificial Bee Colony Algorithm. Elsevier: Applied Soft computing. 2011; 11(8): 5205–5214.
[6] Ashraf A. Aly, Safaai Bin Deris and Nazar Zaki. Research Review for Digital Image Segmentation Techniques. International Journal of Computer Science & Information Technology (IJCSIT). 2011; 3(5).
[7] Pushpalata Pujari, Jyoti Bala Gupta. Improving Classification Accuracy by Using Feature Selection and Ensemble Model. International Journal of Soft Computing and Engineering (IJSCE). 2012. [8] Vidushi Sharma, Sachin Rai and Anurag Dev. A Comprehensive Study of Artificial Neural Networks.
IJARCSSE. 2012.
[9] Vini Malik, Aakanksha Gautam, Aditi Sahai, Ambika Jha, Ankita Ramvir Singh. Satellite Image Classification Using Fuzzy Logic. International Journal of Recent Technology and Engineering (IJRTE). 2013.
[10] V.Seydi Ghomsheh, M. Aliyari Shoorehdeli, M. Teshnehlab. Training ANFIS Structure with Modified PSO Algorithm. Mediterranean Conference on Control & Automation. 2007.
[11] Sarita Mahapatra, Alok Kumar Jagadev, Bighnaraj Naik. Performance Valuation of PSO Based Classifier for Classification of Multidimensional Data with Variation of PSO Parameters and Knowledge Discovery Database. International Journal of Advanced Science and Technology. 2011. [12] Shuhrat Ochilov and David A. Clausi. Automated Classification of Operational SAR Sea Ice Images.
Canadian Conference Computer and Robot Vision. IEEE. 2010: 978-0-7695-4040-5.
[13] Huawu Deng and David A. Clausi. Unsupervised Segmentation of Synthetic Aparture Radar Sea Ice Imagery using a Novel Markov Random Field model. IEEE Transaction. 2005; 43(3).
[14] S. Parrilli, M. Poderico, C.V. Angelino, G. Scarpa, L. Verdoliva. A Non Local Approach for SAR Image Denoising. IEEE IGARSS: IEEE Geoscience and Remote Sensing Society. 2010.
[15] K. Thangavel, R. Manavalan, Laurence Aroquiaraj. Removal of Speckle Noise from Ultrasound Medical Image based on Special Filters: Comparative Study. ICGST GVIP: Journal Emphasizes on Graphics, Vision and Image Processing. 2009; 9(3); 25-32.
[16] Klogo Griffith S, Gasonoo Akpeko, Ampomah K. E. Isaac. On the Performance of Filters For Reduction Of Speckle Noise in SAR Images Off the Coast of the Gulf Of Guinea. IJITMC: International Journal of Information Technology, Modeling and Computing. 2013; 1(4).
[17] Bala Prakash, Venu babu, Venu Gopal. Image Independent Filter for Removal of Speckle Noise. IJCSI International Journal of Computer Science Issues. 2011; 8(5).
[18] Jyoti Jaybhay, Rajveer Shastri. A Study of Speckle Noise Reduction Filters. Signal & Image Processing: An International Journal (SIPIJ). 2015; 6(3).
[19] Asli Ozdarici, Zuhal Akyurek. A Comparison of SAR Filtering Techniques on Agricultural Area
Identification. ASPRS: American Society of Photogrammetric and Remote Sensing Annual
Conference. San Diego. 2010.
[20] Jaspreet kaur, Rajneet Kaur. Biomedical Images Denoising Using Symlet Wavelet with Wiener Filter. International Journal of Engineering Research and Applications (IJERA). 2013; 3.
[21] Meenakshi Cahudary, Anupama Dhamija. A Brief Study of Various Wavelet Families and Compression Techniques. Journal of Global Research in Computer Science. 2013; 4(4).
[22] Sangeeta Arora, Yadwinder S. Brar, Sheo Kumar. Haar Wavelet Transform for Solution of Image Retrieval. International Journal of Advanced Computer and Mathematical Sciences. 2014; 5(2). [23] Mohamed I. Mahmoud, Moawad I. M. Dessouky, Salah Deyab and Fatma H. Elfouly. Comparison
Between Haar and Daubechies Wavelet Transforms on FPGA Technology. International Journal of Electrical, Computer, Energetic, Electronic and Communication Engineering. 2007; 1(2).
[24] Ashraf A. Aly, Safaai Bin Deris, Nazar Zaki, Research Review for Digital Image Segmentation Techniques. International Journal of Computer Science & Information Technology (IJCSIT). 2011; 3(5).
[25] K.M. Sharavana Raju, Dr. V. Karthikeyani. Improved Satellite Image Preprocessing and Segmentation using Wavelets and Enhanced Watershed Algorithm. International Journal of Scientific & Engineering Research. 2012; 3(10).
[26] Sim Heng Ong, Kelvin W.C Foong, Poh-Sun Goh, Wieslaw Nowinski. Medical Image Segmentation Using K-Means Clustering and Improved Watershed Algorithm. IEEE Research Gate Conference paper. 2001.
[27] Johann Schumann, Yan Liu. Performance Estimation of a Neural Network-based Controller.
[28] Stein Sandven, Ola M. Johannessen. Ers-L Ice Monitoring of The Northern Sea Route. Proceedings of the First ERS-1 Pilot Project Workshop. Toledo, Spain. 1994.