2013
Which advanced mathematics courses influence
ACT score? A state level analysis of the Iowa class
of 2012
Mary L. Grinstead
Iowa State University
Follow this and additional works at:https://lib.dr.iastate.edu/etd
Part of theEducational Assessment, Evaluation, and Research Commons,Elementary and Middle and Secondary Education Administration Commons, and theScience and Mathematics Education Commons
This Dissertation is brought to you for free and open access by the Iowa State University Capstones, Theses and Dissertations at Iowa State University Digital Repository. It has been accepted for inclusion in Graduate Theses and Dissertations by an authorized administrator of Iowa State University Digital Repository. For more information, please [email protected].
Recommended Citation
Grinstead, Mary L., "Which advanced mathematics courses influence ACT score? A state level analysis of the Iowa class of 2012" (2013).Graduate Theses and Dissertations. 13622.
Which advanced mathematics courses influence ACT score? A state level analysis of the Iowa class of 2012
by
Mary L. Grinstead
A dissertation submitted to the graduate faculty in partial fulfillment of the requirements for the degree of
DOCTOR OF PHILOSOPHY Major: Education (Educational Leadership)
Program of Study Committee: Jeffrey S. Brooks, Co-Major Professor
Joanne Marshall, Co-Major Professor Mack C. Shelley II
Jan Westerman-Beatty Frankie Santos Laanan
Iowa State University Ames, Iowa
2013
TABLE OF CONTENTS
Page LIST OF TABLES ... v LIST OF FIGURES ... vi ACKNOWLEDGEMENTS ... vii ABSTRACT ... viii CHAPTER 1 INTRODUCTION ... 1 Background….. ... 1Predictors of College Readiness/Academic Achievement ... 2
Purpose ……. ... 3
Hypotheses…. ... 4
Rationale ……. ... 6
Significance of the Study …. ... 6
Definition of Terms……... 7
CHAPTER 2 LITERATURE REVIEW ... 9
Mathematics Achievement in the United States and Iowa….. ... 9
High School Mathematics Curriculum ... 11
History of Standards in Iowa… ... 11
Iowa Core…. ... 11
Common Core State Standards ... 12
Content of Advanced Mathematics Courses …. ... 13
Trigonometry ... 13
Pre-calculus ... 14
Calculus……... 14
AP Calculus…. ... 14
AP Statistics…….. ... 15
College Entrance Exams …. ... 15
The ACT …. ... 16
History…... 17
Intent of the Test ... 18
Bias of College Entrance Exams……... 18
Coursework and ACT Scores…... 18
College Entrance Exams as a Measure of College Readiness………. ... 20
Theoretical Framework…. ... 21
Student Background Characteristics…… ... 23
Page
District Characteristics…. ... 23
Consistency ... 24
Advanced Mathematics Courses ... 24
Summary….. ... 25
CHAPTER 3 METHODOLOGY: GENERAL LINEAR MODELING TO ASSESS COLLEGE READINESS ... 26
Methodology ... 26 Sample……... 27 Variables …….. ... 29 Ethical Considerations…. ... 32 Limitations … ... 35 Summary….. ... 35
CHAPTER 4 RESULTS AND FINDINGS ... 37
Descriptive Analysis ... 37
General Linear Model Analysis ... 45
ACT Mathematics Score Prediction Model…….. ... 46
Hypotheses One Through Five ... 50
Hypothesis One ... 50
Hypothesis Two ... 50
Hypothesis Three ... 50
Hypothesis Four ... 50
Hypothesis Five…….. ... 51
ACT Composite Score Prediction Model ... 51
Hypotheses Six Through Ten ... 54
Hypothesis Six ... 54 Hypothesis Seven ... 55 Hypothesis Eight….. ... 55 Hypothesis Nine ... 55 Hypothesis Ten ... 55 Summary….. ... 55
ACT Mathematics Score ... 55
ACT Composite Score ... 56
CHAPTER 5 SUMMARY, CONCLUSIONS, AND DIRECTIONS FOR FUTURE RESEARCH ... 58
Major Findings….. ... 58
Discussion…….. ... 61
Theoretical Significance ... 61
Student Background Characteristics…. ... 61
Page
District Characteristics…. ... 62
Consistency…. ... 63
Advanced Mathematics Courses…. ... 64
Practical Significance... 66
Policy Implications ... 71
Limitations …….. ... 73
Directions for Future Research ... 75
Conclusions…….. ... 76
APPENDIX A VARIABLE CORRELATION TABLE ... 79
APPENDIX B INSTUTUTIONAL REVIEW BOARD (IRB) APPROVAL ... 82
LIST OF TABLES
Page
Table 1 Variable Descriptions... 33
Table 2 Description of Students by Enrollment in Advanced Mathematics
Courses ... 38
Table 3 GLM Partial Regression Coefficients for Independent Variables
Estimating ACT Mathematics Score ... 47
Table 4 GLM Model Summary: ACT Mathematics Score Prediction Model ... 49
Table 5 GLM Partial Regression Coefficients for Independent Variables
Estimating ACT Composite Score ... 52
Table 6 GLM Model Summary: ACT Composite Score Prediction Model ... 54
Table 7 Advanced Mathematics Course Sequences and Increase in
Estimated ACT Score (Compared to Algebra II) ... 67
LIST OF FIGURES
Page
ACKNOWLEDGMENTS
The completion of this degree was accomplished with the support and
encouragement of many individuals to whom my appreciation is extended. I would like to thank Drs. Joanne Marshall, Mack Shelley, Jan Westerman-Beatty, and Frankie Santos Laanan for being a part of my committee and providing encouragement and feedback throughout this entire process. Their feedback and guidance has helped me become the educational leader and researcher I have strived to be. A special thank you is owed to Dr. Jeffrey Brooks for being my advisor at the onset of this dissertation process and seeing me through completion from more than 1,000 miles away.
Thanks also to my friends and former co-workers at the Iowa Department of Education who granted me access to the data needed for this study. In particular, thank you to Dr. Xiaoping Wang, a great friend and mentor. Xiaoping molded me into an aspiring educational researcher with lots of help and patience along the way.
Last, and most important, I would like to thank my husband, Jason, for his patience through this entire process and his constant faith that I could get through the program. I am grateful for the support he provided for me to attend classes, study, and write this dissertation. I especially thank my daughter, Abby, who arrived half way through this process and reminded me what is truly important in life—spending time with family. I look forward to the time I will now have to spend with them.
ABSTRACT
This study explores the relationship between specific advanced mathematics courses and college readiness (as determined by ACT score). The ACT organization has found a consistent relationship between taking a minimum core number of mathematics courses and higher ACT scores (mathematics and composite) (ACT, Inc., 2012c). However, the extent to which individual advanced mathematics courses increase ACT scores when prior achievement is controlled is unknown. The relationship between trigonometry, pre-calculus, calculus, advanced placement (AP) calculus, and AP statistics, and ACT composite and mathematics scores are examined using a general linear model. The sample for the study included members of the Iowa high school graduating class of 2012 who took the ACT at any point during high school.
All advanced mathematics courses included in the analysis (trigonometry, pre-calculus, pre-calculus, AP pre-calculus, and AP statistics) had a positive relationship with ACT mathematics score. AP calculus had the largest impact of all advanced mathematics courses on both ACT mathematics and composite scores, with enrollment in the course associated with an average increase of 1.6568 points in ACT mathematics score and an average increase of 1.1821 points in ACT composite score.
The relationship between enrollment in advanced mathematics courses and ACT scores was influenced by race/ethnicity for algebra II, calculus, and AP calculus and by gender for algebra II and calculus. In addition, female students saw less of an increase in ACT mathematics score when taking algebra II than males and less of an increase in ACT mathematics and composite scores when taking algebra II and calculus than male
students. This finding hints at the cultural sensitivity of instructional strategies and materials in the mathematics classroom. To increase college readiness, students must be provided the opportunity to enroll in advanced mathematics courses, including AP
courses. These opportunities for exposure to advanced mathematical concepts must exist for all students, including minority and female students. This requires increased exposure to pre-algebra concepts at the middle school grade levels and culturally sensitive
instructional methods in which students relate their everyday experiences to mathematical concepts.
CHAPTER 1 INTRODUCTION
Background
Education policymakers and stakeholders have increasingly emphasized college readiness for high school graduates (Bill and Melinda Gates Foundation, 2012; Common Core State Standards Initiative, 2012; United States Department of Education, 2009). In 1973, 27 percent of jobs in the United States required postsecondary education. This increased to 59 percent in 2007 and is predicted to grow to 66 percent by 2018 (Symonds, Schwartz, & Ferguson, 2011). With the current job market requiring postsecondary education for the majority of careers, the Obama administration stresses the importance of preparing every United States student for college (The White House, 2009). A commonly accepted indicator of college readiness is performance on college entrance examinations, such as the SAT and ACT. Colleges and universities use these scores as student admission criteria and for course placement (Beale, 2012; Camilli, 2006). Districts and states are also using college entrance examination scores to assess the effectiveness of educational systems in preparing students for college.
ACT (along with the SAT) is one of the two major college entrance examinations used by colleges and universities in the United States. ACT is used more commonly among Midwestern colleges, while the SAT is used predominantly on the east and west coasts. The ACT organization has found a consistent relationship between taking at least three mathematics courses and a higher ACT (mathematics and composite) score (ACT, Inc., 2012b). However, it cannot be determined that advanced mathematics courses
increase ACT scores as prior achievement is not controlled. It is not known if higher-achieving students take more advanced mathematics courses and also score higher on the ACT or if advanced mathematics courses actually increase test scores.
Predictors of College Readiness/Academic Achievement
The strongest predictor of academic achievement on standardized tests is previous achievement (Aubrey, Dahl, & Godfrey, 2006; Kyttälä & Björn, 2010). Student
background characteristics have also been found to impact student achievement. Socioeconomic status and academic achievement have a consistently negative
relationship (Parke & Kanyongo, 2012; Siegler et al., 2012). Achievement gaps also exist between African Americans and whites and between Hispanics and whites (Bali & Alvarez, 2004; Wolk, 2011). Among the national graduating class of 2012 who took the ACT, the scores of African Americans and Hispanics were significantly lower than the scores of whites. Whites had an average composite score of 22.4, African Americans 17.0, and Hispanics 18.9 (ACT, Inc., 2012b). English language learners also
underperform native English speakers in both reading and mathematics (Garcia, Lawton, & De Figueiredo, 2012; Guglielmi, 2012). Examining National Assessment of
Educational Progress (NAEP) data, McGraw, Lubienski, and Strutchens (2006) found males to have consistently higher mathematics test scores than females from 1990 to 2003.
The context in which students receive their education also impacts student
achievement. Students attending high schools with class sizes of more than 400 students had lower student achievement than students in smaller high schools (Weiss, Carolan, &
Baker-Smith, 2010). Another contextual variable impacting student achievement is consistency. A negative relationship exists between both low attendance and mobility and student achievement (Lamdin, 1996; Parke & Kanyongo, 2012; Parke & Keener, 2011; Roby, 2004). The content of courses also impacts achievement. Ma and Wilkins (2007) found upper-level mathematics courses (trigonometry, pre-calculus, and calculus) to increase student growth as measured by mathematics tests.
Purpose
The purpose of this study was to explore the relationship between students’ enrollment in specific advanced mathematics courses and college readiness. This study addresses the following questions: Is taking advanced mathematics courses related to an increase in ACT score? Specifically, which advanced mathematics courses contribute to an increase in ACT score? Advanced mathematics courses are defined in this study as courses beyond the algebra I, geometry, and algebra II sequence in high school. Algebra I, geometry, and algebra II is the typical course sequence for high school mathematics courses (Common Core State Standards Initiative, 2010). Advanced mathematics courses include trigonometry, pre-calculus, calculus, AP calculus, and AP statistics. The state of Iowa high school graduating class of 2012 who took the ACT at any point during high school constitute the sample in this study. Matched student cohort data from ninth grade (2008-2009 school year) to twelfth grade (2011-2012 school year) collected by the Iowa Department of Education (IDE) will be analyzed to examine ninth grade academic achievement, mathematics course-taking patterns, background characteristics, and ACT scores.
Data were analyzed using a general linear model (GLM). The purpose of a GLM is to quantify the relationship between several independent variables and a dependent variable. The dependent variable of interest was ACT score (mathematics or composite). The independent variables in the model included: enrollment in trigonometry, enrollment in pre-calculus, enrollment in calculus, enrollment in AP calculus, enrollment in AP statistics, prior achievement, attendance rate, student mobility, district size, and a number of student demographic variables.
Hypotheses
Given the literature on mathematics courses and college readiness, ten hypotheses will be tested in the study.
1. HO: There is no relationship between enrollment in trigonometry in high
school and ACT mathematics score.
HA: There is a positive relationship between enrollment in trigonometry in
high school and ACT mathematics score.
2. HO: There is no relationship between enrollment in pre-calculus in high school
and ACT mathematics score.
HA: There is a positive relationship between enrollment in pre-calculus in high
school and ACT mathematics score.
3. HO: There is no relationship between enrollment in calculus in high school
and ACT mathematics score.
HA: There is a positive relationship between enrollment in calculus in high
4. HO: There is no relationship between enrollment in AP calculus in high school
and ACT mathematics score.
HA: There is a positive relationship between enrollment in AP calculus in high
school and ACT mathematics score.
5. HO: There is no relationship between enrollment in AP statistics in high
school and ACT mathematics score.
HA: There is a positive relationship between enrollment in AP statistics in
high school and ACT mathematics score.
6. HO: There is no relationship between enrollment in trigonometry in high
school and ACT composite score.
HA: There is a positive relationship between enrollment in trigonometry in
high school and ACT composite score.
7. HO: There is no relationship between enrollment in pre-calculus in high school
and ACT composite score.
HA: There is a positive relationship between enrollment in pre-calculus in high
school and ACT composite score.
8. HO: There is no relationship between enrollment in calculus in high school
and ACT composite score.
HA: There is a positive relationship between enrollment in calculus in high
school and ACT composite score.
9. HO: There is no relationship between enrollment in AP calculus in high school
HA: There is a positive relationship between enrollment in AP calculus in high
school and ACT composite score.
10. HO: There is no relationship between enrollment in AP statistics in high
school and ACT composite score.
HA: There is a positive relationship between enrollment in AP statistics in
high school and ACT composite score.
Rationale
To maximize student learning by exposing students to the content most likely to increase student knowledge it is important to isolate the contributions of the high school curriculum (administered through mathematics courses) on student college readiness. By controlling for previous academic achievement, the relationship between mathematics courses and ACT scores is measured more accurately. Students who enroll in advanced mathematics courses also score higher on the ACT and other measures of college readiness (ACT, Inc., 2012b; Noble, Davenport, Schiel, & Pommerich, 1999; Noble, Roberts, & Sawyer, 2006). However, it has not been widely determined if
higher-achieving students enroll in more advanced mathematics courses and also score higher on the ACT or if advanced mathematics courses increase test scores.
Significance of the Study
This study informs the placement of high school students in advanced course-taking patterns. The Common Core State Standards (Common Core State Standards Initiative, 2012) push for four years of mathematics course taking for students at all
achievement levels. These standards were adopted by the Iowa Board of Education on July 29, 2010 (Iowa Department of Education, 2010). This study informs the effect of advanced course enrollment, along with the importance of high expectations for students at all performance levels.
This study contributes to the existing literature by exploring the effect of enrollment in advanced mathematics courses on ACT scores while controlling for previous achievement and by exploring the effect of enrollment in specific individual courses (trigonometry, pre-calculus, calculus, AP calculus, and AP statistics) on ACT scores. Other studies (Noble, Davenport, Schiel, & Pommerich, 1999; Noble, Roberts, & Sawyer, 2006) have explored the impact of mathematics coursework on ACT score using course enrollment that was self-reported by students at the time of the ACT test
administration. The present study used student course enrollment reported by school for state data reporting, giving a more accurate representation of course enrollment. In addition, no previous study has explored the impact of AP courses on ACT scores. This study explored the impact of AP calculus and AP statistics (individually) on ACT scores.
Definition of Terms
ACT composite score: The ACT composite score is the average of the four ACT test scores: English, mathematics, science, and reading. The score ranges from 1 (low) to 36 (high) (ACT, Inc., 2012c).
ACT mathematics score: The ACT mathematics score is based on 60 multiple-choice questions covering pre-algebra/elementary algebra, intermediate algebra/coordinate
geometry, and plane geometry/trigonometry. The score ranges from 1 (low) to 36 (high) (ACT, Inc., 2012c).
Advanced mathematics courses: Courses beyond the algebra I, geometry, and algebra II sequence in high school. Advanced mathematics courses include trigonometry, pre-calculus, pre-calculus, AP pre-calculus, and AP statistics.
College readiness: The level to which students are prepared for college (Arnold, Lu, & Armstrong, 2012; The College Board, 2006; Conley, 2008).
CHAPTER 2 LITERATURE REVIEW
The purpose of this study was to explore the relationship between students’ enrollment in specific advanced mathematics courses and college readiness. Specifically, the impact of enrollment in advanced mathematics courses on ACT scores was explored. In order to frame the study within the context of the current literature, a review of
literature encompassing the state of mathematics education in the United States and Iowa, high school mathematics courses, and college readiness (including the ACT) was
performed. In conclusion, a theoretical framework for exploring the relationship between enrollment in advanced mathematics courses and ACT composite and mathematics scores is presented.
Mathematics Achievement in the United States and Iowa
The mathematics achievement of students in the United States on international and national benchmarks paints a picture of mediocrity. Of the 56 countries and other education systems that administered the Trends in International Mathematics and Science Study (TIMSS) at grade eight in 2011, the United States average score in mathematics at grade eight was higher than 32 other countries but lagged behind Korea, Singapore, Chinese Taipei, Hong Kong, Japan, the Russian Federation, and Quebec. The United States eighth grade TIMSS average mathematics score (509) was slightly higher than the international TIMSS scale average (500) in 2011. However, mathematics achievement in the United States appears stagnant, as there was no measurable difference between the
United States average mathematics score at grade eight in 2007 (508) and in 2011 (509) (Institute of Education Sciences, 2012).
The Programme for International Student Assessment (PISA) has a different emphasis than TIMSS or NAEP, assessing mathematics literacy (i.e., application) rather than content knowledge. It also tests a different selection of countries than does TIMSS. Among the 65 education systems testing 15-year-olds in 2009, the United States ranked
32nd. The United States had a lower average mathematics score (487) than the
international Organisation for Economic Co-operation and Development (OECD) PISA average (496) (OECD, 2010).
As for national achievement measures, the mathematics achievement of United States eighth graders is slowly climbing on the NAEP, with the national average score increasing from 262 to 284 between 1990 and 2011. However, 65 percent of eighth graders failed to score in the proficient or above range, meaning that approximately two-thirds of United States eighth graders enter high school unprepared for higher levels of mathematics (National Center for Education Statistics, 2011).
Until lately, students in Iowa have been achieving at higher levels on mathematics assessments than the rest of the nation. However, Iowa has not mirrored the positive trends of increased achievement that the nation has seen over the past 20 years. In 1990, Iowa ranked in the top three states on the eighth grade mathematics NAEP with an
average score of 278, 16 points above the average score for the nation (262). Since 1990, other states have seen large increases in NAEP scores, while scores in Iowa have
increased moderately. According to the latest eighth grade mathematics NAEP
The average mathematics score for Iowa eighth graders was 285, while the eighth grade
mathematics national average was 284 in 2011. Iowa now ranks 24th on the eighth grade
mathematics NAEP (National Center for Education Statistics, 2011). This lack of growth in academic achievement is a major point of concern for Iowa’s educational system.
High School Mathematics Curriculum
History of Standards in Iowa
The state of Iowa highly values local control of school districts. Until 2008, standards were developed by local school districts, creating 371 (as of 2008) different sets of standards across the state. Iowa was the last state in the nation to adopt state-wide standards (Public Broadcasting System, 2012). This adoption of state standards was brought about by federal No Child Left Behind (NCLB) requirements, which requires a test aligned to the standards taught in the classroom to be administered state-wide (Iowa Department of Education, 2010; U.S. Department of Education, 2001). In 2005, Iowa passed legislation to develop a core curriculum for Iowa high schools in mathematics, science, and literacy (Iowa Department of Education, n.d.). The Iowa legislature passed state standards and expanded Iowa’s core curriculum in 2007 by including kindergarten
through eighth grade and adding social studies and 21st Century learning skills subject
areas (Iowa Department of Education, n.d.). Iowa Core
The Iowa Core (originally known as the Iowa Core Curriculum) was signed into law in 2007 (Iowa Department of Education, 2010). This initiative was the first attempt in the state of Iowa for common state-wide standards. The Iowa Core identified the most
important curricula in literacy, mathematics, and science based on best practice research and information from Iowa Testing Programs (the provider of Iowa’s state accountability test), the National Assessment of Educational Progress, ACT, and the College Board (Iowa Department of Education, n.d.). Iowa high schools were required to fully implement the Iowa Core by July 1, 2012. Schools with kindergarten through eighth grade are required by Iowa Code to implement the Iowa Core by the 2014-2015 school year (Iowa Department of Education, n.d.).
Common Core State Standards
In an effort to increase the academic achievement of students, the Iowa State Board of Education adopted the Common Core State Standards as part of the Iowa Core in 2010 (Iowa Department of Education, 2010). When adopting the Common Core, the State Board of Education required all Iowa school districts and accredited non-public schools to implement the Iowa Core, including the Common Core by 2014-2015 (Iowa Department of Education, 2010). The Common Core State Standards are more rigorous than the state standards previously implemented in many states, by introducing concepts at early ages and making room for more advanced coursework in high school (Schmidt, 2012). These standards for high school mathematics include content that all high school students should learn to be college- and career-ready (Common Core State Standards Initiative, 2010; Jones & King, 2012). In addition, standards are also listed for students pursuing advanced mathematics (such as calculus or advanced statistics) that go beyond what is expected for all students. The expected standards for all students focus on number and quantity, algebra, functions, modeling, geometry, and statistics and
of what students should know by the end of their high school careers. The Common Core State Standards do not dictate a sequence for high school mathematics courses (Common Core State Standards Initiative, 2010); however, students who master the Common Core State Standards in mathematics should be prepared for entry-level credit-bearing
mathematics courses in college (Jones & King, 2012).
Content of Advanced Mathematics Courses
Neither the Iowa Core nor the Common Core mandates requirements for standards taught in individual classes. Instead, they list all standards students need to master in order to be college ready by the end of their high school careers (Common Core State Standards Initiative, 2010; Iowa Department of Education, 2010). Qualifiers for taking advanced mathematics courses typically include algebra I, geometry, and algebra II (Common Core State Standards Initiative, 2010), but sequencing may differ among high schools. Advanced mathematics courses may differ greatly in content among high schools and even classrooms, though they may be titled the same. However, all Iowa high school courses are coded according to the Secondary School Course Classification System: School Codes for the Exchange of Data (SCED) system. The SCED system allows for a standardized coding of courses that is consistent across districts and states (Bradby, Pedroso, & Rogers, 2007). All advanced mathematics courses coded meet the following definitions (as determined by individual high schools):
Trigonometry
Trigonometry courses typically include the following topics: “trigonometric and
trigonometric identities and equations; solutions of right and oblique triangles; and complex numbers” (Bradby, Pedroso, & Rogers, 2007, p. 25) and prepare students for
calculus (Bradby, Pedroso, & Rogers, 2007). Pre-calculus
Pre-calculus topics typically include “complex numbers; polynomial, logarithmic,
exponential, rational, right trigonometric, and circular functions, and their relations, inverses and graphs; trigonometric identities and equations; solutions of right and oblique triangles; vectors; the polar coordinate system; conic sections; Boolean algebra and symbolic logic; mathematical induction; matrix algebra; sequences and series; and limits and continuity” (Bradby, Pedroso, & Rogers, 2007, p. 26) and combine elementary functions, analytic geometry, trigonometric, and mathematical analysis (Bradby, Pedroso, & Rogers, 2007).
Calculus
“Derivatives, differentiation, integration, the definite and indefinite integral, and applications of calculus” (Bradby, Pedroso, & Rogers, 2007, p. 27) are topics typically
covered in calculus courses (Bradby, Pedroso, & Rogers, 2007). AP Calculus
Advanced placement (AP) calculus courses have a suggested curriculum set by the College Board. This curriculum parallels college-level calculus courses (The College Board, 2012). Topics covered in the course include “elementary functions, properties of functions and their graphs, limits and continuity, differential calculus (including
definition of the derivative, derivative formulas, theorems about derivatives, geometric applications, optimization problems, and rate-of-change problems), and integral calculus
(including antiderivatives and the definite integral)” (Bradby, Pedroso, & Rogers, 2007, p. 27). Before teaching AP calculus, teachers are required to attend a four-day institute conducted by the College Board covering the AP calculus exam (offered at the end of the course for college credit) and the curriculum framework of the course.
AP Statistics
Using the College Board's suggested curriculum paralleling college-level statistics courses, AP statistics courses cover the following topics: “exploring data, sampling and experimentation, anticipating patterns, and statistical inference” (Bradby, Pedroso, & Rogers, 2007, p. 30). Before teaching AP statistics, teachers are required to attend a four-day institute conducted by the College Board covering the AP statistics exam (offered at the end of the course for college credit) and the curriculum framework of the course.
College Entrance Exams
Colleges and universities use entrance exams to measure academic achievement of potential students. These standardized tests are used to uniformly measure the level of knowledge and compare students from all over the nation. The two predominant college entrance examinations used by colleges and universities in the United States are the ACT and the SAT. The ACT is a curriculum-based achievement test that measures what a student has learned, while the SAT is more of an aptitude test that measures reasoning and verbal abilities (ACT, Inc., 2012d).
The ACT is used more commonly among Midwestern colleges, while the SAT is used predominantly on the east and west coasts. Among the Iowa graduating class of 2012, 63 percent took the ACT and 3 percent took the SAT (Iowa Department of
Education, 2012). Therefore, the ACT is used as the college entrance exam of interest when examining the Iowa graduating class of 2012.
The ACT
The ACT is a curriculum-based measure of college readiness that includes multiple choice tests of academic achievement in English, math, reading, and science (ACT, Inc., 2012d). The ACT test requires college academic skills by reproducing college-level work. The ACT is designed to “determine how skillfully students solve problems, grasp implied meanings, draw inferences, evaluate ideas, and make judgments in subject-matter areas important to success in college” (ACT, Inc., 2007, p. 3). Test questions require students to integrate skills in major curriculum areas with the information on the test. As a result, ACT scores are related to the students’ academic achievement in curriculum areas (ACT, Inc., 2007).
The mathematics test is timed for 60 minutes with 60 questions covering
mathematics skills typically acquired by the end of eleventh grade. The mathematics test covers six content areas: pre-algebra, elementary algebra, intermediate algebra,
coordinate geometry, plane geometry, and trigonometry. The ACT English test is timed for 45 minutes with 75 questions covering standard written English and rhetorical skills. The ACT reading test is timed for 35 minutes with 40 questions involving reading comprehension. The ACT science test is timed for 35 minutes with 40 questions covering skills required in the natural sciences: interpretation, analysis, evaluation, reasoning, and problem solving (ACT, Inc., 2012a). Each test (English, mathematics,
reading, and science) is scored in a range of 1 (low) to 36 (high). A composite score is also calculated by averaging the scores from all four tests (ACT, Inc., 2012a).
Most students take the ACT during their junior year of high school (ACT, Inc., 2007), as ACT recommends taking the test late in the high school career, to ensure that coursework corresponding to the test is completed, and at least two months before college applications are due (ACT, Inc., 2012d). In 2006, 65 percent of ACT test takers were juniors and 34 percent were seniors in high school (ACT, Inc., 2007).
History
E. F. Lindquist founded ACT in 1959 with the purpose of testing broad competencies with a college entrance exam. Lindquist viewed the current college admission test at the time (known as the College Board Examination) as an instrument that excluded all students except the most qualified. The essay format of the test was subjective and time-intensive to score. During the 1920’s, the SAT was developed with the intention of providing a measure of intelligence instead of academic achievement. Many schools used the SAT for scholarships and the College Board Examination as the entrance exam (Lemann, 2000). The influence of the SAT was limited to highly selective institutions (mostly private and in the northeastern United States) and was not marketed across the United States. This created a need to be addressed by the ACT (ACT, Inc., 2009a).
The majority of colleges and state university systems used a wide assortment of admission tests that did not produce standard results in the 1950s. Lindquist’s goal was to create a measure of academic preparation (not of intelligence) to address academic deficiencies. The ACT was first administered in November of 1959 (ACT, Inc., 2009a).
Intent of the Test
The ACT is designed not only to measure student learning for college planning, but also to help colleges and universities address the needs of their students by providing information about the achievement level of students (ACT, Inc., 2007). Since the ACT is curriculum-based, the best preparation is learning through high school coursework. The ACT may serve as a coursework motivator to students, as high test scores represent a commitment to high school coursework (ACT, Inc., 2007).
Bias of College Entrance Exams
College entrance exams were designed to identify students’ knowledge and skills regardless of socioeconomic status, gender, or race (Lemann, 2000). However, Freedle (2003) found both cultural and statistical test bias on the SAT against minorities (African Americans, Hispanics, and Asians) and students from low socioeconomic backgrounds, particularly in the verbal section of the test, using Differential Item Functioning (DIF). The DIF statistical procedure (Dorans & Kulick, 1986) examines minority and white responses to each test item. Santelices and Wilson (2010) confirmed Freedle’s finding of test bias against African Americans in the SAT using updated data in 2010. Similarly, Wainer and Steinberg (1992) found statistical bias against females in the mathematics section of the SAT.
Coursework and ACT Scores
Several studies have found advanced mathematics coursework to have a positive relationship with ACT score (Noble, Davenport, Schiel, & Pommerich, 1999; Noble,
Roberts, & Sawyer, 2006). Noble, Davenport, Schiel, and Pommerich (1999) used a national sample of 5,489 students who took the ACT in either April or October 1996 to examine the relationships among high school courses, GPA, background characteristics, and ACT scores. They found algebra II to increase ACT mathematics score by 0.95 and ACT composite score by 0.86. Geometry increased ACT mathematics and composite scores by 1.13 and 0.79, respectively. Trigonometry increased ACT mathematics score by 1.97 and ACT composite score by 1.38. Calculus increased ACT mathematics and composite scores by 3.48 and 2.39, respectively. This study did not control for students’ prior achievement (Noble et al., 1999). Noble and Schnelker (2007) controlled for prior achievement when examining high school coursework and ACT scores with a national sample of 403,381 students from the graduating class of 2003. Taking algebra I, geometry, and algebra II was associated with an ACT mathematics score increase of about 1.1 points (compared with taking none, one, or two of these three courses). In addition to algebra I, geometry, and algebra II, taking either trigonometry or other advanced mathematics was associated with an average increase in ACT mathematics score of 1.0 to 1.5 points. Taking other advanced mathematics and trigonometry, or trigonometry and calculus, was associated with an increased ACT mathematics score of over 2.0 points. The greatest mathematics coursework score increase (3.2 points) resulted from taking other advanced mathematics, trigonometry, and calculus in addition to algebra I, geometry, and algebra II (Noble & Schnelker, 2007). Both studies (Noble et al. 1999; Noble & Schnelker, 2007) used coursework data that was self-reported by students at the time of the ACT test administration.
Mo, Yang, Hu, Calaway, and Nickey (2011) found Memphis high school students who took AP mathematics courses (calculus or statistics) to be six times more likely to pass the ACT’s college readiness benchmark in mathematics (a score of at least 19) than their peers who did not take AP mathematics courses, when controlling for prior
achievement as measured by Tennessee’s state accountability test (Mo, Yang, Hu, Calaway, & Nickey, 2011).
College Entrance Exams as a Measure of College Readiness
Preparing students for postsecondary education is essential to improved
educational attainments for students (Education Trust, 1999; Somerville & Yi, 2002). A commonly accepted definition of college readiness does not currently exist (Olson, 2006). Many researchers choose not to define college readiness, but operationalize it as academic performance (Porter & Polikoff, 2012). The College Board’s standards for college readiness define the skills and knowledge students need to master to succeed in college-level language arts, mathematics, and science courses. These standards are limited to academic knowledge (The College Board, 2006). ACT, Inc. (2007) defines college readiness as preparation for credit-bearing postsecondary coursework without remediation.
With researchers operationalizing college readiness as academic preparation (or
achievement), the term college readiness is often confused with academic preparation
(Barnes, Slate, & Rojas-LeBouef, 2010). This academic definition of college readiness neglects factors that contribute toward success in college such as creativity, critical thinking, and self-regulation (Amrein-Beardsley, 2009; Conley, 2005, 2008; Ravitch
2009, 2010). College entrance exams measure only the academic preparation definition of college readiness. Conley (2008) defines college readiness as “the degree to which previous educational and personal experiences have equipped them [students] for the expectations and demands they will encounter in college” (p. 3). Similarly, Arnold, Lu,
and Armstrong (2012) define college readiness as an “umbrella term that refers to the multidimensional set of skills, traits, habits, and knowledge that students need to enter college with the capacity to succeed once they are enrolled” (p. 2). The definition of
college readiness is increasingly expanding beyond academic preparation.
Using SAT scores as a measure of college readiness, Moore et al. (2010) found African American and Hispanic students to have lower rates of college readiness in both reading and mathematics than whites during the 2006-2007 school year. College
readiness gaps also appear between African Americans and whites, Hispanics and whites, and students from low socioeconomic and high socioeconomic backgrounds when
examining coursework and grade point averages (Roderick, Nagaoka, & Coca, 2009). Combs, Slate, Moore, Bustamante, Onwuegbuzie, and Edmonson (2010) found males to be more likely to score at or above college-ready benchmark scores on the ACT and SAT, using state-wide data from Texas. However, females were more likely to take the ACT or SAT than males (Combs et al., 2010).
Theoretical Framework
Based on the review of literature, enrollment in advanced mathematics courses is expected to be positively associated with ACT composite and mathematics scores. Advanced mathematics courses will have more of an impact on the ACT mathematics
score than on the ACT composite score, as the ACT composite score is an average of ACT English, mathematics, science, and reading scores.
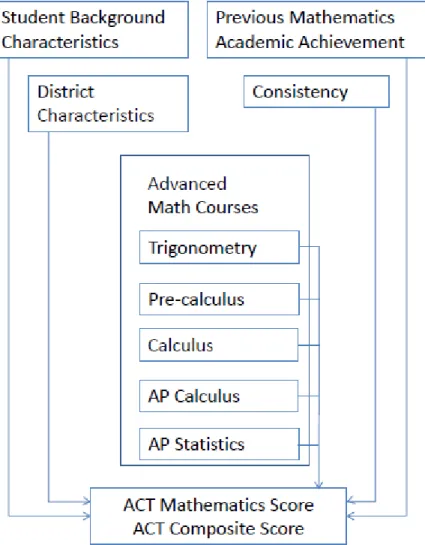
As indicated in the theoretical model below (Figure 1), factors affecting ACT scores in this study can be classified into five areas: student background characteristics, previous mathematics academic achievement, advanced mathematics courses,
consistency, and district characteristics.
Figure 1. Theoretical Framework
Student Background Characteristics
Several student background characteristics are expected to affect student achievement. Low socioeconomic status, English language learner status, student disability status, minority race/ethnicity, and female gender have a negative relationship with academic achievement as shown in the literature (ACT, Inc., 2012b; Bali & Alvarez, 2004; Garcia, Lawton, & De Figueiredo, 2012; Guglielmi, 2012; McGraw, Lubienski, & Strutchens, 2006; Parke & Kanyongo, 2012; Siegler et al., 2012; Wolk, 2011). It is expected that students with low socioeconomic status, English language learner status, disability status, minorities, and females will have lower ACT scores than their peers.
Previous Mathematics Achievement
The strongest predictor of academic achievement on standardized tests is previous achievement (Aubrey, Dahl, & Godfrey, 2006; Kyttälä & Björn, 2010). Therefore, a positive relationship between previous mathematics achievement and ACT scores is expected. In addition, high-achieving students take more advanced courses. Previous achievement is expected to affect student advanced mathematics course enrollment. Therefore, previous mathematics achievement must be measured separately from
enrollment in advanced mathematics courses to isolate the individual effects of previous achievement and advanced mathematics courses on ACT scores.
District Characteristics
District/school characteristics also affect student achievement. Weiss, Carolan, and Baker-Smith (2010) found that small high schools have higher academic
achievement than larger high schools. It is expected that students attending smaller school districts will have higher ACT scores than students attending large districts. District size is the only district characteristic controlled in this study.
Consistency
Another contextual variable impacting student achievement is consistency. Consistency will be measured as student attendance rate and student mobility in this study. A negative relationship exists between attendance and mobility and between attendance and student achievement (Lamdin, 1996; Parke & Kanyongo, 2012; Parke & Keener, 2011; Roby, 2004). It is expected that attendance rate will be positively related with ACT scores, while student mobility will be negatively related with ACT scores.
Advanced Mathematics Courses
Enrollment in advanced mathematics courses is expected to have a positive relationship with ACT scores (Noble, Davenport, Schiel, & Pommerich, 1999; Noble, Roberts, & Sawyer, 2006). The effect of enrollment in each specific mathematics course, trigonometry, pre-calculus, calculus, AP calculus, and AP statistics on ACT mathematics and composite scores may differ by mathematics course. In accordance with previous research (Noble et al., 1999; Noble & Schnelker, 2007), calculus, AP calculus, and AP statistics are expected to have more of an impact on ACT scores than are trigonometry or pre-calculus.
Summary
Mathematics achievement in the United States lags behind many other developed countries (Institute of Education Sciences, 2012; OECD, 2010). In addition, Iowa’s rank as one of the highest-achieving states in the nation has slipped over the past 20 years as other states have made large gains in mathematics achievement (National Center for Education Statistics, 2011).
With the adoption of the Common Core State Standards, the state of Iowa aims to increase the number of Iowa high school graduates who are college ready (Iowa
Department of Education, 2010). One way to increase college readiness may be to increase student enrollment in advanced mathematics courses. Advanced mathematics courses have been found to have a positive effect on college readiness as measured by ACT mathematics and composite scores (Noble, Davenport, Schiel, & Pommerich, 1999; Noble, Roberts, & Sawyer, 2006). The ACT measures college readiness by assessing the knowledge students need for college coursework. However, college readiness is
increasingly defined as preparation for all aspects of college, both academic and non-academic (Amrein-Beardsley, 2009; Conley, 2005, 2008; Ravitch 2009, 2010).
This study explored the effect of enrollment in advanced mathematics courses (trigonometry, pre-calculus, calculus, AP calculus, and AP statistics) on ACT composite and mathematics scores. It is expected that enrollment in advanced mathematics courses will have a positive relationship with ACT scores. Student background characteristics, previous student mathematics academic achievement, district characteristics, and consistency (as measured by student attendance rate and student mobility) were also expected to affect ACT composite and mathematics scores.
CHAPTER 3
METHODOLOGY: GENERAL LINEAR MODELING TO ASSESS COLLEGE READINESS
This study examines the effect of taking advanced mathematics courses on ACT mathematics and composite scores for Iowa high school students in the context of prior achievement (previous test scores), attendance rates, socioeconomic status, gender, race/ethnicity, English language status, disability status, student mobility, and the
enrollment size of the school district the student attends. These data are collected yearly for all Iowa students from all Iowa public school districts by the Iowa Department of Education (IDE).
Methodology
Data were analyzed using a general linear model (GLM). The purpose of GLM is to quantify the relationship among several independent variables and a dependent variable (StatSoft, Inc., 2013). The GLM used in this study predicts a continuous dependent variable (ACT score with a range of 1 to 36) with both continuous and categorical independent variables. GLM is a flexible version of linear regression that allows for categorical or binary independent variables. GLM differs from linear regression by allowing the linear model to be related to the outcome variable through a relationship between the linear predictor and the mean of the distribution function. GLM also allows the magnitude of the variance of each measurement to be a function of its predicted value. The equation is written as:
Y = b0 + b1X1 + b2X2 + …+ bnXn + ϵ
where Y is the dependent variable, X1 through Xn are the independent variables, b0 is the
intercept,b1 through bn are the coefficients for the independent variables, and ϵ is the error
term.
A coefficient for a given independent variable is the predicted difference in the dependent variable for a one-unit increase on the given independent variable, holding all other independent variables constant. If the dependent and independent variables have a positive relationship, the ACT score of a student increases as the value of the independent variable increases (StatSoft, Inc., 2013; Tabachnick & Fidell, 2013).
Prior to estimating the GLM, a correlation matrix was calculated using all variables in the study. Through the use of the correlation matrix, some independent variables may be excluded from the analysis. If the correlation between two variables was greater than 0.90, one of the two variables was eliminated from the analysis to reduce multicollinearity. Multicollinearity occurs when variables are so highly correlated that it is difficult to determine accurate estimates of individual regression coefficients, because the two variables are measuring the same construct.
The analysis was conducted using SPSS Statistics version 20 (IBM Corp., 2011) statistical software. SPSS is a data analysis tool used frequently by quantitative social science researchers.
Sample
The sample includes all Iowa high school students who graduated in the 2012 school year who also took the ACT at any point in their high school careers and took the
Iowa Test of Educational Development (ITED) test at ninth grade. There were 33,293 students who graduated from Iowa high schools in 2012. However, only 15,661 of those graduates took both the ACT and ITED—the sample included in this study. This does not include any students who dropped out of high school. In the 2010-2011 school year, 3.4 percent of Iowa high school students dropped out (Iowa Department of Education, 2011). Sixty-three percent of the Iowa graduating class of 2012 took the ACT (Iowa Department of Education, 2012). Most ACT test takers in Iowa elect to take the ACT; however, all students in the Des Moines and Clinton school districts take the ACT because those districts administer the test to all eleventh grade students in the school setting.
Access to the data was gained through an agreement with the IDE. The IDE collects demographic, enrollment, course (classes), and achievement data on all Iowa students in public schools, grades kindergarten through twelve.
This data was collected by the IDE from Iowa public school districts through Electronic Access to Student Information and Records (EASIER), a required student-level data collection. Data are collected through EASIER three times per year: in fall (October), winter (January), and spring (June). Student level data has been collected from Iowa school districts through EASIER since the 2004-2005 school year with the use of state student identification numbers. Through the use of unique student identification numbers, the IDE has been able to track the progress of students through the educational system over time. Information collected through EASIER includes student enrollments, attendance, demographic information (such as race/ethnicity, gender, and free or reduced-price lunch eligibility), and student course enrollment. All courses are coded according
to the Secondary School Course Classification System: School Codes for the Exchange of Data (SCED) system. The SCED system allows for a standardized coding of courses that is consistent across districts and states. For more information on the SCED system, see Bradby, Pedroso, and Rogers (2007).
In order to control for district size, district enrollment numbers were taken from the October 2011 certified enrollment. These numbers are a count of students enrolled in Iowa school districts as of October 1, 2011, submitted by public school districts to the IDE for funding purposes.
ITED assessment data are shared directly from Iowa Testing Programs (ITP) to the IDE. Iowa school districts submit student demographic information to ITP on the ITED. ITP provides this information along with test scores to the IDE for the completion of the Adequate Yearly Progress (AYP) report—the yearly evaluation of schools and districts using assessment data—required by No Child Left Behind.
ACT data are also shared directly from ACT to the IDE for all Iowa public school students. ITED and ACT data are also linked with unique student identification numbers.
Variables
The dependent variables of interest are ACT mathematics score (range of 1 to 36) and ACT composite score (range of 1 to 36). The ACT mathematics test covers six content areas: pre-algebra, elementary algebra, intermediate algebra, coordinate
geometry, plane geometry, and trigonometry. The ACT composite score is the average of a student’s score on the four tests of the ACT: English, mathematics, reading, and
• Gender. Gender was taken from spring 2012 EASIER, the latest student data
collection point.
• Race/ethnicity. Race/ethnicity was taken from spring 2012 EASIER, the latest
student data collection point. Students in Iowa are identified according to seven race/ethnicity categories: African American, Asian American,
Hispanic/Latino, Native American, Multi-racial, Hawaiian/Pacific Islander, and white. The data set included only 29 Native American students and 15 Hawaiian/Pacific Islander students. These counts are not large enough to draw statistically significant conclusions. Therefore, the Native American and Hawaiian/Pacific Islander students are excluded from the analysis.
• Low socioeconomic status (determined by free or reduced-price lunch
eligibility). Free or reduced-price lunch eligibility was taken from spring 2012 EASIER, the latest student data collection point.
• English language learner (ELL). ELL status is determined by a student’s
score on the state of Iowa’s English language proficiency assessment. ELL
status was taken from spring 2012 EASIER, the latest student data collection point.
• Student disability status (determined by presence of an Individual Education
Plan [IEP]). IEP status was taken from spring 2012 EASIER, the latest student data collection point.
• Ninth grade ITED score in mathematics (2008-2009 school year). School
districts in Iowa retain local control of when they administer the ITED assessment. Based on when students were tested during the year, their test
scores may be standardized to fall, midyear, or spring norms. These three norm groups are not directly comparable with one another; therefore, all national standard scores were converted to z-scores with mean of zero and standard deviation of one for direct comparison among all norm groups.
• District enrollment size. District enrollment size was taken from the fall 2011
certified enrollment file, the official student count file for the senior year of students in the study. District size was divided into six categories of
enrollment size used by the Iowa Department of Education (fewer than 300; 300 to 599; 600 to 999; 1,000 to 2,499; 2,500 to 7,499; and 7,500 or more).
• Attendance rate during tenth and eleventh grade year (2009-2010 and
2010-2011). The attendance rate for each student is calculated by dividing the student’s total days present during the school year by his or her total days
enrolled during the school year.
• Mobility. Students are considered mobile if they change district of attendance
between their ninth and twelfth grade years.
• Algebra II enrollment. Algebra II enrollment is included in the model, as it is
considered a gatekeeper course for advanced mathematics courses. Enrollment is determined by the use of SCED codes and was taken from winter 2008-2009, winter 2009-2010, winter 2010-2011, or winter 2011-2012 EASIER.
• Trigonometry enrollment. Enrollment is determined by the use of SCED
codes and was taken from winter 2008-2009, winter 2009-2010, winter 2010-2011, or winter 2011-2012 EASIER.
• Pre-calculus enrollment. Enrollment is determined by the use of SCED codes
and was taken from winter 2008-2009, winter 2009-2010, winter 2010-2011, or winter 2011-2012 EASIER.
• Calculus enrollment. Enrollment is determined by the use of SCED codes and
was taken from winter 2008-2009, winter 2009-2010, winter 2010-2011, or winter 2011-2012 EASIER.
• AP calculus enrollment. Enrollment is determined by the use of SCED codes
and was taken from winter 2008-2009, winter 2009-2010, winter 2010-2011, or winter 2011-2012 EASIER.
• AP statistics enrollment. Enrollment is determined by the use of SCED codes
and was taken from winter 2008-2009, winter 2009-2010, winter 2010-2011, or winter 2011-2012 EASIER.
Further descriptions of variables are located in Table 1.
Ethical Considerations
De-identified data were provided by the IDE. Names and birthdates were not included in the dataset. The dataset includes school district size category, gender, race/ethnicity, disability status (presence of IEP), and socioeconomic status (eligible for free or reduced-price lunch). The dataset was stored on an encrypted flash drive and was not copied onto any computer.
Table 1. Variable Descriptions
Variable name Frequency or mean
(range)
Description Dependent variables
ACT mathematics score 21.76
(11 to 36)
Score on the mathematics section of the ACT test.
ACT composite score 22.19
(8 to 36)
Composite score of the ACT test. Independent variables
Gender Gender of the student.
Female 53.78%
Male 46.22%
Race/ethnicity Race/ethnicity of the student.
Asian American 1.87%
African American 2.20%
Hispanic/Latino 4.07%
Multi-racial 1.51%
White 90.35%
Low socioeconomic status 16.51% Student is eligible for free or reduced-priced school meals.
English language learner 0.42% Student is eligible for English language learner services.
Student with disability 1.46% Student has an Individual Education Plan (IEP) on file.
Ninth grade mathematics test z-score
0.3558 (-3.5823 to
2.38687)
Ninth grade ITED score in mathematics as converted to a z-score with a mean of zero.
Table 1 continued. Variable Descriptions
Variable name Frequency or mean
(range)
Description
District size Number of students enrolled at the district which the student attends.
<300 1.57% 300-599 12.62% 600-999 16.40% 1,000-2,499 26.74% 2,500-7,499 19.02% 7,500+ 23.66% Attendance rate 95.77 (46.77 to 100.00)
Aggregate student attendance rate during tenth and eleventh grade.
Mobility 3.73% Student changed attending districts between their ninth and twelfth
grade years.
Algebra II 87.85% Student enrolled in an algebra II course in high school.
Trigonometry 25.02% Student enrolled in a trigonometry course in high school.
Pre-calculus 39.70% Student enrolled in a pre-calculus course in high school.
Calculus 12.50% Student enrolled in a calculus course in high school.
AP calculus 8.71% Student enrolled in an AP calculus course in high school.
AP statistics 3.61% Student enrolled in an AP statistics course in high school.
Limitations
This study has several limitations. Only students attending public school districts in Iowa are included. Students attending private schools or participating in home
schooling are not included. In addition, the graduating class of 2012 is the only cohort of students included in the study. Also, the ACT is the only college entrance exam
included. Students may elect to take a college entrance exam other than the ACT (such as the SAT); however, only three percent of the class of 2012 took the SAT (The College Board, 2012).
A number of factors that may influence ACT scores are not accounted for, including motivation, extra-curricular activities, student engagement, teacher quality, course quality, and school climate. Although important, these factors are beyond the scope of this study, which focuses on the relationship between advanced mathematics course enrollment and college readiness.
Summary
Through a general linear model (GLM), the relationship between enrollment in advanced mathematics courses (trigonometry, pre-calculus, calculus, AP calculus, and AP statistics) and ACT scores was quantified while controlling for other student
variables. Data from the Iowa graduating class of 2012 who took the ACT were used in estimating the model. The dependent variables of interest were ACT mathematics score and ACT composite score, while independent variables included trigonometry
enrollment, pre-calculus enrollment, calculus enrollment, AP calculus enrollment, AP statistics enrollment, ninth grade ITED score in mathematics, attendance rate, gender,
race/ethnicity, socioeconomic status, English language learner status, student disability status, district size, and mobility.
CHAPTER 4
RESULTS AND FINDINGS
Data for the 15,661 Iowa high school graduates who took both the ACT during high school and ITED in their ninth grade year were analyzed for descriptive purposes by groups of students who enrolled in each advanced mathematics course. Next, a general linear model (GLM) was utilized to predict ACT mathematics score and ACT composite score (individually) using prior achievement (previous test scores), socioeconomic status, gender, race/ethnicity, English language status, disability status, the enrollment size of the school district which the student attends, student attendance rates, and student mobility as independent variables.
Descriptive Analysis
The descriptive analysis involved data for students who graduated from high school in Iowa in 2012, took the ACT during high school, and took the ITED during their ninth grade year. The study used 15 variables to predict ACT mathematics and ACT composite scores.
Table 2 describes the similarities and differences between students who enrolled in each advanced mathematics course and students who did not enroll in at least algebra II. Those who enrolled in algebra II and those who did not enroll in algebra II constitute mutually exclusive groups. However, the algebra II, trigonometry, pre-calculus, calculus, AP calculus, and AP statistics groups are not mutually exclusive.
Table 2. Description of Students by Enrollment in Advanced Mathematics Courses Did not enroll in algebra II (n=1,903) Algebra II (n=13,758) Trigono-metry (n=3,918) Pre-calculus (n=6,217) Calculus (n=1,958) AP calculus (n=1,364) AP statistics (n=566)
ACT mathematics score 17.31 22.38 24.29 24.52 26.37 28.22 25.81
ACT composite score 18.02 22.77 24.34 24.46 25.91 27.51 25.77
Gender Female 53.97% 53.75% 51.38% 50.67% 45.35% 43.55% 49.12% Male 46.03% 46.25% 48.62% 49.33% 54.65% 56.45% 50.88% Race/ethnicity Asian American 1.79% 1.88% 1.86% 2.90% 2.86% 4.47% 3.53% African American 6.73% 1.58% 0.82% 1.30% 0.51% 0.73% 1.77% Hispanic/Latino 9.46% 3.32% 2.37% 2.93% 3.37% 2.71% 2.83% Multi-racial 3.31% 1.26% 1.30% 1.35% 1.28% 1.17% 1.59% White 78.72% 91.96% 93.65% 91.52% 91.98% 90.91% 90.28%
Low socioeconomic status 36.00% 13.81% 9.14% 11.18% 10.52% 7.77% 7.60%
English language learner 1.47% 0.28% 0.18% 0.13% 0.36% 0.00% 0.35%
Student with disability 7.67% 0.60% 0.20% 0.31% 0.15% 0.07% 0.18%
Ninth grade mathematics test
z-score -0.3977 0.4601 0.7369 0.7574 1.0255 1.1691 0.8832 District size <300 1.58% 1.57% 1.91% 1.35% 1.53% 0.00% 0.00% 300-599 12.35% 12.65% 10.13% 10.76% 11.54% 6.20% 0.88% 600-999 12.93% 16.88% 17.05% 12.40% 19.05% 7.70% 1.41% 1,000-2,499 22.07% 27.38% 29.38% 24.40% 32.18% 25.95% 22.79% 2,500-7,499 10.56% 20.19% 22.15% 23.37% 13.38% 29.03% 26.50% 7,500+ 40.52% 21.33% 19.37% 27.71% 22.32% 31.09% 48.41% Attendance rate 94.02% 96.01% 96.38% 96.43% 96.93% 96.75% 96.19% Mobility 5.26% 3.52% 2.86% 2.65% 2.50% 1.25% 2.47% 38
Table 2 continued. Description of Students by Advanced Mathematics Course Enrollment Did not enroll in algebra II (n=1,903) Algebra II (n=13,758) Trigono-metry (n=3,918) Pre-calculus (n=6,217) Calculus (n=1,958) AP calculus (n=1,364) AP statistics (n=566) Algebra II 0.00% - 100.00% 100.00% 100.00% 100.00% 100.00% Trigonometry 0.00% 28.48% - 24.11% 45.71% 31.23% 29.33% Pre-calculus 0.00% 45.19% 38.26% - 66.04% 77.71% 58.67% Calculus 0.00% 14.23% 22.84% 20.80% - 13.27% 11.31% AP calculus 0.00% 9.91% 10.87% 17.05% 9.24% - 24.03% AP statistics 0.00% 4.11% 4.24% 5.34% 3.27% 9.97% - 39
Students who enrolled in AP calculus had the highest ACT mathematics score, with an average score of 28.22.They are followed by students who enrolled in calculus (26.37), then AP statistics (25.81), pre- calculus (24.52), trigonometry (24.29), and algebra II (22.38). Students who did not enroll in algebra II had the lowest average ACT mathematics score (17.31). Students who enrolled in AP calculus also earned the highest ACT composite score of all the groups, with an average score of 27.51. They are
followed by students who enrolled in calculus (25.91), then AP statistics (25.77), pre-calculus (24.46), trigonometry (24.34), and algebra II (22.77). Students who did not enroll in algebra II had the lowest average ACT composite score (18.02).
The majority of students who did not enroll in algebra II, and of those who enrolled in algebra II, trigonometry, and pre-calculus were female (53.97 percent, 53.75 percent, 51.38 percent, and 50.67 percent, respectively), while the majority of students who enrolled in calculus, AP calculus, and AP statistics were male (54.65 percent, 56.45 percent, and 50.88 percent, respectively). Students who did not enroll in algebra II had the most racial/ethnic diversity, with 1.79 percent Asian American, 6.73 percent African American, 9.46 percent Hispanic/Latino, 3.31 percent multi-racial, and 78.72 percent white. Among students who enrolled in algebra II, 1.88 percent were Asian American, 1.58 percent were African American, 3.32 percent were Hispanic/Latino, 1.26 percent were multi-racial, and 91.96 percent were white. Students who enrolled in trigonometry had the least racial/ethnic diversity, with 1.86 percent Asian American, 0.82 percent African American, 2.37 percent Hispanic/Latino, 1.30 percent multi-racial, and 93.65 percent white. Among students who enrolled in pre-calculus, 2.90 percent were Asian American, 1.30 percent were African American, 2.93 percent were Hispanic/Latino, 1.35
percent were multi-racial, and 91.52 percent were white. Among students who enrolled in calculus, 2.86 percent were Asian American, 0.51 percent were African American, 3.37 percent were Hispanic/Latino, 1.28 percent were multi-racial, and 91.98 percent were white. Among students who enrolled in AP calculus, 4.47 percent were Asian American, 0.73 percent were African American, 2.71 percent were Hispanic/Latino, 1.17 percent were multi-racial, and 90.91 percent were white. Among students who enrolled in AP statistics, 3.53 percent were Asian American, 1.77 percent were African American, 2.83 percent were Hispanic/Latino, 1.59 percent were multi-racial, and 90.28 percent were white.
Students who did not enroll in algebra II had the highest percent of low socioeconomic status (36.00 percent). They are followed by students who enrolled in algebra II (13.81 percent), pre-calculus (11.18 percent), calculus (10.52 percent),
trigonometry (9.14 percent), AP calculus (7.77 percent), and AP statistics (7.60 percent). Students who did not enroll in algebra II had the highest percentage of English language learners (1.47 percent). They are followed by students who enrolled in calculus (0.36 percent), AP statistics (0.35 percent), algebra II (0.28 percent), trigonometry (0.18 percent), and pre-calculus (0.13 percent). None of the students who enrolled in AP calculus were English language learners. Students who did not enroll in algebra II had the highest percent of disabilities (7.67 percent). They are followed by students who enrolled in algebra II (0.60 percent), pre-calculus (0.31 percent), trigonometry (0.20 percent), AP statistics (0.18 percent), calculus (0.15 percent), and AP calculus (0.07 percent).